RE
VIE
W
1 Programa de Pós-Graduação em Ciências Farmacêuticas, Universidade Federal do Amazonas. Av. General Rodrigo Octavio Jordão Ramos 1200, Coroado I. 69067-005 Manaus AM Brasil. lima.vanessagomes@ gmail.com
Prevalence of medicine use among Brazilian adults:
a systematic review
Abstract The use of medicine in adults has been assessed by some population-based studies in Bra-zil, but to date there has been no overall estimate of the prevalence of drug consumption. We therefore aimed to estimate the prevalence of medicine use as measured in previously reported cross-section-al studies among Brazilian adults. We conducted a systematic review of the literature, searching in MEDLINE, Embase among others to a date ending January 2017. Two researchers selected the studies, extracted data and assessed methodological qual-ity of those chosen for inclusion. The consumption prevalence were combined in meta-analyses, the heterogeneity measured by I² and investigated by subgroup analyses and meta-regression. The search identified 4,005 publications, of which 14 were ultimately included in the study. Most studies (12/14) measured the consumption over the previ-ous 15 days, finding a consumption prevalence of 49.1% (95% CI: 48.5-49.6%, I² = 100%). The re-call period explains part of the heterogeneity found (R² = 23%, p = 0.048), however the subgroup analysis did not allow for more homogeneous re-sults. The use of medications occurs among almost half of all Brazilian adults. Appropriate pharma-ceutical assistance and care are necessary to ensure the rational use of these technologies.
Key words Drug utilization, Cross-sectional studies, Review, Adult, Brazil
Vanessa Pereira Gomes 1
Marcus Tolentino Silva 1
Go
mes VP
Introduction
Medicines play an important role in the delivery of care and in the impact on health. Therefore, issues of access and quality of consumption in Brazil have been at the center of several public
policies over the years1-4. The improvement of
pharmaceutical services has also been one of the millennium goals as a commitment to guarantee
the right to health5, highlighting the relevance of
access to these technologies by the population. Increased access to medicines is a benefit that carries inherent risks, such as adverse reactions and medication errors, generating more public
spending on health6,7. Drug use studies can be
useful tools in the development of strategies that favor proper and continuous consumption and access8.
A review of drug use studies conducted in Brazil found that the analysis of the consump-tion pattern of these technologies and the profile of this consumption is the most common objec-tive among surveys that draw mostly on popula-tion-based data9,10.
Data regarding availability and access, re-quired for the study of drug use, may also come
from computerized systems11. Although these
digital resources can offer a practical way of ob-taining prescription data and consumption pat-terns, such systems are still not common in many
countries including Brazil12,13.
While the use of drugs in adults has been evaluated by some population-based studies in Brazil, summaries of the prevalence of drug con-sumption obtained in these studies have yet to be recorded.
The objective of the present study was to esti-mate the prevalence of drug use in adults in Bra-zil through a systematic review of cross-sectional population-based studies.
Methods
Outline and protocol recording
This is a systematic literature review, whose protocol was recorded in the International Pro-spective Register of Systematic Reviews (PROS-PERO).
Eligibility criteria
We selected cross-sectional population-based studies that evaluated the prevalence of medicine
use in adults (≥ 18 years) living in Brazil. Other
delineations were not eligible due to the low ex-ternal validity of studies lacking population rep-resentativeness.
Studies limited to the consumption of drugs in a particular class of medications, specific dis-eases or other special conditions were excluded, as well as those that restricted the research to the elderly or children, in order to ensure the popula-tion representativeness concerning consumppopula-tion.
Information sources
We searched the Medline, Embase, Scopus, Latin American and Caribbean Health Sciences Center (Lilacs), Scientific Eletronic Library On-line (SciELO) and Bank of Thesis of the Coor-dination of Improvement of Higher Education Personnel (CAPES) databases. The microdata of national surveys were also researched through contact with experts and surveys on institutional websites. (Last update was on 1/17/2017.) There was no restriction regarding language or date of publication in the search.
Search strategy
Search strategy on Medline (via PubMed) was: (“Drug Utilization”[TIAB] OR “Drug Uti-lizations”[TIAB] OR “Drug Utilization”[Mesh] OR “Pharmacoepidemiology”[Mesh] OR “Pharmacoepidemiology”[TIAB] OR “Pharma-ceutical Epidemiology”[TIAB]) OR ((“Health Surveys”[Mesh] OR “Surveys”[TIAB] OR “Survey”[TIAB] OR “Cross-Sectional Stud-ies”[Mesh] OR “Prevalence”[TIAB] OR “Fre-quency”[TIAB]) AND (“Pharmacology”[TIAB] OR “Drug”[TIAB] OR “Drugs”[TIAB] OR “Medicine”[TIAB] OR “Remedy”[TIAB] OR “Medication”[TIAB])) AND (“Brazil”[Mesh] OR “Brazil”[TIAB] OR “Brasil”[TIAB]) AND (“Population”[Mesh] OR “Population” [TIAB] OR “Populations” [TIAB] OR “population-based study”[TIAB]). We adapted this strategy to the other bibliographic sources.
Study selection
re-e C
ole
tiv
a,
22(8):2615-2626,
2017
viewers were not blind to the authorship of the manuscripts.
Extraction of data
Data were extracted by one author (VPG) and confirmed by another (TFG). The following variables were extracted: year of survey, location, sample type, age group, sample size, recall period, prevalence of drug use and type of drug evalua-tion. (In cases where information was not avail-able or unclear, we contacted the authors.) From the studies that employed statistical models, we extracted factors positively associated with con-sumption and variables. The information needed to measure the consumption of drugs was ex-tracted from adults between the ages of 18 and 65, when possible, or in the closest age group.
Quality assessment
For the assessment of quality we adapted the
tool standardized by Loney et al.14. Nine items
were evaluated: (i) Adequate sampling (proba-bilistic sampling or universe), (ii) Source of the sample list (census of the Brazilian Institute of Geography and Statistics [IBGE]), (iii) Size of adequate sample (statistically calculated) , (iv) Adequate measurement of outcome (confirma-tion of medical prescrip(confirma-tion and/or packaging of medication), (v) Recall period (up to 15 days) 14, (vi) Unbiased raters (trained interviewers), (vii) Adequate response rate (refusals and attrition of up to 70%), (viii) Presentation of results (prev-alence with confidence intervals and relevant subgroups), (ix) Participants similar to the study (adults only included in sample). For each item that met the criteria, the study received a point.
Data analysis
Initially the local populations were obtained from the period in which each study was
per-formed according to the IBGE15 census, then the
meta-analysis of the prevalence of medication consumption was calculated by means of the Freeman-Tukey double-arcosene transformation to stabilize the variances16.
The prevalence was stratified by the recall period and heterogeneity was estimated using
the inverse of the variance to calculate I2 and
chi-square (p <0.10).
To verify the possible causes of heterogene-ity we performed meta-regression and sensitivheterogene-ity analysis.
In the meta-regression by the modified
Knapp-Hartung method17 the effect of the
vari-ables (recall period, proportion of women, quali-ty score, minimum age and year of research) was investigated in the variability observed among the prevalence studies. Surveys with discrepant results were excluded to verify their influence on the result.
In the subgroup analysis, only those studies with similar characteristics were included in the meta-analysis: recall period less than or equal to 15 days, research performed after year 2000, quality score = 9 and southeast region. Stata soft-ware version 14.1 was used for all analyzes.
Results
Selection of studies
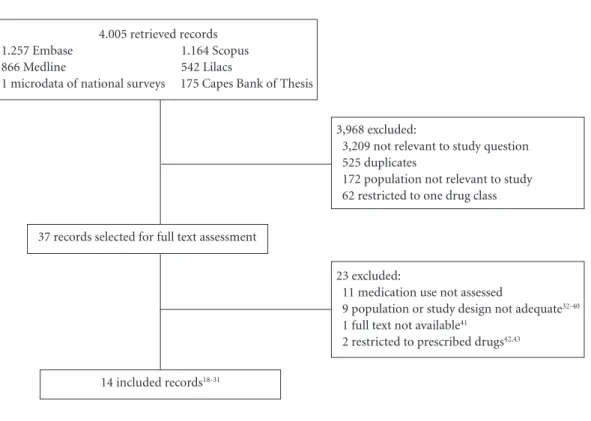
In the literature review, 4,005 publications were retrieved, of which 37 were evaluated in full
text. In the end, 14 studies18-31 were judged to be
worthy of inclusion, which in total involved the assessment of some 57,700 adults (Figure 1).
Study characteristics
Of the 14 articles included, nine collected
data from the year 200023-31 and seven occurred
in the southeast region18,19,22,24,27,28,30. All studies
used probabilistic sampling based on the IBGE census. The recall period ranged from three to 90 days prior to the interview. Confirmation of the name of the drug occurred in half of the studies through the package or prescription (Table 1).
Quality assessment
Six studies met all criteria for
methodolog-ical quality23,24,27-30 as described in Table 1. With
the exception of one study involving only adults
aged 18-65 years29, the others involved the
elder-ly18-28,30,31 and / or children18-21,24,25,28 (Table 1). It
was possible to obtain data on drug consump-tion of adults aged 18 years or older in 13 stud-ies18-20,22-31. One survey did not report data from
adults separately from those of children; For the purpose of calculations, we separated out
partic-ipants over 12 years of age21.
One study measured the use of medications for continuous use for chronic diseases without mentioning the recall period, and for drugs of occasional use the period measured was the
there-Go
mes VP
fore consider 15 days as the study recall period, with the interpretation that continuous use was also involved during the period.
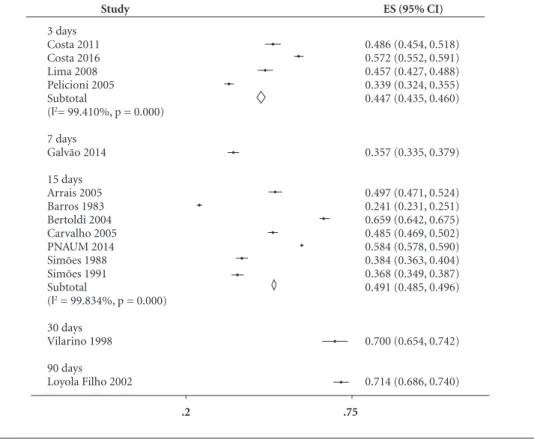
Outcomes
Most of the studies (12) evaluated the con-sumption in the last 15 days prior to the in-terview, and the use of drugs was reported by
49.1%18-20,23-31 The highest prevalence of drug
consumption was 71.4% recalling the previous
90 days22, followed by the prevalence of 70.0% in
the month21. The prevalence in the previous week
was evaluated in an investigation29, being 35.7%;
in the previous three days it was 44.7%,
evaluat-ed by four investigations24,27,28,30. The prevalence
summary and respective confidence intervals (95% CI) are presented in the meta-analysis as a proportion, not converted to a percentage (Fig-ure 2).
Estimates were of high heterogeneity, the sub-group analysis did not identify the possible caus-es for the differenccaus-es between the rcaus-esults of the studies, nor did it lead to more homogeneous
re-sults (Table 2). The recall period explains 22.9% of the variance found (p = 0.048). A discrepant point was observed in the meta-regression in the
study of a longer recall period (90 days)22. In
or-der to ascertain the influence of this study it was excluded, and the association between the recall period and the variation between the studies lost significance. The other variables explored – year of data collection, methodological quality, pro-portion of women and minimum age of study participation’ – were not significant (p > 0.05).
Among the articles included in the review, five performed adjustment models for drug
con-sumption22,23,25,28,29. Among the associated factors,
females were positively associated in all studies, while advanced age was associated in four of these and presence of chronic disease in three (Chart 1).
Discussion
About half of the Brazilian population has been using or has used some sort of medication in
4.005 retrieved records
1.257 Embase 1.164 Scopus
866 Medline 542 Lilacs
1 microdata of national surveys 175 Capes Bank of Thesis
3,968 excluded:
3,209 not relevant to study question 525 duplicates
172 population not relevant to study 62 restricted to one drug class
23 excluded:
11 medication use not assessed
9 population or study design not adequate32-40
1 full text not available41
2 restricted to prescribed drugs42,43
14 included records18-31
37 records selected for full text assessment
e C ole tiv a, 22(8):2615-2626, 2017
recent weeks. The estimates emerging from the studies suggest great variability in the results, but nonetheless provide an approximate picture of drug use among Brazilian adults.
The recall period was the only factor signifi-cantly associated with the variability found. Large heterogeneity are indicative of the differences among the primary studies that provided the data to inform the meta-analyses. Because they
are studies conducted in different periods and regions, differences between the estimated prev-alence would be expected, despite being from the same population (adults) from the same country (Brazil).
High heterogeneity in prevalence studies is
common16. Regional differences (income, access
to services), outcome measures, population, year and/or period of the year in which the survey
Table 1. Characteristics of included studies.
Study Year of research
City, Federative
Unit
Sampling technique a
Age (adult),
years b
Size of sampling
(adult) b
Period, days Type of medication assessment Quality score Barros 1983b18 1978 Ribeirão Preto, SP Conglomerates All
(≥ 20-69)
6,988 (3,836)
15 Interview 7 g,h
Simões e Farache Filho 198819
1985 Araraquara,
SP
Conglomerates All (≥ 20) 2,150
(1,343)
15 Interview 6 d,f,g
Simões 199120
1987 Humaitá,
AM
Systematic All (≥ 20) 2,422 (881) 15 Interview 6 d,f,g
Vilarino et al. 199821
1994-1995 Santa Maria, RS Systematic and conglomerates
All (> 12) 413 (212) 30 Interview 6 e,f,i
Loyola Filho et al. 200222
1996-1997
Bambuí, MG
Simple random Adults
(≥ 18)
1,086 90 Interview 8e
Bertoldi et al. 200423
2002 Pelotas, RS Systematic Adults
(≥ 18-65)
3,182 (2,790) 15 Interview, packing or prescription 9 Pelicioni 200524 2001-2002 São Paulo, SP Conglomerates and stratified
All (≥20) 3,646
(1,913)
3 Interview,
packing
9
Arrais et al. 200525 2002-2003 Fortaleza, CE Stratified, census All (20-64)
1,366 (754) 15 Interview 8i
Carvalho et al. 200526
2003 Brasil Stratified Adults
(18-59)
3,554 (2,930)
15 Packing 7d,g
Lima et al. 2008 b27
2001-2002 Botucatu, SP Conglomerates and stratified Adults (18-65)
1,023 (614) 3 Interview,
packing
9
Costa et al. 201128 2001-2002 Campinas, SP Conglomerates and stratified All (18-59)
941 (515) 3 Interview,
packing
9
Galvão et al. 201429
2012 Brasília, DF Conglomerates
and stratified Adults (18-65) 2,051 (1,820) 7 Interview, packing 9
Costa et al. 201630 2008 Campinas, São Paulo Conglomerates and stratified Adults (20-69) 2,476 (1,777)
3 Interview 9
PNAUM 201431 2013-2014 Brazil Conglomerates, stratified Adults (18-65) 32,652 (26,633) 15 Interview, packing, prescription or leaflet
7 g,h
Go
mes VP
was conducted and rate of refusal were common causes of heterogeneity in prevalence reviews. In order to reduce and investigate heterogeneous re-sults, we used proximal ages, categorized by sim-ilar recall period. We further evaluated the qual-ity of the studies, analyzing separately those of higher quality – including only population-based
studies – and explored the results by subgroup
analysis and meta-regression44.
The lack of methodological standardization and categorization of the age range of the in-cluded studies may have been some of the fac-tors responsible for the high heterogeneity. Some recommendations such as a 15-day recall period,
Figure 2. Prevalence of medicine consumption according to the recall period.
Study
3 days Costa 2011 Costa 2016 Lima 2008 Pelicioni 2005 Subtotal
(l2= 99.410%, p = 0.000) 7 days
Galvão 2014 15 days Arrais 2005 Barros 1983 Bertoldi 2004 Carvalho 2005 PNAUM 2014 Simões 1988 Simões 1991 Subtotal
(l2 = 99.834%, p = 0.000) 30 days
Vilarino 1998 90 days Loyola Filho 2002
ES (95% CI)
0.486 (0.454, 0.518) 0.572 (0.552, 0.591) 0.457 (0.427, 0.488) 0.339 (0.324, 0.355) 0.447 (0.435, 0.460)
0.357 (0.335, 0.379)
0.497 (0.471, 0.524) 0.241 (0.231, 0.251) 0.659 (0.642, 0.675) 0.485 (0.469, 0.502) 0.584 (0.578, 0.590) 0.384 (0.363, 0.404) 0.368 (0.349, 0.387) 0.491 (0.485, 0.496)
0.700 (0.654, 0.742)
0.714 (0.686, 0.740)
.2 .75
Table 2. Sensitivity analysis to investigate causes of heterogeneity.
Analyzed factors
Number of studies (reference)
Total of participants
Prevalence, % (95% IC)
Heterogeneity
I2 (%) p-value of Qui2
Recall period ≤ 15 days 1218-20,23-31 56,201 47,6 (47.2-48.1) 99.8 < 0.001
Research conducted from
the year 2000 923-31 44,641 54,0 (53.5-54.5) 99.4 < 0.001
Quality score = 9 623,24,27-30 13,088 48,2 (47.2-49.3) 99.7 < 0.001
Southeast region 718,19,22,24,27,28,30 18,310 41,2 (40.1-42.2) 99.6 < 0.001
e C
ole
tiv
a,
22(8):2615-2626,
2017
categorization of age groups (children, adults, and the elderly) are proposed in the study area
of medication use29. Such guidelines favor the
measurement of the data and help in monitoring the drug use. Other important data, like the pro-portion of people with chronic diseases and the main drugs involved, would aid in the evaluation and explanation of the results, but were not sys-tematically reported in the studies.
In spite of the heterogeneity found, the con-siderable proportion of the population that uses drugs underscores the importance that this con-sumption be accompanied by the necessary in-formation for its rational use. Guidelines made by the pharmaceutical professional can minimize problems related to the use of medication and promote the quality, safety and efficacy of the
drug through pharmaceutical care45,46.
In addition to these aspects of the included studies, the present study has as a limitation the non-inclusion of primary data directly from health systems such as the National System of Controlled Products Management (SNGPC) and others from the Unified Health System (SUS), such as the Na-tional Pharmaceutical Services Management Sys-tem (Horus), SUS electronic sysSys-tems (e-SUS) and Outpatient Information System of the National Health System (SIA/SUS). On the other hand, it was sensitive and robust as far as it included stud-ies published with population representativeness, bringing to light national estimates of drug con-sumption in the population. The results present-ed here therefore provide information about the general use of these technologies in the Brazilian population, allowing insight into its general scope and comparability with other contexts.
Chart 1. Factors associated with medication consumption
Study Statistical
adjustment model Variables of the model
Factors positively associated with medicine consumption
Loyola Filho et al. 200222
Multinomial logistic regression adjusted for confounding variables.
Sex, age, number of residents and the following data in the last 12 months: number of medical consultations, consultation to the pharmacist and monetary expenses on medicines.
Female, age 18-39 years, and consult the pharmacist in the last 12 months.
Bertoldi et al. 200423
Poisson regression adjusted with variables that remained significant p value between 5 and 20%
Age, schooling, economic status, current marital status, smoking, low physical activity, BMI and self-perception of health.
Female gender, advanced age, higher economic level, smokers and ex-smokers, low physical activity and poor self-perception of health.
Arrais et al. 200525
Poisson regression adjusted by hierarchical model
Monthly family income, schooling, occupation, sex, age, marital status, number of residents at home, chronic diseases, health insurance, consultation in the last 3 months, hospitalization in the last 12 months and self-perception of health.
Female gender, advanced age, monthly family income greater than 3 minimum wages, schooling greater than 8 years, chronic diseases, health plan, consultations in the last 3 months.
Costa et al. 201128
Poisson regression adjusted by sex and age
Sex, age, number of chronic diseases and morbidity in the last 15 days.
Female gender, advanced age, chronic disease, income from 4 minimum wages and morbidity in the last 15 days.
Galvão et al. 201429
Poisson regression with robust variance adjusted by hierarchical model
Economic level, schooling, occupation, sex, age, marital status, number of residents per household, chronic self-reported diseases, access to medical care, self-perception of health status.
Female, advanced age, chronic illness, unemployed or retired, pain or discomfort, problems with self-care and consultations in the last 3 months.
Notes: articles that did not present adjustment models specifically for drug consumption: Barros 198318, Simões & Farache Filho
Go
mes VP
Of the factors associated with drug consump-tion, female sex stood out most significantly,
sup-porting the findings of other countries47-49. The
search for health care services is higher among women, with the concomitant effect of greater prescription and use of medicines among that
demographic49,50. A survey of five community
pharmacies randomly selected in northern Italy found that women are the most frequent patrons in the purchase of medications and supplements after obtaining information on the internet (30%
compared to 20% of men, p < 0.01)51.
Other factors that were associated were age and presence of chronic diseases. A population survey carried out in Spain in 2013 of 2,700 peo-ple observed that drug consumption increases with age and with the prevalence of chronic dis-eases: people over 65 years old consume about
five more drugs than adults below this age52. The
association between advanced age and the use of polypharmacy are factors that favor the
occur-rence of adverse reactions53.
In Brazil, a descriptive study with data from the National Health Survey of 2013 observed that the prevalence of the use of drugs to treat chronic diseases was approximately 80% in the treatment
of hypertension, diabetes and asthma54. The use
changed according to region, sex and age. In hy-pertensive patients, for example, the prevalence of consumption was 82%, with greater use by
women and individuals over 75 years of age54 –
a result similar to the one found in the present review in which drug use was shown to be influ-enced by gender, advanced age and presence of chronic diseases.
Although drug use is part of health care, it is important to emphasize that these technologies also pose risks to health, requiring their use in
a rational way55. The consumption of medicines
must be accompanied by the essential orientation for their proper use. A systematic review of clin-ical trials has shown that intervention through pharmaceutical care has significantly improved health-related quality of life, presenting itself as
an auxiliary tool to promote well-being56.
Medicines are the main cause of poisoning registered by Poison Control Centers (PCC) in different contexts. In the United States, about 2 million cases of exposure to toxic agents were re-ported in 2015, of which 1,473,638 were caused
by pharmaceuticals57. Of the total number of
drug poisonings, 275,979 (20%) were caused by therapeutic errors caused by: duplication of dose (30%), wrong product (17%), wrong dose (15%), wrong interval between doses (11%) and
medication by another person (8%). In addition to causing most of the poisonings, medicines were the main responsible for deaths resulting from poisoning (1,108 cases, 80% of the total). Among the most involved were analgesics, stim-ulants and those acting on the cardiovascular system57.
In Brazil, although there are no data identi-fying the most common class or active principle, the use of medicine has proven to be the main cause of poisoning attended by Brazilian PCC in
recent years58. The reason for poisoning in
gen-eral (drug specific data not available) is mainly individual accident (57%) and suicide attempt (16%).
An analysis of the 30-year time trend of tox-icological treatment of North American PCC (1984-2013) revealed increased deaths and
sever-ity of poisoning59. Severity and lethality increased
with exposure to a greater number of substances. During the period 2006-2013, it was observed that each additional product involved in one exposure led to an additional 221 deaths, an in-crease of 18% in the growth in fatalities related to
consumption of three or more substances59.
The increase in the number of poisonings per drug over the years in the United States has been accompanied by the growth of adult drug use. An analysis of the National Health and Nutrition Examination Survey surveys conducted between 1999 and 2012 noted that the prevalence of drug use in the last 30 days was 51% in the first
de-cade, rising to 59% in the years 2011-201260. This
growth was statistically significant (p <0.001), and the proportion of increase (around 10%) was similar to the increase in poisoning in the
period59. Surveys included 37,959 adults in total.
Electronic health systems are tools that can provide useful information for both administra-tive and managerial purposes as well as patient care. Some information available on outpatient records includes laboratory results, procedures performed, diagnoses, dispensing records and the possibility of monitoring possible drug inter-actions11.
In Brazil, the availability of electronic infor-mation is still limited, but enough to study the use of drugs in specific populations. The SIA/
SUS61 makes it possible to evaluate the
dispens-ing of drugs from the Specialized Component of Pharmaceutical Care, released through the Authorization of High Complexity Procedures
(APAC)62,63. The analysis of these data requires
e C
ole
tiv
a,
22(8):2615-2626,
2017
every three months. Such studies are still not fre-quent, but can nevertheless provide strategic in-formation: a cohort of patients with Alzheimer’s disease was elaborated from the APAC subsystem of the SIA/SUS. Developments in this cohort will enable the evaluation of the drug utilization profile through validated adherence measures, as well as patient follow-up within six months of
re-plenishing prescription63.
Another tool available from drug sales data is SNGPC, which contains the daily movements of drugs and substances subject to special control that are sent to the National Sanitary Surveillance Agency electronically from all pharmacies and
drugstores licensed for sale64. From these data,
an ecological study was developed that correlated the consumption of benzodiazepine anxiolytics
and demographic characteristics of the regions65.
Cities with a higher demographic density and higher concentrations of physicians had higher
consumption of these drugs65, which may be
re-lated to the higher purchasing power of the
pop-ulation of these cities66, since the data used for
this research were of commercial origin.
The Nordic countries (Denmark, Finland, Iceland, Norway and Sweden) have electronic systems that record all drugs dispensed and a da-tabase with potential for linkage in the follow-up of adverse reactions, routine care and the use of
medicines. These systems are comprehensive in informing public and private data on the con-sumption of all types of drugs, not only those subject to special control67.
In Brazil, electronic systems are fragment-ed, not providing complete and comprehensive information: the same patient may appear in more than one system and identifying that it
is the same person is not always possible63,65,68.
These limitations make cross-sectional popula-tion-based studies a necessity to properly assess the patterns of access and use of these technolo-gies. A concrete example of this demand was the funding by the Ministry of Health of the Nation-al Survey on Access, Use and Promotion of the Rational Use of Medicines (PNAUM), with 41 thousand people interviewed throughout Brazil
between 2013 and 201469.
In conclusion, the use of drugs is common among Brazilian adults and is more frequent in women. The results reported here have limita-tions due to differences between studies. In terms of practice, the results reveal a high demand for pharmaceutical care in society to enable the ra-tional use of these technologies. Future invest-ments should prioritize the development and analysis of comprehensive computer systems that provide better information regarding products and groups at greater risk.
Collaborations
Go
mes VP
Acknowledgements
The authors would like to thank Eliana Bra-sil Alves, from the University Hospital Getúlio Vargas, Federal University of Amazonas, for her assistance in the selection of studies and Pau-lo Henrique Faria Domingues, Emília Vitória da Silva and Mauricio Gomes Pereira, from the University of Brasília, for their collaboration in initial and pilot design of the study.
The research was funded by the Foundation for Research Support of the State of Amazonas (FAPEAM), which awarded a master’s degree to VP Gomes.
This publication was funded by the Program for the Publication of Scientific Papers (PAPAC) of FAPEAM, granted to TF Galvão.
References
1. Brasil. Ministério da Saúde (MS). Política Nacional de Medicamentos. Brasília: MS; 2001.
2. Brasil. Ministério da Saúde (MS). Resolução nº 8.338, de 06 de maio de 2004.Política Nacional de Assistência Farmacêutica e estabelecimento dos princípios gerais e eixos estratégicos. Diário Oficial da União 2004; 7 maio. 3. Brasil. Ministério da Saúde (MS). Lei nº 9.787, de 10 de fevereiro de 1999. Dispõe sobre a vigilância sanitária, estabelece o medicamento genérico, dispõe sobre a uti-lização de nomes genéricos em produtos farmacêuticos e dá outras providências. Diário Oficial da União 1999; 11 fev.
4. Brasil. Ministério da Saúde (MS). Portaria nº 1.214, de 13 de junho de 2012. Institui o Programa Nacional de Qualificação da Assistência Farmacêutica âmbito do Sistema Único de Saúde (QUALIFAR- SUS). Diário Oficial da União 2012; 14 jun.
5. United Nations. United Nations Millennium Declara-tion. Lisbon: United Nations Information; 2001. 6. Pfaffenbach G, Carvalho OM, Bergsten-Mendes G.
Reações adversas a medicamentos como determinantes da admissão hospitalar. Rev Assoc Med Bras 2002; 48(3):237-241.
7. Souza TT, Godoy RR, Rotta I, Pontarolo R, Fernan-dez F. Morbidade e mortalidade relacionadas a me-dicamentos no Brasil: revisão sistemática de estudos observacionais. Rev de Cien Farm Básica e Apl. 2014; 35(4):519-532.
8. Wettermark B, Elseviers M, Almarsdóttir AB, Andersen M, Benko R, Bennie M, Eriksson I, Godman B, Krska J, Poluzzi E, Taxis K, Stichele RV, Vlahovic-Palcevski V. Introduction to drug utilization research. In: Poluzzi E, Eriksson I, Godman B, Bennie M, Krska J, Stichele RV, editors. Drug Utilization Research. New Jersey: John Wiley & Sons Ltd; 2016. p. 1-12.
9. Eriksson I, Ibáñez L. Secondary data sources for drug utilization research. In: Poluzzi E, Eriksson I, Godman B, Bennie M, Krska J, Stichele RV, editors. Drug Utili-zation Research. New Jersey: John Wiley & Sons, Ltd; 2016. p. 39-48.
10. Cameron A, Ewen M, Ross-Degnan D, Ball D, Laing R. Medicine prices, availability, and affordability in 36 developing and middle-income countries: a secondary analysis. Lancet 373(9659):240-249.
11. Wettermark B, Martino MD, Elseviers M. Study designs in drug utilization research. In: Poluzzi E, Eriksson I, Godman B, Bennie M, Krska J, Stichele RV, editors. Drug Utilization Research. New Jersey: John Wiley & Sons Ltd.; 2016. p. 13-28.
12. Baldoni AdO, Guidoni CM, Pereira LRL. A farmaco-epidemiologia no Brasil: estado da arte da produção científica. Revista da Universidade Vale do Rio Verde 2011; 9(1).
13. Leite SN, Vieira M, Veber AP. Estudos de utilização de medicamentos: uma síntese de artigos publicados no Brasil e América Latina. Cien Saude Colet 2008; 13(Supl.):793-802.
e C
ole
tiv
a,
22(8):2615-2626,
2017
15. Instituto Brasileiro de Geografia e Estatística (IBGE). 2016. [cited 2017 jan 17]. Available from: http://ci-dades.ibge.gov.br/xtras/home.php?lang=
16. Barendregt JJ, Doi SA, Lee YY, Norman RE, Vos T. Me-ta-analysis of prevalence. J epidemiol Comm Health 2013; 67(11):974-978.
17. Knapp G, Hartung J. Improved tests for a random ef-fects meta regression with a single covariate. Statistics in medicine 2003; 22(17):2693-2710.
18. Barros M. Saúde e calsse social: um estudo sobre mor-bidade e consumo de medicamentos. Ribeirão Preto: Universidade de são Paulo; 1983.
19. Simões MJ, Farache Filho A. Consumption of drugs in a region of the State of São Paulo (Brazil), 1985. Rev Saude Publica 1988; 22(6):494-949.
20. Simões MJ. Consumo de medicamentos e morbidade em humaitá estado do Amazonas (Brasil), 1987. Rev Ciên Farm 1991; 13:12.
21. Vilarino JF, Soares IC, da Silveira CM, Rödel AP, Bortoli R, Lemos RR. Self-medication profile in a city of south Brazil. Rev Saude Publica 1998; 32(1):43-49.
22. Loyola Filho AI, Uchoa E, Guerra HL, Firmo JO, Li-ma-Costa MF. Prevalence and factors associated with self-medication: the Bambuí health survey. Rev Saude Publica 2002; 36(1):55-62.
23. Bertoldi AD, Barros AJ, Hallal PC, Lima RC. Drug uti-lization in adults: prevalence and individuals determi-nants. Rev Saude Publica 2004; 38(2):228-238. 24. Pelicioni A. Padrão de consumo de medicamentos em
duas áreas da região metropolitana de São Paulo. São Paulo: Universidade de São Paulo; 2005
25. Arrais PS, Brito LL, Barreto ML, Coelho HL. Preva-lence and determinants of medicines consumption in Fortaleza, Ceará, Brazil. Cad Saude Publica 2005; 21(6):1737-1746.
26. Carvalho MF, Pascom AR, Souza-Júnior PR, Damace-na GN, Szwarcwald CL. Utilization of medicines by the Brazilian population, 2003. Cad Saude Publica 2005; 21(Supl.):100-108.
27. Lima MC, Menezes PR, Carandina L, Cesar CL, Barros MB, Goldbaum M. Common mental disorders and the use of psychoactive drugs: the impact of socioeconom-ic conditions. Rev Saude Publica 2008; 42(4):717-723. 28. Costa KS, Barros MB, Francisco PM, César CL,
Gold-baum M, Carandina L. Use of medication and associat-ed factors: a population-basassociat-ed study in Campinas, São Paulo State, Brazil. Cad Saude Publica 2011; 27(4):649-658.
29. Galvao TF, Silva MT, Gross R, Pereira MG. Medication use in adults living in Brasilia, Brazil: a cross-sectional, population-based study. Pharmacoepidemiol Drug Saf 2014; 23(5):507-514.
30. Costa KS, Francisco PMSB, Barros MBA. Utilização e fontes de obtenção de medicamentos: um estudo de base populacional no Município de Campinas, São Paulo, Brasil. Cad Saude Publica. 2016; 32(1).
31. Brasil. Ministério da Saúde (MS). Pesquisa Nacional sobre Acesso, Utilização e Promoção do Uso Racional de Medicamentos no Brasil (PNAUM): resultados prelimin-ares. Brasília: MS; 2014.
32. Vitor RS, Lopes CP, Menezes HS, Kerkhoff CE. Pattern of drug consumption without medical prescription in the city of Porto Alegre, RS. Cien Saude Colet 2008; 13(Supl.):737-743.
33. Fleith VD, Figueiredo MA, Figueiredo KF, Moura EC. Pattern of medicine consumption among users of the primary health care services in Lorena, SP. Cien Saude Colet 2008; 13(Supl.):755-762.
34. Franco R, Carvalho Neto J, Khouri M, Nunes M, Santos Júnior J, Marques Neto J, Santana VS, Almeida Filho N. Consumo de medicamentos em um grupo popula-cional da área urbana de Salvador - BA. Rev Bai Saúde Públ 1987; 13/14(4/1):113-121.
35. Vosgerau M, Soares D, Souza R. Automedicação entre adultos na área de abrangência de uma Unidade Saúde da Família. Latin American Journal of Pharmacy 2008; 27(6):8.
36. Bertoldi AD, de Barros AJ, Wagner A, Ross-Degnan D, Hallal PC. Medicine access and utilization in a popu-lation covered by primary health care in Brazil. Health Policy 2009; 89(3):295-302.
37. Schmid B, Bernal R, Silva NN. Self-medication in low-income adults in Southeastern Brazil. Rev Saude Publica 2010; 44(6):1039-1045.
38. Mastroianni PeC, Lucchetta RC, Sarra JoR, Galduróz JC. Household storage and use of medications in a population served by the family health strategy in Bra-zil. Rev Panam Salud Publica 2011; 29(5):358-364. 39. Boing AC, Bertoldi AD, Peres KG. Socioeconomic
in-equalities in expenditures and income committed to the purchase of medicines in Southern Brazil. Rev Saude Publica 2011; 45(5):897-905.
40. Silva Simões MJ, Farache Filho A, Alves Cardoso R. Evaluation of consumption of medications following a pharmacology class, Araraquara, S.P.-1985. Rev Fac Odontol Ribeiro Preto 1986; 23(2):219-223.
41. Rodrigues M. Utilização e armazenamento de medi-camentos e produtos naturais para fins terapêuticos em Cuiabá, Mato Grosso, 1996 [tese]. Cuiabá: Universidade Federal de Mato Grosso; 1998.
42. Boing AC, Bertoldi AD, Boing AF, Bastos JL, Peres KG. Access to medicines in the public sector: analysis of users of the Brazilian Unified National Health System. Cad Saude Publica 2013; 29(4):691-701.
43. Pinto MCX, Ferré F, Pinheiro MLP. Potentially inap-propriate medication use in a city of Southeast Brazil. Braz J Pharm Sci 2012; 48(1):79-86.
44. Higgins J, Green S. Cochrane Handbook for Systematic Reviews of Interventions. London: Cochrane; 2011. 45. Viswanathan M, Kahwati LC, Golin CE, Blalock SJ,
Coker-Schwimmer E, Posey R, Lhor KN. Medication therapy management interventions in outpatient set-tings: a systematic review and meta-analysis. JAMA Intern Med 2015; 175(1):76-87.
46. Araujo ALA, Pereira LRL, Ueta JM, Freitas O. Perfil da assistência farmacêutica na atenção primária do Sistema Único de Saúde. Cien Saude Colet 2008; 13(Supl.):611-617.
Go
mes VP
48. Kaufman DW, Kelly JP, Rosenberg L, Anderson TE, Mitchell AA. Recent patterns of medication use in the ambulatory adult population of the United States: the Slone survey. JAMA 2002; 287(3):337-344.
49. Hovstadius B, Astrand B, Petersson G. Dispensed drugs and multiple medications in the Swedish population: an individual-based register study. BMC Clin Pharma-col 2009; 9:11.
50. Loikas D, Wettermark B, von Euler M, Bergman U, Schenck-Gustafsson K. Differences in drug utilisation between men and women: a cross-sectional analysis of all dispensed drugs in Sweden. BMJ Open 2013; 3(5). 51. Lombardo S, Cosentino M. Internet Use for Searching
Information on Medicines and Disease: A Community Pharmacy-Based Survey Among Adult Pharmacy Cus-tomers. Interact J Med Res 2016; 5(3):e22.
52. Carrera-Lasfuentes P, Aguilar-Palacio I, Clemente Roldan E, Malo Fumanal S, Rabanaque Hernandez MJ. Medicine consumption in the adult population: Influence of self-medication. Aten Primaria 2013; 45(10):528-535.
53. Blasco Patiño F, Pérez Maestu R, Martínez López de Letona J, Jiménez AI, García Navarro MJ. Estudio del consumo de fármacos inadecuados o no indicados en el anciano que ingresa en un Servicio de Medicina In-terna. Anales de Medicina Interna 2008; 25(6):269-274. 54. Tavares NUL, Costa KS, Mengue SS, Vieira MLFP,
Malta DC, Silva Júnior JB. Uso de medicamentos para tratamento de doenças crônicas não transmissíveis no Brasil: resultados da Pesquisa Nacional de Saúde, 2013. Epidemiologia e Serviços de Saúde. 2015; 24(2):315-323. 55. World Health Organization (WHO). The world medi-cines situation 2011: rational use of medimedi-cines. Geneva: WHO; 2011.
56. Mohammed MA, Moles RJ, Chen TF. The Impact of Pharmaceutical Care Interventions on Health-Related Quality-of-Life Outcomes: A Systematic Review and Meta-analysis. Ann Pharmacother 2016; 50(10):862-881.
57. Mowry JB, Spyker DA, Brooks DE, Zimmerman A, Schauben JL. Annual Report of the American Associ-ation of Poison Control Centers’ NAssoci-ational Poison Data System (NPDS): 33rd Annual Report. Clinical Toxicolo-gy 2016; 54(10):924-1109.
58. Fundação Oswaldo Cruz (Fiocruz). Casos registrados de intoxicação e/ou envenenamento em 2013. Rio de Janei-ro: Fiocruz; 2013.
59. Greenwald PW, Farmer BM, O’Neill M, Essner RA, Flomenbaum NE. Increasing frequency and fatality of poison control center reported exposures involving medication and multiple substances: data from reports of the American Association of Poison Control Centers 1984-2013. Clin Toxicol (Phila) 2016:1-7.
60. Kantor ED, Rehm CD, Haas JS, Chan AT, Giovannuc-ci EL. Trends in Prescription Drug Use Among Adults in the United States From 1999-2012. JAMA 2015; 314(17):1818-1831.
61. Brasil. Ministério da Saúde (MS). Departamento de Regulação, Avaliação e Controle/Coordenação Geral de Sistemas de Informação: SIA – Sistema de Informação Ambulatorial do SUS: Manual de Operação do Sistema. Brasília: MS; 2016.
62. Nita ME, Secoli SR, Nobre MRC, Ono-Nita SK, Campi-no ACC, Sarti FM, Costa AMN, Carrilho FJ. Avaliação de tecnologias em saúde: Evidência Clínica, Análise Eco-nômica e Análise de Decisão. São Paulo: Artmed Edito-ra; 2009.
63. Soares C, Silva GA. Uso de registros de assistência far-macêutica do Sistema de Informações Ambulatorial para avaliação longitudinal de utilização e adesão a medicamentos. Cad Saude Colet 2013; 21(3):245-252. 64. Brasil. Ministério da Saúde (MS).Resolução da
Dire-toria Colegiada- RDC Nº 22, de 29 de abril de 2014. Dispõe sobre o Sistema Nacional de Gerenciamento de Produtos Controlados –SNGPC, revoga a Resolução de Diretoria Colegiada nº 27, de 30 de março de 2007, e dá outras providências. Diário Oficial da União 2014; 30 abr.
65. Azevedo ÂJPd, Araújo AAd, Ferreira MÂF. Consumo de ansiolíticos benzodiazepínicos: uma correlação entre dados do SNGPC e indicadores sociodemográ-ficos nas capitais brasileiras. Cien Saude Colet 2016; 21(1):83-90.
66. Barata RB. Como e por que as desigualdades sociais fa-zem mal à saúde. Rio de Janeiro: Editora Fiocruz; 2009. 67. Wettermark B, Zoega H, Furu K, Korhonen M, Hallas J, Norgaard M, Almarsdottir A, Andersen M, Andersson Sundell K, Bergman U, Helin-Salmivaara A, Hoffmann M, Kieler H, Martikainen J, Mortensen M, Petzold M, Wallach-Kildemoes H, Wallin C, Sørensen H. The Nor-dic prescription databases as a resource for pharmaco-epidemiological research-a literature review. Pharma-coepidemiol Drug Saf 2013; 22(7):691-699.
68. Martins ELM, Amaral MdPHd, Ferreira MBC, Men-donça AÉd, Pereira MCS, Pereira DC, Ribeiro PM, Bru-mano LP. Dispensações de psicotrópicos anorexígenos no município de Juiz de Fora, Minas Gerais, Brasil. Cien Saude Colet 2012; 17(12):3331-3342.
69. Bermudez JAZ, Barros MBA. Profile of access and use of medicines in the Brazilian population contributions and challenges of PNAUM Household Survey. Rev Saude Publica 2016; 50(Supl. 2):2s.
Article submitted 25/10/2016 Approved 03/02/2017