Sociodemographic profile of medicines
users in Brazil: results from the 2014
PNAUM survey
Andréa Dâmaso BertoldiI, Tatiane da Silva Dal PizzolII, Luiz Roberto RamosIII, Sotero Serrate
MengueIV, Vera Lucia LuizaV, Noemia Urruth Leão TavaresVI, Mareni Rocha FariasVII, Maria
Auxiliadora OliveiraV, Paulo Sergio Dourado ArraisVIII
I Departamento de Medicina Social. Faculdade de Medicina. Universidade Federal de Pelotas. Pelotas, RS, Brasil II Departamento de Produção e Controle de Medicamentos. Faculdade de Farmácia. Universidade Federal do Rio
Grande do Sul. Porto Alegre, RS, Brasil
III Departamento de Medicina Preventiva. Escola Paulista de Medicina. Universidade Federal de São Paulo. São Paulo, SP, Brasil
IV Programa de Pós-Graduação em Epidemiologia. Faculdade de Medicina. Universidade Federal do Rio Grande do Sul. Porto Alegre, RS, Brasil
V Departamento de Política de Medicamentos e Assistência Farmacêutica. Escola Nacional de Saúde Pública Sérgio Arouca. Fundação Oswaldo Cruz. Rio de Janeiro, RJ, Brasil
VI Departamento de Farmácia. Faculdade de Ciências da Saúde. Universidade de Brasília. Brasília, DF, Brasil VII Departamento de Ciências Farmacêuticas. Centro de Ciências da Saúde. Universidade Federal de Santa
Catarina. Florianópolis, SC, Brasil
VIII Departamento de Farmácia. Faculdade de Farmácia, Odontologia e Enfermagem. Universidade Federal do Ceará. Fortaleza, CE, Brasil
ABSTRACT
OBJECTIVE: To analyze the prevalence of medicine use by the Brazilian population and its distribution according to sociodemographic factors.
METHODS: Study using data from the Pesquisa Nacional de Acesso, Utilização e Promoção do Uso Racional de Medicamentos (PNAUM – National Survey on Access, Use and Promotion of Rational Use of Medicines), a nationwide household survey of a representative sample of the Brazilian urban population. he data were collected between September 2013 and February 2014. he overall use of medicines, deined as the use of any medicine, use of medicines for treating chronic medical conditions and for acute health conditions, was evaluated. he independent variables included gender, age group, socioeconomic position, and region of Brazil. Analyzes included prevalence calculations, 95% conidence intervals (95%CI) and Pearson Chi-square tests to evaluate the diferences between groups, considering a 5% level of signiicance.
RESULTS: The prevalence of medicines use was 50.7% (95%CI 49.3–52.2), with 39.3% (95%CI 37.5–41.1) accounting for men and 61.0% (95%CI 59.3–62.6) for women. Medicines use was observed to increase with increasing age, except among children within the zero to four years age group. he lowest prevalence for medicines use was found among those with a low socioeconomic position and those who reside in the North region of Brazil. he prevalence of medicine use to treat chronic diseases was 24.3% (95%CI 23.3–25.4), whereas it was 33.7% (95%CI 32.1–35.4) for treating acute diseases.
CONCLUSIONS: We found extensive variability in the prevalence of medicines use across regions of Brazil. he poorest regions (North, Northeast, and Midwest) have a lower prevalence of medicines use to treat chronic diseases, indicating the need to minimize inequalities in access to medicines within the country.
DESCRIPTORS: Drug Utilization. Socioeconomic Factors. Health Inequalities. Health Surveys. Correspondence:
Andréa Dâmaso Bertoldi Programa de Pós-Graduação em Epidemiologia
Universidade Federal de Pelotas Rua Marechal Deodoro, 1160 3º piso
96020-220 Pelotas, RS, Brasil E-mail: andreadamaso.epi@ gmail.com
Received: 14 Jan 2015
Approved: 6 July 2016
How to cite: Bertoldi AD, da Silva Dal Pizzol T, Ramos LR, Mengue SS, Luiza VL, Tavares NUL, et al. Sociodemographic profile of medicines users in Brazil: results from the 2014 PNAUM survey. Rev Saude Publica. 2016;50(suppl 2):5s.
Copyright: This is an open-access article distributed under the terms of the Creative Commons Attribution License, which permits unrestricted use, distribution, and reproduction in any medium, provided that the original author and source are credited.
INTRODUCTION
he last century has seen medicines become highly relevant social assets to humanity as a whole, with them contributing towards improved quality of life and increased life expectancy for people2. It is reasonable to consider medicines as an indispensable resource for most therapeutic plans16.
here are important diferences in determining the proile of medicine use when evaluating samples from institutions (hospitals, primary healthcare units, schools), samples from sick individuals and population-based samples5. Population-based samples can provide a true picture of the population medicine use proile; this scenario contributes to estimate the need for medicines as health resources, which is essential information for directing public policy and new research in the area3,5,25.
here have been international studies to evaluate medicines use that showed the overall prevalence of use (any medicine) ranging from 49.6% (Cuba) to 74.7% (Germany). he prevalence of medicine use in two Spanish communities were found to be 65.1% and 67.0%, respectively, utilization being higher among women and increasing in frequency along with age9,22.
In Brazil, studies on medicine utilization found wide variations in prevalence, with values raging between 49.0% and 56.9%. hese results were identiied respectively by Carvalho et al.10, among individuals aged 18 years or more, and by a study developed by the Conselho
Nacional de Secretários de Saúde (Brazilian National Council of Health Secretaries)11, among individuals aged 16 years or more. he latter study found that the prevalence of use in diferent geographic regions in Brazil was highest in the South (62.3%) and Southeast (62.2%), followed by the Midwest (50.5%), Northeast (50.2%) and North regions (43.1%).
Other studies carried out in Brazilian cities and the Federal District, using diferent recall periods and age groups, showed a high variability in the prevalence of medicines use by the populations under investigation (35.7% to 76.5%). In Brasilia (FD), the prevalence was 35.7%14, in Florianopolis (SC), 76.5%8, in Campinas (SP), 48.5%12, in Fortaleza (CE), 49.7%2, and in Pelotas (RS), 65.9%4. Medicines use was higher among women and increases according to age and socioeconomic status during the studies conducted in Campinas, Fortaleza and Pelotas2,4,12. In-depth health surveys have not yet been conducted in Brazil to evaluate medicines use, due to the fact that the extensive detail the theme requires would absorb much of the research itself. Pesquisa Nacional de Acesso, Utilização e Promoção do Uso Racional de Medicamentos
(PNAUM – National Survey on Access, Use and Promotion of Rational Use of Medicines) was speciically designed to investigate the use of medicines in a representative sample of the Brazilian population.
he purpose of this study was to analyze the prevalence of medicines use in Brazilian geographical regions, considering the use of any medicine and those used speciically for acute or chronic diseases, according to sociodemographic characteristics of the population.
METHODS
he PNAUM was a population-based cross-sectional study, with the data being collected between September 2013 and February 2014 in households in Brazilian cities. Face-to-face interviews were conducted in these households, and the data were recorded using tablets and software that had been speciically developed for applying questionnaires.
38,400 interviews. he sample was selected based on three stages: municipality (primary unit), census sector and household. Participants were selected from households, based on the expected proportion of each age group and gender to compose the inal sample. he sampling process was complex and resulted in a sample that ensured national representation for the ive Brazilian regions stratiied by sex and age groups. Details regarding the sampling and data collection logistics are described in the PNAUM methodological article18.
he questionnaires were developed by researchers from seven universities in Brazil, having been standardized and tested previous to their implementation.
Medicine use was investigated based on three perspectives. The first sought to find information regarding the current use of medicines for chronic diseases. his involved information on previous diagnosis and medical recommendation to use medicines to treat speciic chronic diseases (hypertension, diabetes, heart disease, high cholesterol, a history of stroke, chronic respiratory diseases, arthritis, arthrosis or rheumatism, and depression). Other chronic diseases lasting more than six months were also investigated.
he second perspective aimed to evaluate medicines use for any possible health problems, generally characterized by signs, symptoms and acute conditions treated with medicines. Investigating these cases involved inquiring into medicines use 15 days prior to the research for speciic health issues or groups of medicines (infection, sleeping medicines, nerves, stomach or bowel problems, pain, fever, lu, colds or allergic rhinitis, vitamin, mineral supplement, appetite stimulant or tonic) and any other medicines that had been unreported.
he third perspective separately investigated current contraceptive use, depending on the characteristics of this group of medicines that is unrelated to disease and has everything to do with contraception. he complete questionnaire can be seen on the PNAUM survey website (http://www.ufrgs.br/pnaum).
he analyzed outcomes were as follows: 1) overall prevalence of medicines use (use of at least one medicine for chronic disease, eventual or contraceptive use); 2) prevalence of medicines use for chronic diseases (use of at least one medicine for chronic diseases); 3) prevalence of medicines use for eventual or acute diseases (use of at least one medicine to treat acute signs, symptoms or conditions).
he independent variables under analysis were: age group (0-4; 5-9; 10-19; 20-29 30-39; 40;-49; 50-59 60-69; 70;-79; 80 years old or more); economic classiication (A/B; C; D; E), according to the Brazilian Economic Classiication Criterion of the Associação Brasileira de Empresas de Pesquisa (CCEB 2013/ABEP – http://www.abep.org/), and residential geographical region (North; Northeast; Southeast; South, Midwest).
Analyses for this article were performed using the total sample and the sample stratiied by gender. All analyses were conducted with Stata version 12 (StataCorp LP, College Station, Texas, EUA) statistical software, using the set of svy commands designed to analyze complex samples. he analyses guaranteed the required weighting by contemplating the characteristics of the sample design that used diferent sampling fractions and post-stratiication weights to correct the response rate law. he calculated percentages were weighted to adjust the PNAUM sample’s demographic distribution to the Brazil’s population.
In addition to the prevalence estimates, 95% conidence intervals (95%CI) were calculated and the Pearson’s Chi-square test was applied to assess the statistical signiicance of the diferences among the groups, considering a 5% level of signiicance.
he study’s design was submitted and approved by the Comissão Nacional de Ética em Pesquisa
RESULTS
he study sample included 41,433 individuals with a distribution that was comparable with that from the 2010 Brazilian Population Census (percentages weighted by sampling weights). he response rates from households were around 50.0%, which includes the losses from the households that were not visited. he response rates from the individuals were around 90.0%. he methodological article includes a detailed table of the response rates by gender and age group as well as by geographical region18.
he weighted estimates indicated that 52.8% of the respondents were female, 22.3% of whom belonged to economic classes A or B, 57.1% were adults aged between 20 and 59 years, and with 45.9% residing in the Southeast region of Brazil (Table 1).
The overall prevalence of medicines use was 50.7% (95%CI 49.3–52.2), with 39.3% (95%CI 37.5–41.1) being males and 61.0% (95%CI 59.3–62.6) females. After the sample was stratiied by age groups, there was an observed increase in the prevalence of use along with increasing age, the exception being the irst age group (zero to four years), which is about 70.0% higher than the following group ( ive to nine years). he largest use of medicines by females begins from the 10-19 years age group (Table 1). Figure 1 shows the extent of the diferences for each age group. Women use more than twice as many medicines as men between the ages of 20 and 29.
he smallest prevalence of use was in the group with the smallest economic classiication (class E) in both gender groups. he groups with the highest purchasing power used about 20.0% more medicines than those with the lowest economic classiication (Table 1).
Table 1. Distribution of the sample and prevalencea of medicines usein Brazil, according to sociodemographic characteristics. PNAUM,
Brazil, 2014. (N = 41,433)
Sociodemographic characteristic Sample
Prevalence of medicines use
All Male Female
% Prevalence 95%CI Prevalence 95%CI Prevalence 95%CI
Age groupb < 0.001c < 0.001 < 0.001
0-4 6.2 42.0 39.5–44.6 42.6 39.5–45.7 41.4 38.6–44.3
5-9 7.5 25.3 22.0–28.6 26.7 21.6–31.8 23.9 19.4–28.5
10-19 16.0 30.6 27.9–33.3 24.5 20.7–28.2 36.5 32.7–40.4
20-29 16.5 48.0 45.4–50.6 31.4 26.8–35.9 64.4 62.0–66.8
30-39 15.3 50.6 47.9–53.2 34.8 30.3–39.3 64.5 61.8–67.3
40-49 13.8 54.1 52.0–56.2 39.0 36.6–41.4 67.5 65.3–69.7
50-59 11.5 64.7 62.5–66.8 50.3 47.0–53.5 76.1 74.0–78.2
60-69 6.9 77.0 75.3–78.7 68.3 65.7–70.9 83.8 81.9–85.6
70-79 4.3 85.8 84.0–87.5 79.8 76.1–83.4 89.9 88.2–91.6
≥ 80 2.0 88.6 86.1–91.1 85.2 81.6–88.9 90.9 87.6–94.2
Economic classificationd 0.027 0.423 0.015
A/B 22.3 51.9 49.2–54.5 40.7 37.0–44.4 62.5 59.9–65.1
C 55.3 51.1 49.4–52.8 39.2 37.2–41.2 61.5 59.5–63.5
D 17.7 50.1 47.5–52.8 39.1 35.7–42.6 59.2 56.2–62.2
E 4.6 43.5 38.2–48.8 34.6 27.6–41.6 53.2 47.0–59.3
Region 0.001 0.057 < 0.001
North 7.5 42.4 38.0–46.7 35.7 31.7–39.6 48.6 43.1–54.1
Northeast 24.3 53.4 51.2–55.7 42.7 39.7–45.6 62.6 60.1–65.0
Southeast 45.9 50.8 48.1–53.5 39.1 35.7–42.4 61.3 58.3–64.3
South 14.3 49.8 46.8–52.9 36.5 32.9–40.1 61.8 59.0–64.6
Midwest 7.9 51.8 49.2–54.4 39.5 36.2–42.7 63.9 60.7–67.0
Total 100 50.7 49.3–52.2 39.3 37.5–41.1 61.0 59.3–62.6
a Percentages adjusted by sample weights and post-stratification according to age and gender. Weighted sample distribution by gender: 47.2% (male) and 52.8% (female).
b In years.
c Pearson’s Chi-square test.
he geographical region which had highest prevalence of medicines use was the Northeast (male) and their prevalence was statistically higher than those observed in the North. he lowest prevalence occurred in the North region and was statistically lower than those observed in the other regions in the female gender (Table 1).
Table 2 shows the results related to the treatment of chronic diseases. he prevalence of medicines use for chronic diseases was 24.3% (95%CI 23.3–25.4): 18.7% (95%CI 17.6–19.9) for males and 29.4% (95%CI 28.1–30.7) for females. Considering the total sample, the prevalence increased with age – the oldest age group (80 years or more) used 14 times more medicines than the youngest age group (0-4 years). he prevalence increased from the 20 to 29 years age group among males, while the growth begins in the 10 to 19 years age group among females.
Table 2. Prevalencea of medicines useto treat chronic diseases in Brazil, according to sociodemographic characteristics. PNAUM, Brazil,
2014. (N = 41,433)
Sociodemographic characteristic
Prevalence of medicines use to treat chronic diseases
All Male Female
Prevalence 95%CI Prevalence 95%CI Prevalence 95%CI
Age groupb < 0.001c < 0.001 < 0.001
0-4 5.7 4.8–6.5 6.4 5.2–7.5 5.0 3.8–6.1
5-9 5.2 3.6–6.8 6.0 3.4–8.5 4.5 2.3–6.6
10-19 5.3 4.1–6.5 4.9 3.2–6.5 5.7 4.0–7.4
20-29 7.5 6.1–8.9 5.8 3.7–7.9 9.2 7.5–10.8
30-39 14.9 13.2–16.5 11.2 8.5–13.9 18.1 16.2–19.9
40-49 28.9 27.4–30.4 20.5 18.7–22.4 36.4 34.3–38.5
50-59 49.9 48.0–51.8 36.4 33.7–39.1 60.5 58.0–63.0
60-69 66.2 64.2–68.1 56.7 53.7–59.7 73.5 71.3–75.7
70-79 78.5 76.4–80.6 71.6 67.8–75.5 83.2 81.1–85.4
≥ 80 79.7 75.6–83.8 73.4 70.7–80.0 82.7 76.7–88.6
Economic classificationd 0.011 0.033 0.038
A/B 26.5 24.6–28.4 21.0 18.6–23.4 31.8 29.6–34.1
C 24.2 23.0–25.4 18.6 17.2–20.0 29.1 27.6–30.6
D 22.4 20.6–24.3 16.4 14.4–18.4 27.4 24.9–29.9
E 23.1 19.6–26.6 18.2 13.7–22.6 28.5 23.8–33.3
Region < 0.001 < 0.001 < 0.001
North 14.0 12.2–15.7 11.6 9.7–13.5 16.1 14.0–18.3
Northeast 20.5 18.9–22.1 15.4 13.6–17.1 24.8 22.7–27.0
Southeast 27.5 25.7–29.4 21.4 19.3–23.5 33.0 30.8–35.3
South 26.7 24.5–28.9 19.9 17.6–22.3 32.8 30.4–35.3
Midwest 23.2 21.4–25.1 18.0 15.8–20.2 28.4 26.4–30.3
Total 24.3 23.3–25.4 18.7 17.6–19.9 29.4 28.1–30.7
a Percentages adjusted by sample weights and post-stratification according to age and gender. b In years.
c Pearson’s Chi-square test.
d The economic classification variable according to the Brazilian Economic Classification Criterion of the Associação Brasileira de Empresas de Pesquisa (http://www.abep.org) had 77 ‘missing’.
Men Women
-3.0
-10.0
+49.0
+105.0 +85.0 +73.0
-3.0 +23.0
+13.0 +7.0 100
80.0
60.0
40.0
20.0
0
0-4 5-9 10-19 20-29 30-39 40-49 50-59 60-69 70-79 ≥ 80 Age (years)
Ov
er
all medicines use (%)
In regards to economic classification, the highest prevalence for medicines use was found in groups with the highest economic classification (A/B), and differences in which were statistically significant in relation to economic classification D in males. The prevalence of medicines use for treating chronic diseases was slightly higher in class E (poorest group) compared with class D (no statistical differences). The highest prevalence of medicines use for chronic diseases were found in the Southeast and South, with the entire sample showing significant statistical differences compared with the North and Northeast regions (Table 2).
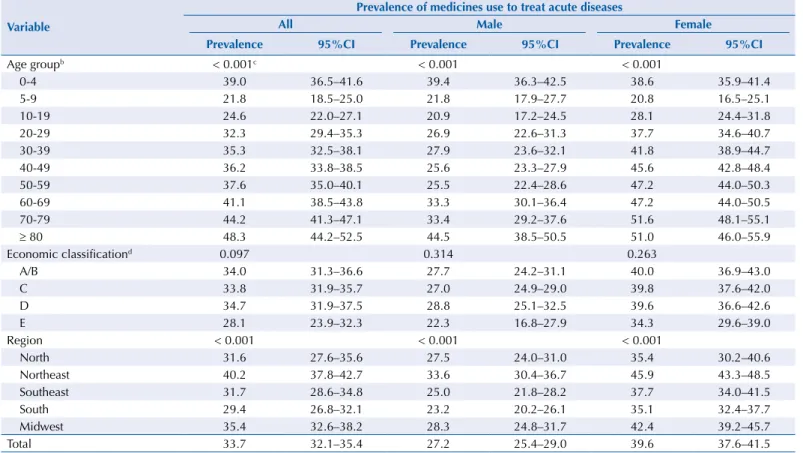
Table 3 only shows the medicines used to treat acute health problems, which characterize eventual use of medicines. he prevalence of medicines use for these health problems was 33.7% (95%CI 32.1–35.4): 27.2% (95%CI 25.4–29.0) for males and 39.6% (95%CI 37.6–41.5) for females. he usage patterns for the total sample indicate an increasing trend from the ive to nine years age group up to the 80 years or more age group. In the zero to four years age group, the prevalence of use of eventual medicines was the same as the adults above 30 years age group. he oldest age group (80 years or more) in males used two times more eventual medicines than the children in the ive to nine years age group; this ratio was 2.5 times higher in females using the same comparison basis. here were no diferences found in the use of such medicines by economic classiication, despite their prevalence being approximately 20.0% higher in class A/B compared with class E (Table 3).
In regards to the geographical regions, the highest prevalence of medicines use was in the Northeast (with a statistically signiicant diference compared with the North, East and South) and the lowest in the South (with a statistically signiicant diference compared with the Northeast and Midwest regions) (Table 3).
Table 3. Prevalencea of medicines useto treat acute diseases in Brazil, according to sociodemographic characteristics. PNAUM, Brazil,
2014. (N = 41,433)
Variable
Prevalence of medicines use to treat acute diseases
All Male Female
Prevalence 95%CI Prevalence 95%CI Prevalence 95%CI
Age groupb < 0.001c < 0.001 < 0.001
0-4 39.0 36.5–41.6 39.4 36.3–42.5 38.6 35.9–41.4
5-9 21.8 18.5–25.0 21.8 17.9–27.7 20.8 16.5–25.1
10-19 24.6 22.0–27.1 20.9 17.2–24.5 28.1 24.4–31.8
20-29 32.3 29.4–35.3 26.9 22.6–31.3 37.7 34.6–40.7
30-39 35.3 32.5–38.1 27.9 23.6–32.1 41.8 38.9–44.7
40-49 36.2 33.8–38.5 25.6 23.3–27.9 45.6 42.8–48.4
50-59 37.6 35.0–40.1 25.5 22.4–28.6 47.2 44.0–50.3
60-69 41.1 38.5–43.8 33.3 30.1–36.4 47.2 44.0–50.5
70-79 44.2 41.3–47.1 33.4 29.2–37.6 51.6 48.1–55.1
≥ 80 48.3 44.2–52.5 44.5 38.5–50.5 51.0 46.0–55.9
Economic classificationd 0.097 0.314 0.263
A/B 34.0 31.3–36.6 27.7 24.2–31.1 40.0 36.9–43.0
C 33.8 31.9–35.7 27.0 24.9–29.0 39.8 37.6–42.0
D 34.7 31.9–37.5 28.8 25.1–32.5 39.6 36.6–42.6
E 28.1 23.9–32.3 22.3 16.8–27.9 34.3 29.6–39.0
Region < 0.001 < 0.001 < 0.001
North 31.6 27.6–35.6 27.5 24.0–31.0 35.4 30.2–40.6
Northeast 40.2 37.8–42.7 33.6 30.4–36.7 45.9 43.3–48.5
Southeast 31.7 28.6–34.8 25.0 21.8–28.2 37.7 34.0–41.5
South 29.4 26.8–32.1 23.2 20.2–26.1 35.1 32.4–37.7
Midwest 35.4 32.6–38.2 28.3 24.8–31.7 42.4 39.2–45.7
Total 33.7 32.1–35.4 27.2 25.4–29.0 39.6 37.6–41.5
a Percentages adjusted by sample weights and post-stratification according to age and gender. b In years.
c Pearson’s Chi-square test.
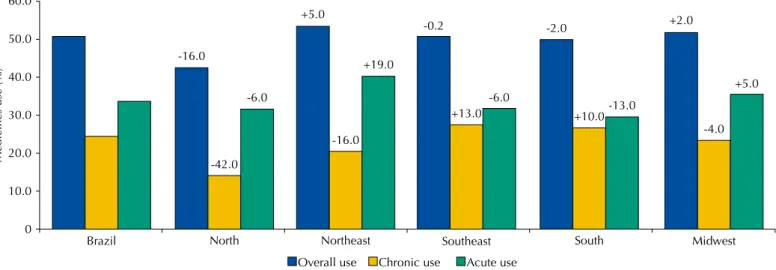
Figure 2 shows a comparison between the prevalence of overall usage, use of medicines for chronic diseases and use of medicines for acute conditions of each region in relation to Brazil as a whole. he North region had the most signiicant percentage diferences in regards to overall use (-16.0%) and medicines for chronic diseases (-42.0%), these being smaller than the prevalence for such in Brazil. he Northeast region had the highest percentage for eventual medicines use (+19.0%), being greater than the national prevalence.
DISCUSSION
Studies on medicines use can be conducted using routine or survey databases. Developed countries usually integrate data on medicines prescription and distribution, which generates databases that include information regarding the patient, medicines recommendation, dosage etc23. In Brazil, we have only consolidated data from industry based on retail sales. hus, surveys are conducted with the objective of obtaining data about who used medicines, what was used and whether or not it was possible to get the necessary medicines.
he PNAUM survey was the irst national study in Brazil that was speciically designed to evaluate medicines use in the ive geographic regions of Brazil, which resulted in detailed information on all medicines used to treat chronic diseases, acute health situations and contraceptives. Among the Brazilian studies that included questions regarding medicines, the following are highlighted: the Pesquisa Nacional por Amostra de Domicílios
(PNAD – National Household Sample Survey – http://www.ibge.gov.br), which records the continuous medicines use related to the last time the health services were used; the Pesquisa de Orçamentos Familiares (POF – Brazilian Household Budget Survey – http://www.ibge.gov. br) that records expenditure on medicines obtained over the last 30 days, purchase location and payment type; Pesquisa Nacional de Demograia e Saúde (PNDS – Brazilian National Demographic and Health Survey – http://www.ibge.gov.br); and the World Health Survey (WHS)24. he latter two used a similar strategy, in which they ask about prescription, use, sources to obtain medicines, primarily based on a list of chronic diseases.
Considering the overall prevalence of any type of medicines, slightly more than half the population used some kind of medicines within the periods investigated during the research, the results showing that use by women was 55.0% greater than that of men. he overall prevalence estimate is in line with other studies, which is true even when those with a smaller sample size are considered2,4,10,12,14. he greater use of medicines by women is also described in various national and international studies20. his diference is attributed to gender, in addition to the exclusive use of contraceptives, to factors related to increased use of health services and health
60.0
50.0
40.0
30.0
20.0
0
Medicines use (%)
10.0
Brazil North Northeast Southeast South Midwest
-16.0
-6.0
+5.0
+19.0 -0.2
-6.0
-2.0
-13.0
+2.0
+5.0
Overall use Chronic use Acute use -42.0
-16.0
+10.0
-4.0 +13.0
care21, which begin during adolescence, due to complications related to the menstrual cycle and pregnancy. his is a period in which the diferences start and continue to grow until the end of adulthood. Among the elderly, women are still the greatest medicines users, but the diferences are smaller, a fact that is consistent with the literature13,20.
Medicines use by age group relects the population’s proile of morbidities, starting with a high percentage for the use of eventual medicines in early childhood followed by a reduction and subsequent gradual increase along with increasing age, and with the percentage of medicines use to treat chronic diseases. he prevalence of medicines use is close to 90.0% in the 80 years or more age group. his result is in line with those from other studies, which indicate the same trend4 and show the impact of demographic and epidemiological transition in the use of medicines by the Brazilian population. In light of this scenario, eforts in terms of pharmaceutical service policy should be directed towards care strategies to guide these patients within the health care system, the aim being to guarantee access to essential medicines, to promote their rational use and to improve adherence to treatment. his study showed a higher medicines use by people belonging to the highest economic classiication (A/B). Data from the literature consistently indicate this same result2,4,10,12, since medicines use depends on their access and this can be conditioned by the purchasing power of individuals when drugs are not available free of charge7.
We found a wide variability in the overall prevalence of medicines use in the diferent regions in Brazil. he lowest prevalence of medicines use is found in the North region, which is probably due to greater dependence and ineiciency of the public system regarding access to medicines, less medical diagnoses as a result of diiculties in accessing medical services, and even because of there likely being fewer locations to obtain medicines in the private sector than in the other Brazilian regions1. hese variations are even sharper when the medicines are stratiied by disease groups. According to the Brazilian Institute of Geography and Statistics (IBGE), the poorest regions (North, Northeast and Midwest) have the lowest prevalence of medicines use for chronic diseases compared with Brazil as a whole. On the other hand, the South and Southeast regions have the greatest prevalence of medicines use for these diseases. Being able to use medicines to treat chronic diseases can be considered a proxy of quality health care, since these diseases depend on a previous diagnosis for its control and evolution with the use of medicines17. At the same time, the Northeast and Midwest regions have the largest percentages of medicines use for eventual or acute diseases, which may be associated with self-medication and the pursuit of resolving acute health problems caused by medicines use6.
When we only consider treating chronic illnesses, the prevalence of medicines use is observed to be less than 10.0% up until 29 years of age, regardless of gender. From 30 years of age onwards, we found an increase in medicines use for these diseases. When we consider the entire population, the oldest age group (80 years or more) uses 5.3 times more medicines than the 30-39 years age group. When we only consider the male gender, this increase is 6.6 times, and only 4.6 times for women. his behavior based on age has already been covered in the literature19.
In relation to the treatment of acute diseases, the prevalence is high from childhood onwards, which is true for both boys and girls. he increases in the prevalence for males are 1.95 times greater in the 80 years or more age group compared with the ive to nine years age group. his increase is 2.5 times higher for the female gender, indicating a greater stability in the use prevalence of these medicines compared with those used to treat chronic diseases.
It is possible to highlight the national and regional representation as a strong point of this study, which has allowed an overview of the overall use of medicines in Brazil to be created for the irst time. Comparisons made by gender, age and economic class showed similar results regarding medicines use between the PNAUM survey and previous studies, and also built upon the diferential characteristics observed in the patterns for medicines use for chronic and acute diseases in Brazil’s geographical regions.
guardians, in the case of individuals aged less than 18 years old or persons unable to answer their own questionnaires, it is possible the existence of some degree of response error regarding which medicines were used. he periods adopted to investigate medicines use should also be considered. Current use was investigated for continuous use of medicines and contraceptives, and a 15-day recall period was used for medicines used to treat eventual health issues. Despite this procedure not being unusual in the literature5, comparisons with other studies should always consider that the prevalence may vary according to the investigation period for medicines use5.
Evaluating the Brazilian population’s proile for medicines use by age groups, gender and medicines type ( for acute diseases or chronic diseases) made it possible to characterize the diferences between the groups and tendencies among the geographic regions of Brazil. he Brazilian Government has invested in strategies to improve access to medicines and enhance the quality of pharmaceutical services with initiatives such as regulating generic medicines (Law 9,787, February 10th, 1999), the Brazilian Farmácia Popular (Popular Pharmacy Program) (Decree 5,090, May 20th, 2004), the QualifarSUS (Ordinance GM/MS 1,214), among
others. We hope that the results from this study can help guide the Brazilian government in regards to pharmaceutical services, the aim being to further improve the population’s access to essential medicines and ensure their rational use. he areas that were identiied to have a lesser prevalence of medicines use to treat chronic diseases, such as the North and Northeast regions, should be prioritized to minimize the inequalities in terms of access to medicines.
REFERENCES
1. Andrade MV, Noronha KVMS, Menezes RM, Souza MN, Reis CB, Martins DR et al. Desigualdade socioeconômica no acesso aos serviços de saúde no Brasil: um estudo comparativo entre as regiões brasileiras em 1998 e 2008. Econ Apl. 2013;17(4):623-45. DOI: 10.1590/S1413-80502013000400005
2. Arrais PS, Brito LL, Barreto ML, Coelho HL. Prevalência e fatores determinantes do consumo de medicamentos no Município de Fortaleza, Ceará, Brasil. Cad Saude Publica. 2005;21(6):1737-46. DOI:10.1590/S0102-311X2005000600021
3. Barros MBA. Inquéritos domiciliares de saúde: potencialidades e desafios. Rev Bras Epidemiol. 2008;11 Supl 1:6-19. DOI:10.1590/S1415-790X2008000500002
4. Bertoldi AD, Barros AJ, Hallal PC, Lima RC. Utilização de medicamentos em adultos: prevalência e determinantes individuais. Rev Saude Publica. 2004;38(2):228-38. DOI:10.1590/S0034-89102004000200012
5. Bertoldi AD, Barros AJ, Wagner A, Ross-Degnan D, Hallal PC. A descriptive review of the methodologies used in household surveys on medicine utilization. BMC Health Serv Res. 2008;8(1):222. DOI:10.1186/1472-6963-8-222
6. Bertoldi AD, Camargo AL, Silveira MP, Menezes AM, Assunção MC, Gonçalves H et al. Self-medication among adolescents aged 18 years: the 1993 Pelotas (Brazil) birth cohort study.
J Adolesc Health. 2014;55(2):175-81. DOI:10.1016/j.jadohealth.2014.02.010
7. Bertoldi AD, de Barros AJ, Wagner A, Ross-Degnan D, Hallal PC. Medicine access and utilization in a population covered by primary health care in Brazil. Health Policy. 2009;89(3):295-302. DOI:10.1016/j.healthpol.2008.07.001
8. Boing AC, Bertoldi AD, Peres KG. Socioeconomic inequalities in expenditures and income committed to the purchase of medicines in Southern Brazil. Rev Saude Publica. 2011;45(5):897-905. DOI:10.1590/S0034-89102011005000054
9. Carrera-Lasfuentes P, Aguilar-Palacio I, Clemente Roldán E, Malo Fumanal S, Rabanaque Hernandez MJ. Consumo de medicamentos en población adulta: influencia del autoconsumo.
Aten Primaria. 2013;45(10):528-35. DOI:10.1016/j.aprim.2013.05.006
10. Carvalho MF, Pascom AR, Souza-Júnior PR, Damacena GN, Szwarcwald CL. Utilization of medicines by the Brazilian population, 2003. Cad Saude Publica. 2005;21 Suppl:100-8. DOI:10.1590/S0102-311X2005000700011
12. Costa KS, Barros MB, Francisco PM, César CL, Goldbaum M, Carandina L. Utilização de medicamentos e fatores associados: um estudo de base populacional no Município de Campinas, São Paulo, Brasil. Cad Saude Publica. 2011;27(4):649-58. DOI:10.1590/S0102-311X2011000400004
13. Francisco PM, Bastos TF, Costa KS, Prado MA, Barros MB. The use of medication and associated factors among adults living in Campinas, São Paulo, Brazil: differences between men and women. Cienc Saude Colet. 2014;19(12):4909-21. DOI:10.1590/1413-812320141912.18702013
14. Galvao TF, Silva MT, Gross R, Pereira MG. Medication use in adults living in Brasilia, Brazil: a cross-sectional, population-based study. Pharmacoepidemiol Drug Saf. 2014;23(5):507-14. DOI:10.1002/pds.3583
15. Knopf H, Grams D. [Medication use of adults in Germany: results of the German Health Interview and Examination Survey for Adults (DEGS1)]. Bundesgesundheitsblatt
Gesundheitsforschung Gesundheitsschutz. 2013;56(5-6):868-77. German.
DOI:10.1007/s00103-013-1667-8
16. Leite SN, Vieira M, Vebber AP. Estudos de utilização de medicamentos: uma síntese de artigos publicados no Brasil e América Latina. Cienc Saude Colet. 2008;13 Suppl:793-802. DOI:10.1590/S1413-81232008000700029
17. Mendes LV, Emmerick IC, Luiza VL. Uso de medicamentos entre portadores de doenças crônicas: um estudo observacional no estado do Espírito Santo. Rev Bras Farm. 2014;95(2):732-47.
18. Mengue SS, Bertoldi AD, Boing AC, NUL Tavares, da Silva Dal Pizzol T, Oliveira MA, et al. Pesquisa Nacional sobre Acesso, Utilização e Promoção do Uso Racional de Medicamentos (PNAUM): métodos do inquérito domiciliar. Rev Saude Publica. 2016;50(supl 2):4s. DOI:10.1590/S1518-8787.2016050006156
19. Milián AJG, Carbonell LA, Puig PL, Alós IY, Salvador AKR, Hernández NB. Consumo de medicamentos referidos por la población adulta de Cuba, año 2007. Rev Cubana Med Gen
Integr. 2009;25(4):5-16.
20. Morgan TK, Williamson M, Pirotta M, Stewart K, Myers SP, Barnes J. A national census of medicines use: a 24-hour snapshot of Australians aged 50 years and older. Med J Aust. 2012;196(1):50-3. DOI:10.5694/mja11.10698
21. Obermeyer CM, Price K, Schulein M, Sievert LL, Anderton DL. Medication use and gender in Massachusetts: results of a household survey. Health Care Women Int. 2007;28(7):593-613. DOI:10.1080/07399330701334646
22. Sans S, Paluzie G, Puig T, Balañá L, Balaguer-Vintró I. Prevalencia del consumo de medicamentos en la población adulta de Cataluña. Gac Sanit. 2002;16(2):121-30. DOI:10.1016/S0213-9111(02)71643-9
23. Strom BL, Kimmel SE, Hennessy S, editors. Pharmacoepidemiology. 5th ed. Hoboken: Wiley-Blackwell; 2012.
24. Szwarcwald C, Viacava F. Pesquisa Mundial de Saúde: aspectos metodológicos e articulação com a Organização Mundial da Saúde. Rev Bras Epidemiol. 2008;11 Supl 1:58-66.
DOI:10.1590/S1415-790X2008000500006
25. Szwarcwald CL, Malta DC, Pereira CA, Vieira ML, Conde WL, Souza Júnior PR, et al. Pesquisa Nacional de Saúde no Brasil: concepção e metodologia de aplicação. Cienc Saude Colet. 2014;19(2):333-42. DOI:10.1590/1413-81232014192.14072012
Funding: Department of Pharmaceutical Services and Strategic Health Supplies (DAF) and Department of Science and Technology (DECIT) of the Secretariat of Science, Technology and Strategic Inputs from the Ministry of Health (SCTIE/MS – Process 25000,111834/2, Decentralization of FNS resources).
Author’s Contribution: he following authors contributed in terms of the study’s design, analysis and interpretation of the results and critical review of the intellectual content: ADB, TSDP and PSDA. All authors participated in the writing, approved the inal version of the manuscript and declared themselves responsible for all aspects of
the study, thereby ensuring its accuracy and comprehensiveness
Acknowledgements: he Ministry of Health, for funding and technical support for implementing the Pesquisa Nacional sobre Acesso, Utilização e Promoção do Uso Racional de Medicamentos (PNAUM – National Survey on Access, Use and Promotion of Rational Use of Medicines) and, in particular, the team that worked to collect the
data, here represented by Prof. Dr. Alexandra Crispim Boing and the statistical support team for the project, Amanda Ramalho Silva, Andréia Turmina Fontanella and Luciano S. P. Guimarães.