Objective: To evaluate the prevalence, and identify factors associated with rapid weight gain in preschool children.
Methods: A cross sectional study was carried out with 136 children between 24 and 35 months of age attending public daycare centers in Mogi das Cruzes between February and December 2014. Interviews were conducted with the mothers for clinical, sociodemographic and anthropometric characterizations of the children. It was considered to be rapid weight gain when the children presented a difference greater than 0.67 between the weight for age Z score from birth to evaluation. A logistic regression model was adjusted for factors associated with rapid weight gain.
Results: Fifty children (36.8%) presented rapid weight gain and 36 (26.5%) were overweight. Of these, 22 children were in the rapid weight gain group. The logistic model showed that longest total breastfeeding time (OR 0.94, 95%CI 0.88–0.99; p=0.031) was a protection factor, and low socioeconomic level (OR 4.18, 95%CI 1.04–18.60; p=0.044) was a risk factor for rapid weight gain.
Conclusions: There was a high prevalence of rapid weight gain and being overweight among three year old preschoolers attending public day care centers in Brazil. Encouraging the practice of breastfeeding children in the first years of life, in addition to giving guidance about appropriate foods, especially for families with a low socioeconomic status, can potentially contribute to reduce rapid weight gain and, consequently, future metabolic complications of being overweight.
Keywords: Child daycare centers; Child nutrition; Weight gain; Obesity.
Objetivo: Avaliar a prevalência e identificar os fatores associados ao ganho de peso rápido em pré‑escolares.
Métodos: Estudo transversal realizado entre fevereiro e dezembro de 2014, com 136 crianças entre 24 e 35 meses de idade frequentadoras de creches públicas do município de Mogi das Cruzes. Foram realizadas entrevistas com as mães para caracterização clínica, sociodemográfica e antropometria das crianças. Considerou‑se ganho de peso rápido quando as crianças apresentaram diferença superior a 0,67 entre o escore Z de peso para idade do nascimento à avaliação. Foi ajustado modelo de regressão logística para fatores associados ao ganho de peso rápido.
Resultados: Do total de crianças avaliadas, 50 (36,8%) apresentaram ganho de peso rápido e 36 (26,5%) excesso de peso. Destas, 22 crianças eram do grupo ganho de peso rápido. O maior tempo total do aleitamento materno (OR 0,94, IC95% 0,88–0,99; p=0,031) foi identificado como fator de proteção e o baixo nível socioeconômico (OR 4,18, IC95% 1,04–18,60; p=0,044), como fator de risco para ganho de peso rápido.
Conclusões: Encontrou‑se alta prevalência de ganho de peso rápido e de excesso de peso entre pré‑escolares no terceiro ano de vida frequentadores de creches públicas. Incentivar a prática do aleitamento materno de crianças nos primeiros anos de vida e orientar a alimentação adequada, principalmente nas famílias de baixo nível socioeconômico, contribui potencialmente para a redução do ganho de peso rápido e, consequentemente, de futuras complicações metabólicas do excesso de peso. Palavras‑chave: Pré‑escolar; Alimentação infantil; Ganho de peso; Obesidade.
ABSTRACT
RESUMO
*Corresponding author. E‑mail: drisn@hotmail.com (A.S.N. Lourenço). aUniversidade Federal de São Paulo, São Paulo, SP, Brazil.
Received on April 27, 2017; Approved on September 1, 2017;available online on September 12, 2018.
FACTORS ASSOCIATED WITH RAPID WEIGHT GAIN IN
PRESCHOOL CHILDREN IN PUBLIC DAY CARE CENTERS
Fatores associados ao ganho de peso rápido
em pré-escolares frequentadores de creches públicas
Adriana de Sousa Nagahashi Lourenço
a,*, Daniela Almeida Neri
a,
INTRODUCTION
A child’s growth after intrauterine life is influenced by several factors, especially maternal nutrition and the nutritional sta‑ tus of his or her first years of life, which may have an effect on metabolism programming,1 thus increasing the risk of
chronic diseases.
Increasing numbers of infants have been enrolled in daycare centers in Brazil,2 because women are increasingly
participating in the labor market, as a way to secure family income.3 This fact contributes to the low rates of Exclusive
Breastfeeding (EB) and to the outsourcing of health care and food. In nurseries, infants receive about 70% of their daily nutritional needs.4 The growth and development of these
children are influenced by the amount of time they attend daycare, the physical facilities, the knowledge and training of their caregivers, the plans for their diet, and the energy they expend on daily activities.5
An individual’s first two years of life, in conjunction with their gestational period, are very important stages. Thus, the first thousand days of life are fundamental for the control and prevention of chronic non‑communicable diseases, like the risk of obesity in the short, medium and long term.6
Rapid weight gain (RWG) has been associated with being overweight in childhood and, consequently, with increased risks for metabolic syndrome and cardiovascular diseases.7
Ong et al. 8,9 defined RWG as an increase greater than 0.67 in
the Z score of the anthropometric indicators of weight‑for‑age or weight‑for‑height, considering that these values are the amplitude between the percentile ranges on growth charts. The advantage of using these indicators in the postnatal phase allows for the early detection of risk and, consequently, the adoption of strategies to control and prevent nutritional dis‑ orders in childhood.9
Considering this context, the present study aimed to evaluate the prevalence, and to identify factors associated with RWG in preschool children attending public day‑ care centers.
METHOD
A cross‑sectional study was carried out between February and December 2014, with children between 24 and 35 months of age, who attend public daycare centers in Mogi das Cruzes, São Paulo, Brazil.
The municipality of Mogi das Cruzes has approximately 430,000 inhabitants,10 with an average per capita income of
R$916.81 and a Municipal Human Development Index (MHDI) of 0.783.11. Children between 0 and 4 years old make up about
4% of the population. This municipality provides 4 daycare
centers: 14 municipal units called Municipal Early Childhood Education Centers (Centro de Educação Infantil Municipal – CEIM) and 28 subsidized ones, which are administered by social entities or Non‑Governmental Organizations (NGOs), with the support of the city hall.
Initially, one daycare center was selected for the pilot study. At this center, the field instruments were tested, in order to correct and adapt the data collection methodology.
Daycare centers were selected starting with schools admin‑ istered exclusively by the city. Of the 14 CEIMs contacted, 13 accepted the proposal of receiving the field team. In order to provide proper representation of children enrolled in daycare centers, the total number of elementary schools in the munic‑ ipality was considered.
The 13 daycare centers selected were classified according to the number of children enrolled. As such, 4 were consid‑ ered to be small (less than 40 children), 7 were intermediate (between 40 and 60 children), and 2 were large (more than 60 children). The sample was selected so that there was at least one daycare center in each group. Since more than half of the daycare centers were intermediate, two daycare centers were selected in this category. Therefore, four daycare cen‑ ters were included in the study: one small, two intermediate and one large. The daycare centers of each group were ran‑ domly selected with the same possibility of inclusion in the study. The sampling was carried out with the probability of selection of 1/4 for small daycares, 2/7 for intermediate and 1/2 for large ones.
In this regard, all 180 children between the ages of 24 and 35 months old who were regularly enrolled in the selected daycare centers were included. Additionally, 9 chil‑ dren that participated in the pilot study were included, totaling 189 children. Of these, 16 were excluded, as the parents or guardians did not authorize their participation in the research. Twenty‑three were excluded due to lack of birth information. And 14 were excluded due to prematu‑ rity, which was considered when the birth occurred after less than 37 weeks of gestation,12 according to information
collected from the child’s health card or, if the card was not available, from the person in charge. Thus, the final sample consisted of 136 children. This number of children (exposed and not exposed 1:1) is sufficient to identify odds ratios of 1.5 (alpha=0.05 and beta=0.20). The sample size was mea‑ sured in the Epi‑Info 2000 Program, version 3.4.3.13
An evaluation of feeding practices in the child’s first year of life included the classification and duration of breastfeed‑ ing, total time of breastfeeding, and the age that adequate solid foods (fruit, potatoes, and family meals) and unhealthy foods (processed foods) were introduced, using a food questionnaire developed for the study. Current consumption was estimated through the application of a food frequency questionnaire.14
The foods classified as processed were defined as unhealthy foods, according to the Food Guide for the Brazilian Population from the Ministry of Health.
The anthropometric measures measured were: height, weight, arm circumference (AC), triceps skinfold (TSF), sub‑ scapular skinfold (SS) and cephalic perimeter (CP), according to guidelines of the Brazilian Society of Pediatrics (Sociedade Brasileira de Pediatria – SBP).16 Height was measured using a
portable Seca® stadiometer, with measurements taken in milli‑
meters. For weight, a Plenna® digital anthropometric scale was
used, with a scale of 0.1 kg and a maximum load of 150 kg. To measure AC and CP, an inelastic tape measure, measuring in millimeters was used. And for TSF and SS, a Lange® brand
adipometer was used. A previously trained researcher performed all of the field procedures, and all of the instruments were cal‑ ibrated to avoid estimate errors.
To diagnosis nutritional status, criteria from the World Health Organization (WHO) from 2006 were used, according to the classification of anthropometric indexes for the weight‑for‑age (ZW/ A), height‑for‑age (ZH/A), weight‑for‑height (ZW/ H) and body mass index for age (Z‑BMI/A) Z scores. A child was considered to overweight when the Z‑W/H score was above +1. The body composition (percentage of lean and fat mass) was evaluated using anthro‑ pometric measurements (AC and TSF / SS). The children were classified as being in the RWG group when the differ‑ ence between the Z‑W / A of the evaluation and the Z‑W/A of the birth was > 0.67.7‑9
To make a socioeconomic classification, an instrument proposed by the Brazilian Association of Research Companies (Associação Brasileira de Empresas de Pesquisa ‑ ABEP),17 was
used, which measures the purchasing power and the level of schooling of the head of the family, in addition to liv‑ ing conditions.
The distribution of variables was assessed using the Shapiro Wilk test. Continuous variables were described using median and interquartile range and categorical variables were described in absolute and percentage distribution. The differences between the means of the continuous variables were evalu‑ ated using Student’s t test or Mann Whitney test, according to the distribution of the variable. The differences between the categorical variables were assessed according to the chi‑square
test. A multiple logistic regression analysis was performed in order to identify the factors associated with RWG and to con‑ trol confounding variables. The criterion used for inclusion in the model was a p‑value≤0.20 in the univariate analysis. A plausible effect of complementary feeding on RWG was controlled in the multiple model, with the use of the vari‑ able “age solid foods were introduced”. The input method of the variables was the stepwise forward method. For all other analyses, p was considered to be significant at a level of less than or equal to 0.05. The quality of fit of the model was verified using the Hosmer Lemeshow test. Statistical analyses were performed using the SAS‑JMP program (Pro 10 Version) (SAS Institute, Cary, NC).
The study was submitted and approved by the Research Ethics Committee of the Paulista School of Medicine of the Universidade Federal de São Paulo (EPM / UNIFESP), under the report number 415.648.
RESULTS
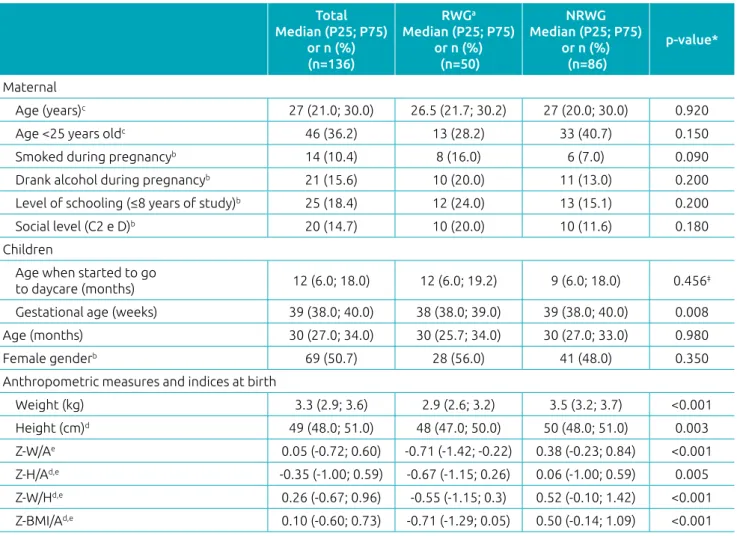
Of the 136 children evaluated, 50 (36.8%) presented RWG from birth until the date of collection. Table 1 shows the mater‑ nal, neonatal and socioeconomic characteristics of the popula‑ tion according to the presence or absence of RWG. The groups were similar in relation to age and gender. However, children with RWG had lower values of gestational age, weight, length and anthropometric indices at birth, when compared to those without RWG.
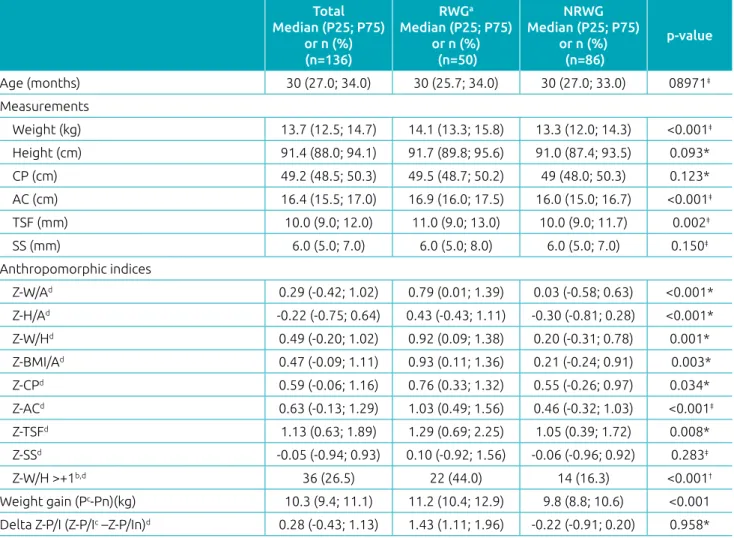
Table 2 shows the anthropometric data at the time of the study according to RWG. Note that children who gained weight quickly had a Z score of the highest anthropometric indexes, including for body composition measurements. The prevalence of overweight children (Z‑W/ H> 1) was 26.5%, with a sta‑ tistically significant difference between RWG and non‑RWG groups (44.0 versus 16.3%, p<0.001). The median weight gain between birth and the time of evaluation for the total popu‑ lation was 10.3 kg, also with difference between groups (11.2 and 9.8 kg, p=0.001).
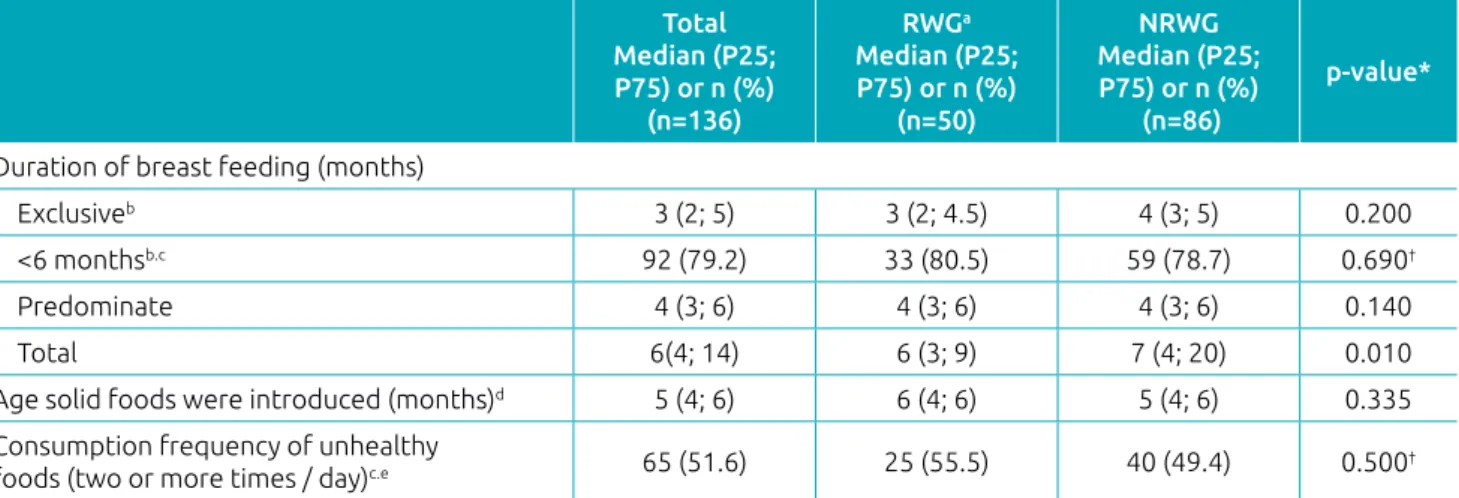
In the evaluation of feeding practices (Table 3), no differ‑ ences were found between the groups in relation to breastfeed‑ ing (exclusive or predominant), the premature introduction of potatoes into the child’s diet, and the frequent consumption of unhealthy foods. However, total breastfeeding time was higher in the non‑RWG group compared to the RWG group (7 months versus 6 months, p = 0.01).
0.88–0.99, p=0.031). In addition, children of lower social classes (socioeconomic levels C2 and D) had a higher risk of RWG (OR 4.18, 95%CI 1.04–1.8.60, p=0.044) than those of higher classes (socioeconomic levels A, B and C1). These risk conditions were identified after adjusting the multiple model for birth weight, height, age, and age solid foods were intro‑ duced. The Hosmer Lemeshow test showed that the model conforms to the data (Goodness of fit: p=0.267).
DISCUSSION
The prevalence of being overweight and RWG was 26.5 and 36.8%, respectively. Gestational age, total breastfeeding time, and anthropometric measures and indices showed statistically significant differences in the bivariate analysis, when the groups with and without RWG were compared. In addition, a short
total amount of breastfeeding time and low socioeconomic levels were associated with a higher risk of RWG, regardless of the age of the child, the age solid foods were introduced, and weight and length at birth.
The children of the RWG group had lower anthropometric measures and indices at birth than those in the RWG group. Conversely, at the time of the study, the RWG group presented higher values of these measures and indices. The RWG indicator is related to Barker’s fetal origin hypothesis, which states that fetal malnutrition and, consequently, inadequate child growth is associated with the development of chronic diseases such as obesity and cardiovascular diseases.18 In addition, rapid growth
in postnatal life, influenced by an obesogenic food environ‑ ment and by interactions between nutrients and the genetic characteristics of individuals, favors the development of these diseases in adult life.6
Table 1 Maternal characteristics and child characteristics (n=136), according to rapid weight gain or no rapid weight
gain in public daycare centers in Mogi das Cruzes, 2014.
Total Median (P25; P75)
or n (%) (n=136)
RWGa
Median (P25; P75) or n (%)
(n=50)
NRWG Median (P25; P75)
or n (%) (n=86)
p‑value*
Maternal
Age (years)c 27 (21.0; 30.0) 26.5 (21.7; 30.2) 27 (20.0; 30.0) 0.920
Age <25 years oldc 46 (36.2) 13 (28.2) 33 (40.7) 0.150
Smoked during pregnancyb 14 (10.4) 8 (16.0) 6 (7.0) 0.090
Drank alcohol during pregnancyb 21 (15.6) 10 (20.0) 11 (13.0) 0.200
Level of schooling (≤8 years of study)b 25 (18.4) 12 (24.0) 13 (15.1) 0.200
Social level (C2 e D)b 20 (14.7) 10 (20.0) 10 (11.6) 0.180
Children
Age when started to go
to daycare (months) 12 (6.0; 18.0) 12 (6.0; 19.2) 9 (6.0; 18.0) 0.456‡
Gestational age (weeks) 39 (38.0; 40.0) 38 (38.0; 39.0) 39 (38.0; 40.0) 0.008
Age (months) 30 (27.0; 34.0) 30 (25.7; 34.0) 30 (27.0; 33.0) 0.980
Female genderb 69 (50.7) 28 (56.0) 41 (48.0) 0.350
Anthropometric measures and indices at birth
Weight (kg) 3.3 (2.9; 3.6) 2.9 (2.6; 3.2) 3.5 (3.2; 3.7) <0.001
Height (cm)d 49 (48.0; 51.0) 48 (47.0; 50.0) 50 (48.0; 51.0) 0.003
Z‑W/Ae 0.05 (‑0.72; 0.60) ‑0.71 (‑1.42; ‑0.22) 0.38 (‑0.23; 0.84) <0.001
Z‑H/Ad,e ‑0.35 (‑1.00; 0.59) ‑0.67 (‑1.15; 0.26) 0.06 (‑1.00; 0.59) 0.005
Z‑W/Hd,e 0.26 (‑0.67; 0.96) ‑0.55 (‑1.15; 0.3) 0.52 (‑0.10; 1.42) <0.001
Z‑BMI/Ad,e 0.10 (‑0.60; 0.73) ‑0.71 (‑1.29; 0.05) 0.50 (‑0.14; 1.09) <0.001
RWG: rapid weight gain; NRWG: no rapid weight gain; P25; first quartile; P75: third quartile; Z‑W/A: weight‑to‑age Z score; Z‑H/A: height‑to‑age Z score; Z‑W/H: weight‑to‑height Z score; Z‑BMI/A: Body Mass Index‑to‑Age Z score; aincrease in weight‑for‑age Z score >0.67 from birth
In this regard, Programming, which consists of the induction, deletion or impairment of the development of a somatic structure or adjustment to a physiological system by a stimulus or aggression in the early stages of life, may lead to impairments of physiological functions and contribute to the disease. Thus, the affected gene expression may result in changes in eating behavior and, consequently, metabolic dys‑ functions in adipose and muscle tissues, in the liver and in pancreatic β cells.6
In the evaluation of feeding practices, 20.7% of the chil‑ dren received EB for up to six months, which was lower than the national prevalence of 39.8% — found in the National Demographic and Health Survey/2006 (Pesquisa Nacional de Demografia e Saúde – PNDS) — and the worldwide prevalence
of 34.8%.19,20 Such a difference may be related to the low
socioeconomic status of the families being studied. In spite of this, the median duration of 3 months of EB demonstrated in this study was higher than that observed in the Brazilian capitals and the Federal District in the national health sur‑ vey conducted in 2009 (1.8 months).21 This contrast can be
explained by the kinds of mothers studied — mothers who need to return to work after their maternity leave period. Additionally, it can be explained by the pre‑requisites estab‑ lished for enrolling children in daycare centers, which allows the mother to be employed.
With regard to the prevalence and the factors associated with RWG, Ong et al..22 found that 30.7% of infants with
RWG had lower birth weight and height values and a higher
Table 2 Anthropometric evaluation of the children (n=136), according to rapid weight gain or no rapid weight gain
in public daycare centers in Mogi das Cruzes, 2014.
Total Median (P25; P75)
or n (%) (n=136)
RWGa
Median (P25; P75) or n (%)
(n=50)
NRWG Median (P25; P75)
or n (%) (n=86)
p‑value
Age (months) 30 (27.0; 34.0) 30 (25.7; 34.0) 30 (27.0; 33.0) 08971‡
Measurements
Weight (kg) 13.7 (12.5; 14.7) 14.1 (13.3; 15.8) 13.3 (12.0; 14.3) <0.001‡
Height (cm) 91.4 (88.0; 94.1) 91.7 (89.8; 95.6) 91.0 (87.4; 93.5) 0.093*
CP (cm) 49.2 (48.5; 50.3) 49.5 (48.7; 50.2) 49 (48.0; 50.3) 0.123*
AC (cm) 16.4 (15.5; 17.0) 16.9 (16.0; 17.5) 16.0 (15.0; 16.7) <0.001‡
TSF (mm) 10.0 (9.0; 12.0) 11.0 (9.0; 13.0) 10.0 (9.0; 11.7) 0.002‡
SS (mm) 6.0 (5.0; 7.0) 6.0 (5.0; 8.0) 6.0 (5.0; 7.0) 0.150‡
Anthropomorphic indices
Z‑W/Ad 0.29 (‑0.42; 1.02) 0.79 (0.01; 1.39) 0.03 (‑0.58; 0.63) <0.001*
Z‑H/Ad ‑0.22 (‑0.75; 0.64) 0.43 (‑0.43; 1.11) ‑0.30 (‑0.81; 0.28) <0.001*
Z‑W/Hd 0.49 (‑0.20; 1.02) 0.92 (0.09; 1.38) 0.20 (‑0.31; 0.78) 0.001*
Z‑BMI/Ad 0.47 (‑0.09; 1.11) 0.93 (0.11; 1.36) 0.21 (‑0.24; 0.91) 0.003*
Z‑CPd 0.59 (‑0.06; 1.16) 0.76 (0.33; 1.32) 0.55 (‑0.26; 0.97) 0.034*
Z‑ACd 0.63 (‑0.13; 1.29) 1.03 (0.49; 1.56) 0.46 (‑0.32; 1.03) <0.001‡
Z‑TSFd 1.13 (0.63; 1.89) 1.29 (0.69; 2.25) 1.05 (0.39; 1.72) 0.008*
Z‑SSd ‑0.05 (‑0.94; 0.93) 0.10 (‑0.92; 1.56) ‑0.06 (‑0.96; 0.92) 0.283‡
Z‑W/H >+1b,d 36 (26.5) 22 (44.0) 14 (16.3) <0.001†
Weight gain (Pc‑Pn)(kg) 10.3 (9.4; 11.1) 11.2 (10.4; 12.9) 9.8 (8.8; 10.6) <0.001
Delta Z‑P/I (Z‑P/Ic –Z‑P/In)d 0.28 (‑0.43; 1.13) 1.43 (1.11; 1.96) ‑0.22 (‑0.91; 0.20) 0.958*
RWG: rapid weight gain; NRWG: no rapid weight gain; P25; first quartile; P75: third quartile; CP: cephalic perimeter; AC: arm circumference; TSF: triceps skinfold; SS: subscapular skinfold; Z‑W / A: weight‑for‑age Z score; Z‑H / A: height‑for‑age Z score; Z‑W / A: weight for height Z score; Z‑BMI / A: body mass index‑for‑age Z score; Z‑CP: cephalic perimeter Z‑score; Z‑AC: arm circumference Z score; Z‑TSF: tricipital skinfold Z score; Z‑SS: subscapular skinfold Z score; W: weight; Wn: birth weight; Z‑W/ In: weight‑for‑age Z score at birth; a increase in
weight‑for‑age Z score > 0.67 from birth to time of the study; bn (%); weight‑for‑age Z score at the time of study; dWHO, 2006; * p‑value
Table 3 Children’s (n=136) dietary practices, according to rapid weight gain or no rapid weight gain, in public
daycare centers of Mogi das Cruzes, 2014.
Total Median (P25; P75) or n (%)
(n=136)
RWGa
Median (P25; P75) or n (%)
(n=50)
NRWG Median (P25; P75) or n (%)
(n=86)
p‑value*
Duration of breast feeding (months)
Exclusiveb 3 (2; 5) 3 (2; 4.5) 4 (3; 5) 0.200
<6 monthsb.c 92 (79.2) 33 (80.5) 59 (78.7) 0.690†
Predominate 4 (3; 6) 4 (3; 6) 4 (3; 6) 0.140
Total 6(4; 14) 6 (3; 9) 7 (4; 20) 0.010
Age solid foods were introduced (months)d 5 (4; 6) 6 (4; 6) 5 (4; 6) 0.335
Consumption frequency of unhealthy
foods (two or more times / day)c.e 65 (51.6) 25 (55.5) 40 (49.4) 0.500†
RWG: rapid weight gain; NRWG: no rapid weight gain; P25; first quartile; P75: third quartile; a increase in weight‑for‑age Z score > 0.67 from
birth to the time of the study; bn=116 received exclusive breastfeeding (rapid growth group. n=41; non‑rapid growth group. n=75). 14 did
not receive exclusive breastfeeding and 6 did not have data; cn (%); dn=127 with complete data for the age when solid foods were introduced
(RWG group. n=45; NRWG group. n=82); en=126 with complete data on the consumption frequency of unhealthy foods (RWG group. n=45;
NRWG group. n=81); *p‑value based on Student t’s test; †p value based on the chi‑square test.
Table 4 Factors associated with rapid weight gain* in the second year of life of children (n=117) attending public
daycare centers in Mogi das Cruzes. 2014.
Factors Univariate Multivariate
OR (95%CI) p‑value AOR (95%CI) p‑value
Total breastfeeding duration (months) 0.94 (0.89–0.98) 0.011 0.94 (0.88–0.99) 0.031
Social class (C2 and D) 1.90 (0.19–0.72) 0.190 4.18 (1.04–18.60) 0.044
Model adjusted for birth weight and height. age of child and age solid foods were introduced.
OR: Odds Ratio; 95%CI: 95% confidence interval; AOR: Adjusted odds ratio; *increase in weight‑for‑age Z score > 0.67 from birth to the moment
of the study; Goodness‑of‑fit: p=0.2667.
percentage of primiparous mothers and mothers who smoked during pregnancy, when compared to the children in the control group. Although these associations have also been described in other studies, the present study did not identify these situations as factors associated with RWG in the mul‑ tiple analysis.7,23,24
However, the children in the RWG group received less total breastfeeding time when compared to the RWG group (median: 6 months versus 7 months, p=0.001). This dif‑ ference between groups, regardless of birth weight and height, child’s age and the age solid foods were introduced, may indicate the protective role of breast milk in the first months of life. From the moment the child stops receiv‑ ing breast milk, other foods are introduced which do not always meet their nutritional needs, and often exceed the recommended energy consumption. This excess, in turn, increases the risk of RWG, especially in the stage of life in which the nutritional status is highly sensitive to changes in food consumption.8,9,25
Thus, the results of the present study demonstrate that with each month of breast milk consumption there is a 6% less risk of accelerated weight gain. In fact, studies have shown that the longer children breastfeed, the more of a protective effect it pro‑ vides in relation to being overweight in childhood.26,27 One of
the benefits of breast milk is its composition, which has high protein quality in low quantities. Excessive intake of protein, especially branched amino acids such as leucine, in the first two years of life is associated with an increased risk of adipos‑ ity, demonstrating that, in addition to the amount of protein consumed by the infant, the type of protein offered and the differences in the amino acid composition are important in order to protect him or her from the risk of becoming over‑ weight.28 In addition, the child receiving breastfeeding often
self‑regulates their appetite more effectively and is therefore less susceptible to establishing strict eating times and to con‑ suming certain amounts of milk.
group. Although there is no evidence in the literature between the association of socioeconomic status with this specific outcome, there are numerous studies that have demonstrated an association between low socioeconomic status with becoming overweight as a result of easy access to processed, high energy density and low nutritional value foods.9
This result corroborates what has been found in developed countries, where being overweight has been associated with worse socioeconomic conditions.29 This fact is reinforced by
how socioeconomic classification was determined in this study. It considers the possession of goods and of the level of school‑ ing of the head of household. Therefore, our findings confirm those found in other studies, which observed a negative asso‑ ciation between maternal schooling and family income with unhealthy food consumption.30 However, there are Brazilian
studies that suggest that the prevalence of being overweight is higher in children belonging to higher socioeconomic classes, which have more purchasing power for goods and food.31
This divergence can be explained by the diversity of the pop‑ ulation of Brazilian children living at different socioeconomic levels, and by the specificity of the population of children attending daycare centers.
Maternal education also appears to influence the quality of infant feeding and nutrition. People’s knowledge about food is usually acquired through the radio, television, magazines and newspapers, which strongly influences these household’s food choices.30 Mothers who use formulas for children are
more likely not to follow all of the recommendations with regard to complementary feeding.32 What seems sensible
to consider is that, in some way, the child’s socioeconomic level and the parents’ schooling can interfere in their nutri‑ tional status, and there is a multi‑causality characteristic of the being overweight which is particular to each family or population group.
Nevertheless, although it is not possible to say that every child with RWG during this phase will be overweight, because it is a multifactorial nutritional disorder, it seems important to investigate, monitor and guide the dietary intake of this group of children.
It should be noted that the population studied was socio‑ economically homogeneous and had specific healthcare and educational characteristics, because they attend public and philanthropic daycare centers. However, about 1/4 of the population studied was overweight during their third year of life, demonstrating the risk of obesity. An extrapolation of the results presented in this study to children of other character‑ istics should be performed carefully, despite the fact that the findings confirm the need for weight monitoring in the early
years of life. In addition, understanding the importance for children to receive high quality food during their first thou‑ sand days of life for neuroendocrine regulation and for their body composition, our questionnaire, which focused on intro‑ ducing food and feeding frequency may not have accurately reported on food consumption and when the investigated foods were introduced. This could have been minimized if a validated instrument were available to assess the consump‑ tion of processed foods. Other limitations of the present study were sample size and the low explanatory power of the multi‑ ple model, which identified only two factors associated with RWG. This evidence points to the existence of other factors not identified in this investigation, which proves the multi‑ factorial characteristic of determining RWG in children in the studied age group.
A longer period of time for breastfeeding proved to be a protective factor for RWG, and the low socioeconomic status of the families was associated with a higher risk of Z‑W/A evolution. Therefore, RWG identification strategies and early nutritional therapeutic measures should be per‑ formed to prevent and control children from being over‑ weight. Incentives for breastfeeding and the improvement of the socioeconomic conditions of the populations at risk are important. However, there are many challenges with regard to the improvement of these conditions on a large scale in developing countries, such as Brazil, and the change in food behavior in the populations with low incomes and low lev‑ els of schooling. These challenges range from planning to direct actions made by pediatricians and other health pro‑ fessionals, who propose changes in the attitudes of parents that are responsible for feeding their child and set an exam‑ ple for forming eating habits.
Thus, promoting extended maternal breastfeeding, devel‑ oping nutritional and educational strategies, monitoring nutri‑ tion in children’s’ first years of life, and creating possibilities for improved family life conditions may contribute to the reduction of postnatal excess weight and its future metabolic complica‑ tions. It is recommended that additional studies be developed with more detailed information on dietary patterns, using val‑ idated indicators of processed foods consumption in children with other socioeconomic/cultural characteristics to determine new interventions and to identify other factors associated with RWG and future obesity.
Funding
This study did not receive funding.
Conflict of interests
REFERENCES
1. D’Orner G. Environment‑dependent brain differentiation and fundamental processes of life. Acta Biol Med Ger. 1974;33:129‑48.
2. Brazil – Ministério do Planejamento, Desenvolvimento e Gestão. Instituto Brasileiro de Geografia e Estatística (IBGE). [homepage on the Internet]. Pesquisa Nacional por Amostra de Domicílios (PNAD) 2014. Rio de Janeiro IBGE; 2014. [cited 2015 January]. Available f r o m : h t t p : / / w w w . o b s e r v a t o r i o d o p n e . o r g . b r/ metas‑pne/1‑educacao‑infantil/indicadores
3. Ruiz JS. O surgimento da creche: uma construção social e histórica. Proceedings of the V Encontro Brasileiro de Educação e Marxismo, Educação e Emancipação Humana; 2011Apr 11‑14; Florianópolis, Santa Catarina. [cited 2014 October]. Available from: https://pt.slideshare.net/ Johnnykpn/o‑surgimento‑da‑creche
4. Brazil – Presidência da República. Fundo Nacional de Desenvolvimento da Educação. [homepage on the Internet]. Lei nº 12.982, de 28 de maio de 2014, que altera a Lei nº 11.947, de 16 de junho de 2009, para determinar o provimento de alimentação escolar adequada aos alunos portadores de estado ou de condição de saúde específica. Brasília: Diário Oficial da União; 2014. [cited 2015 November]. Available from: http://www.fnde.gov. br/fnde/legislacao/leis/item/5647‑lei‑n%C2%BA‑12‑982, ‑de‑28‑de‑maio‑de‑2014
5. Longo‑Silva G, Taddei JA, Konstantyner T, Toloni MH. Percepções de educadores de creches acerca de práticas cotidianas na alimentação de lactentes: impacto de um treinamento. Ciênc Saúde Coletiva. 2013;18:545‑52.
6. Ong TP, Ozanne SE. Developmental programming of type 2 diabetes: early nutrition and epigenetic mechanisms. Curr Opin Clin Nutr Metab Care. 2015;18:354‑60.
7. Monteiro PO, Victora CG. Rapid growth in infancy and childhood and obesity in later life‑a systematic review. Obes Rev. 2005;6:143‑54.
8. Ong KK, Ahmed ML, Emmett PM, Preece MA, Dunger DB. Association between postnatal catch‑up growth and obesity in childhood: prospective cohort study. BMJ. 2000;320:967‑71.
9. Ong KK, Loos RJ. Rapid infancy weight gain and subsequent obesity: Systematic reviews. Acta Pædiatr. 2006;95:904‑8.
10. Brazil – Ministério do Planejamento, Desenvolvimento e Gestão. Instituto Brasileiro de Geografia e Estatística ‑ IBGE. [homepage on the Internet]. Estimativas de população para 1º de julho de 2016. Rio de Janeiro: IBGE. [cited 2017 January]. Available from: http://www.ibge.gov.br/home/ estatistica/populacao/estimativa2016/estimativa_tcu.shtm
11. Programa das Nações Unidas para o Desenvolvimento – PNUD [homepage on the Internet]. Atlas do desenvolvimento humano [cited 2017 Apr 13]. Available from: http://www. atlasbrasil.org.br/2013/pt/perfil_m/mogi‑das‑cruzes_sp 12. World Health Organization. ICD‑10: International statistical
classification of diseases and related health problems, 10th revision. Geneva: WHO; 2004.
13. Dean AG, Arner TG, Sangam S, Sunki GG, Friedman R, Lantinga M, et al. Epi Info 2000: a database and statistics program for public health professionals for use on Windows 95, 98, NT, and 2000 computers. Atlanta (GA): Centers for Disease Control and Prevention; 2000.
14. Colucci AC, Philippi ST, Slater B. Desenvolvimento de um questionário de frequência alimentar para avaliação do consumo alimentar de crianças de 2 a 5 anos de idade. Rev Bras Epidemiol. 2004;7:393‑401.
15. Brazil ‑ Ministério da Saúde. Secretaria de Atenção à Saúde. Departamento de Atenção Básica. Guia alimentar para a população brasileira. 2nd ed. Brasília: Ministério da Saúde; 2014.
16. Sociedade Brasileira de Pediatria – SBP. Departamento de Nutrologia. Avaliação nutricional da criança e do adolescente. Manual de Orientação. Rio de Janeiro: SBP; 2009.
17. Associação Brasileira de Empresas de Pesquisa – ABEP [homepage on the Internet]. Critério de Classificação Econômica Brasil [cited 2014 Jan 30]. Available from: http:// www.abep.org/criterio‑brasil
18. Barker DJ. Fetal origins of coronary heart disease. BMJ. 1995;311:171‑4.
19. Brazil ‑ Ministério da Saúde. Centro brasileiro de análise e planejamento. Pesquisa Nacional de Demografia e Saúde da Criança e da Mulher – PNDS 2006: dimensões do processo reprodutivo e da saúde da criança. Brasília: Ministério da Saúde; 2009.
20. World Health Organization. Global Data Bank on Infant and Young Child Feeding. Brasília: WHO; 2009.
21. Brasil ‑ Ministério da Saúde. Secretaria de Atenção à Saúde. Departamento de Ações Programáticas e Estratégicas. II Pesquisa de Prevalência de Aleitamento Materno nas Capitais Brasileiras e Distrito Federal. Brasília: Ministério da Saúde; 2009.
22. Ong KK, Emmett PM, Noble S, Ness A, Dunger DB. Dietary energy intake at the age of 4 months predicts postnatal weight gain and childhood body mass index. Pediatrics. 2006;117:e503‑8.
23. Griffiths LJ, Hawkins SS, Cole TJ, Dezateux C, Millennium Cohort Study Child Health Group. Risk factors for rapid weight gain in preschool children: findings from a UK‑wide prospective study. Int J Obes (Lond). 2010;34:624‑32.
24. Salgin B, Norris SA, Prentice P, Pettifor JM, Richter LM, Ong KK, et al. Even transient rapid infancy weight gain is associated with higher BMI in young adults and earlier menarche. Int J Obes (Lond). 2015; 39:939‑44.
25. Vitolo MR, Gama CM, Bortolini GA, Campagnolo PDB, Drachler ML. Some risk factors associated with overweight, stunting and wasting among children under 5 years old. J Pediatr (Rio J). 2008;84:251‑7.
© 2018 Sociedade de Pediatria de São Paulo. Published by Zeppelini Publishers.
This is an open access article under the CC BY license (http://creativecommons.org/licenses/by/4.0/). 27. Carling SJ, Demment MM, Kjolhede CL, Olson CM.
Breastfeeding duration and weight gain trajectory in infancy. Pediatrics. 2015;135:112‑21.
28. Socha P, Grote V, Gruszfeld D, Janas R, Demmelmair H, Closa‑Monasterolo R, et al. Milk protein intake, the metabolic‑endocrine response, and growth in infancy: data from a randomized clinical trial. Am J Clin Nutr. 2011;94suppl 6:1776S‑84S.
29. Zsakai A, Bodzsar EB. The relationship between body structure and the socio‑economic status in hungarian children and adolescents. Coll Antropo. 2014;38:479‑85.
30. Slusser W, Prelip M, Kinsler J, Erausquin JT, Thai C, Neumann C. Challenges to parent nutrition education: a qualitative study of parents of urban children attending low‑income schools. Public Health Nutr. 2011;14:1833‑41.
31. Oppitz IN, Cesar JA, Neumann NA. Excesso de peso entre menores de cinco anos em municípios do semiárido. Rev Bras Epidemiol. 2014;17:860‑72.