Michelle Alessandra de CastroI
Rodrigo Ribeiro BarrosII
Milena Baptista BuenoII
Chester Luiz Galvão CésarIII
Regina Mara FisbergIV
I Programa de Pós-Graduação em Nutrição em Saúde Pública. Faculdade de Saúde Pública (FSP). Universidade de São Paulo (USP). São Paulo, SP, Brasil
II Programa de Pós-Graduação em Saúde Pública. FSP-USP. São Paulo, SP, Brasil III Departamento de Epidemiologia. FSP-USP.
São Paulo, SP, Brasil
IV Departamento de Nutrição. FSP-USP. São Paulo, SP, Brasil
Correspondence: Regina Mara Fisberg Faculdade de Saúde Pública Universidade de São Paulo
Av. Dr. Arnaldo, 715 – Cerqueira César 01246-90 São Paulo, SP, Brasil E-mail: rfi [email protected] Received: 11/23/2008 Revised: 6/2/2009 Approved: 6/25/2009
Trans fatty acid intake among
the population of the city of
São Paulo, Southeasthern Brazil
Consumo de ácidos graxos trans na
população da cidade de
São Paulo, SP
ABSTRACT
OBJECTIVE: To analyze the monounsaturated and polyunsaturated trans fatty acid intake among the general population.
METHODS: A cross-sectional study was conducted in São Paulo, Southeastern Brazil, in 2003, on a representative sample of 2,298 male and female subjects, including 803 adolescents (12 to 19 years), 713 adults (20 to 59 years) and 782 elderly people (60 years or over). Food intake was measured using 24-hour recall. Mean trans fatty acid intake was described according to gender and age group.
RESULTS: The mean trans fatty acid intake was 5.0 g/day (SE = 0.1), accounting for 2.4% (SE = 0.1) of total energy and 6.8% (SE = 0.1) of total lipids. The adolescents had the highest mean intake levels (7.4 g/day; 2.9% of energy) while the adults and the elderly had similar intake (2.2% of energy for both; 6.4% of lipids and 6.5% of lipids, respectively). The mean trans fatty acid intake among adult and elderly women (approximately 2.5% of energy and 7.0% of lipids) was higher than among men in the same age group. The food item with the highest contribution towards trans fatty acids was margarine, accounting for more than 30% of total intake, followed by fi lled cookies among adolescents and meat among adults and the elderly.
CONCLUSIONS: The trans fatty acid intake is above the level recommended by the World Health Organization. Replacement of the trans fatty acids in manufactured food items may be an effective measure for reducing trans fatty acid intake in Brazil.
Over recent decades, epidemiological research has investigated physiological disorders resulting from different intake levels of trans fatty acids (TFAs). These studies have provided strong evidence that trans isomers can cause adverse effects to health, with increased risk of cardiovascular diseases and induction of generalized inflammation.2,10,13,14,20 According to Mozaffarian et
al,15 TFAs are involved in the pathophysiology of these
diseases and this systemic infl ammation by inducing dose-dependent increases in LDL-c/HDL-c ratio, serum triglycerides and lipoprotein Lp(a). They also inhibit the biosynthesis of arachidonic acid, thereby leading to metabolic alterations such as changes in membrane fl ui-dity, endothelial dysfunction and erythrocyte membrane fragility, in addition to stimulating production of the cytokines TNF-∝ and IL-6 and of C-reactive protein.15
The World Health Organization (WHO), supported by scientifi c evidence showing the harmful effects of TFAs, has made recommendations regarding their intake: less than 1% of daily total energy intake, in order to prevent non-transmittable chronic diseases.23
RESUMO
OBJETIVO: Analisar o consumo de ácidos graxos monoinsaturados e poliinsaturados de confi guração trans na população geral.
MÉTODOS:Estudo transversal realizado em São Paulo, SP, 2003, com amostra representativa de 2.298 indivíduos, sendo 803 adolescentes (12 a 19 anos), 713 adultos (20 a 59 anos) e 782 idosos (60 anos ou mais), de ambos os sexos. O consumo alimentar foi medido por meio do recordatório alimentar de 24 horas. Os valores médios de ingestão de ácidos graxos trans foram descritos segundo sexo e faixa etária.
RESULTADOS: O consumo médio de ácidos graxos trans foi de 5,0g/dia (EP=0,1), correspondendo a 2,4% (EP=0,1) do total calórico e 6,8% (EP=0,1) do total de lipídios. Os adolescentes apresentaram as maiores médias de ingestão (7,4g/dia e 2,9% energia), enquanto os adultos e idosos registraram ingestão semelhante (2,2% energia; 6,4% lipídios e 6,5% lipídios, respectivamente). As médias de consumo de ácidos graxos trans entre mulheres adultas e idosas (aproximadamente 2,5% energia e 7,0% lipídios) foram maiores que as médias dos homens de mesma faixa etária. O alimento de maior contribuição para o consumo de ácidos graxos trans foi a margarina, representando mais de 30% do total ingerido, seguido do biscoito recheado para os adolescentes e da carne bovina para os adultos e idosos.
CONCLUSÕES: O consumo de ácidos graxos trans encontra-se acima do preconizado pela Organização Mundial da Saúde. A substituição dos ácidos graxos trans dos alimentos industrializados pode ser uma medida efi caz para a redução do consumo desse tipo de gordura no Brasil.
DESCRITORES: Gorduras na Dieta. Ácidos Graxos Insaturados. Consumo de Alimentos. Inquéritos Alimentares. Estudos Transversais. Grupos Populacionais.
INTRODUCTION
TFAs are rarely found in a natural state, but are present in the milk and tissues of ruminating animals as a bypro-duct of biohydrogenation by anaerobic bacteria living in the rumen.3,13 Cantwell et al7 and Lemaitre et al11
showed that a major source of TFAs in the diet comes from partially hydrogenated vegetable oil in processed foods that are regularly consumed in a typical Western diet, such as in hard and soft margarines, cookies, snacks and bread products.
Given the importance of diet as a factor for health promotion and disease prevention, the present study aimed to analyze the monounsaturated and polyunsa-turated TFA intake in the general population.
METHODS
Two-stage cluster sampling of census tracts and households was performed. Census tracts were grouped into three strata based on the percentage of family heads with university schooling. In the fi rst stage, by using probability proportional to size, ten census tracts were drawn from each of the strata, making a total of 30 census tracts for each region. In the second stage, households were drawn from each sector.
The sampling process had the aim of ensuring at least 200 interviews for each of the six domains, composed of three age groups for each gender: 12 to 19 years (adolescents), 20 to 59 years (adults) and 60 years or over (elderly people).
The minimum of 200 interviews enabled estimation of a prevalence of 0.5 with a standard error of 0.06 at a 5% signifi cance level and a design effect of 1.5.
The sample size was then doubled to improve the statis-tical power, thus comprising 400 subjects per domain. The fi nal sample included 2,400 subjects (both males and females), aged 12 years or over.
Adolescents with total energy intake below 600 kcal/ day or above 6,000 kcal/day and adults and elderly people with energy intake below 500 kcal/day or above 4,000 kcal/day were excluded from the analy-sis.21 Thus, a total of 102 interviewees were excluded
resulting in a sample of 2,298 subjects (both males and females), comprising 803 adolescents, 713 adults and 782 elderly people.
A structured questionnaire concerning demographic, socioeconomic, family and lifestyle characteristics was applied by trained interviewers at the participants’ homes. The main results are shown in Table 1. The dietary assessment consisted of a single 24-hour recall adapted from Thompson & Byers.19 The food
items reported were quantifi ed in grams, in accordance with Pinheiro et al17 and Fisberg & Villar.8
The data from the 24-hour recall were entered into the Nutrition Data System for Research (version 5.0, 2007, Nutrition Coordinating Center, Minneapolis, US), which was developed by the University of Minnesota for gathering nutritional information. The primary source of nutritional food values was the US Department of Agriculture (USDA) nutritional composition table, and this was extended with information provided by food manufacturers, the scientifi c literature and other published food tables. Data from all sources of nutrient information were evaluated for reliability before their inclusion in the database software.
TFA intake was analyzed as the sum of three isomers: hexadecenoic acid (C16:1 7trans), elaidic acid (C18:1 9trans) and linoelaidic acid (C18:2 9,12 cis-trans, trans-cis and trans-trans were included).
The mean TFA intake was described according to gender and age groups. The data on each nutrient were analyzed to determine whether their distribution was normal, using the Kolmogorov-Smirnov test. Skewed nutrient data were transformed into natural logarithm form. Student’s t-test and one-way ANOVA with Bonferroni’s multiple comparison test were performed to analyze differences in mean TFA intake according to gender and age groups. P-values < 0.05 were considered signifi cant. The data analysis was conducted using Stata, version 8.0, with svy commands for descriptive analysis, and using SPSS, version 10.0.
A list of the major food items accounting for the TFA intake was produced using the weighed-proportions formula developed by Block et al.6 Hence, the relative
contribution (RC) of a given food item was defi ned as:
The main research project was approved by the Ethics Committee of the Faculdade de Saúde Pública, Universidade de São Paulo. All participants signed the consent form.
RESULTS
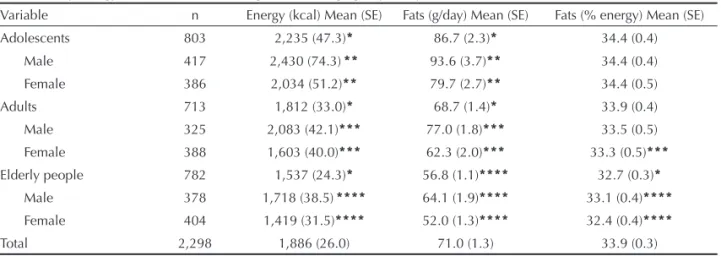
The mean energy and fat intakes in the study sample were 1,886 kcal/day and 71 g/day, respectively (Table 2). In all age groups, male subjects, especially adolescents, had higher intake than women did (p < 0.001). The mean contribution of fat to energy intake was 33.9%, with higher values observed among adolescents and adult women, compared with elderly subjects (p < 0.001). The mean TFA intake was 5.0 g/day (SE = 0.1), accoun-ting for 2.4% (SE = 0.1) of energy intake and 6.8% (SE = 0.1) of total fat consumed. Comparison of mean TFA intake (g/day) between age groups showed that adolescents had the highest intake and, in particular, male adolescents (Table 3).
Regarding the TFA contribution towards total energy (%E), female adolescents showed higher intake than the intake among elderly women (p = 0.009). Comparison of mean TFA intake (%E) within the age groups indicated higher intake among adult and elderly women (Table 3).
The contribution of TFAs to total fat intake was higher among adult and elderly women than among men in the same age group (Table 3). However, no differences in mean intake were found between adult and elderly women or between adult and elderly men.
Table 4 lists ten food items that most contributed towards TFA intake. In all age groups, margarine was the food with the highest contribution, providing more than a third of total TFA consumption, followed by
fi lled cookies among adolescents (11.0%) and meat among adults and elderly people (10.0% and 10.2%, respectively).
DISCUSSION
The mean TFA intake among this population was 5.0 g/day, thus accounting for 2.4% of their daily energy intake. This was above the limit recommended by WHO for preventing non-transmittable chronic diseases (< 1% of total calories).21
These fi ndings are similar to those reported by Allison et al,1 who found mean TFA intake of 5.3 g/day among
11,200 Americans, thus accounting for 2.6% of their daily energy intake.
In a study by Harnack et al10 that aimed to evaluate
trends in TFA intake among adults, a reduction in TFA intake was observed between 1980–1982 and 1995–1997. The mean intake reported for the second period was similar to that found in our study (2.2% of energy intake).
Table 1. Sociodemographic characteristics and nutritional status of study subjects according to sex and age groups. City of São Paulo, Southeastern Brazil, 2003.
Variable
Adolescents Adults Elderly people Male Female Male Female Male Female
na % na % na % na % na % na %
Skin color
White 248 60.3 224 58.2 195 60.2 255 65.7 261 69.2 281 69.6
Black 32 7.8 30 7.8 34 10.5 34 8.8 24 6.4 32 7.9
Others 131 31.9 131 34.0 95 29.3 99 25.5 92 24.4 91 22.5 Nutritional statusb
Underweight 15 4.2 5 1.5 8 2.6 15 4.3 70 20.4 62 19.1 Normal weight 274 76.5 261 79.3 165 52.6 198 57.1 161 46.9 134 41.4 Overweight 49 13.7 51 15.5 101 32.2 101 29.1 112 32.7 128 39.5
Obese 20 5.6 12 3.7 40 12.7 33 9.5 - - -
-Head of the family’s schooling level
0 - 4 years 144 35.0 111 29.1 107 33.0 132 34.4 249 66.6 255 64.6 5 - 9 years 106 25.7 112 29.3 85 26.2 106 27.6 46 12.3 53 13.4 10 years or more 162 39.3 159 41.6 132 40.7 146 38.0 79 21.1 87 22.0
a Missing datawere excluded.
b According to cut-off points of World Health Organization22,24 cut-off points for adolescents (2007) and for adults (1995); and according to Nutrition Screening Initiative16 (1994) for elderly people.
Table 2. Daily energy and fat intake according to sex and age groups. City of São Paulo, Southeastern Brazil, 2003. Variable n Energy (kcal) Mean (SE) Fats (g/day) Mean (SE) Fats (% energy) Mean (SE) Adolescents 803 2,235 (47.3)* 86.7 (2.3)* 34.4 (0.4)
Male 417 2,430 (74.3)** 93.6 (3.7)** 34.4 (0.4) Female 386 2,034 (51.2)** 79.7 (2.7)** 34.4 (0.5)
Adults 713 1,812 (33.0)* 68.7 (1.4)* 33.9 (0.4)
Male 325 2,083 (42.1)*** 77.0 (1.8)*** 33.5 (0.5) Female 388 1,603 (40.0)*** 62.3 (2.0)*** 33.3 (0.5)***
Elderly people 782 1,537 (24.3)* 56.8 (1.1)**** 32.7 (0.3)*
Male 378 1,718 (38.5)**** 64.1 (1.9)**** 33.1 (0.4)****
Female 404 1,419 (31.5)**** 52.0 (1.3)**** 32.4 (0.4)****
Total 2,298 1,886 (26.0) 71.0 (1.3) 33.9 (0.3)
SE: Standard error;
* Student’s t-test: p<0.05 for genders within the age group;
** ANOVA: p<0.05 compared with adults of the same-sex;
In Brazil, the only other study that estimated TFA intake was carried out by Bertolino et al,4 who examined the
impact of TFA intake on the fat profi le of 328 Japanese-Brazilians living in Bauru, southeastern Brazil. A food frequency questionnaire was applied between 1993 and 2000 to assess the usual nutrient intake. In 2000, these Japanese-Brazilians showed mean TFA intake of nearly 3.3% of total energy among men and 3.4% among women. These values were lower than the values reported in 1993. Despite differences between the dietary assessment methods, we found lower TFA intake in our study.
Overall, the mean TFA intake (g/day) decreased with age. Subjects younger than 20 years old had higher mean TFA intake in g/day as well as in terms of percentages of energy and fat. It should be pointed out
that adolescents also had higher mean energy, fat (g/ day) and fat contribution towards energy intake, thus suggesting that greater amounts of this macronutrient in their diet led to higher energy and TFA intake values. These fi ndings predict the dietary pattern observed during adolescence, with both high-energy processed foods and trans fats, as shown in Table 4.
The elderly showed lower mean intake of energy, fats (g/day) and TFA (g/day) than all the other age groups. However, the mean TFA intake in terms of energy and fat contribution was similar to that found among adults. In addition, the ten items that most contributed towards TFAs accounted for about 78% of total trans fat. This is consistent with Cantwell et al,7 who identifi ed the
food items that most contributed towards TFA intake
Table 3. Mean intake of monounsaturated and polyunsaturated trans fatty acids according to sex and age group. City of São Paulo, Southeastern Brazil, 2003.
Variable n Trans fatty acids (g/day)Mean (SE) Trans fatty acids (%energy)Mean (SE) Trans fatty acids (%fats)Mean (SE)
Adolescents 803 7.4 (0.3)* 2.9 (0.1) 8.1 (0.2)
Male 417 7.8 (0.6)** 2.8 (0.1)** 7.9 (0.3)**
Female 386 7.0 (0.4)** 3.0 (0.1) 8.3 (0.4)
Adults 713 4.5 (0.2) 2.2 (0.1)* 6.4 (0.2)*
Male 325 4.6 (0.3)*** 1.9 (0.1) 5.7 (0.3)
Female 388 4.3 (0.2)*** 2.5 (0.1) 6.9 (0.2)
Elderly people 782 3.8 (0.1) 2.2 (0.1)* 6.5 (0.2)*
Male 378 4.0 (0.2)**** 2.0 (0.1)**** 5.8 (0.2)****
Female 404 3.7 (0.2)**** 2.4 (0.1)**** 7.0 (0.2)
Total 2,298 5.0 (0.1) 2.4 (0.1) 6.8 (0.1)
SE: Standard error;
* Student’s t-test: p<0.05 for sex within a single age group;
** ANOVA: p<0.05 compared with adults of the same-sex;
*** ANOVA: p<0.05 compared with elderly of the same-sex;
**** ANOVA: p<0.05 compared with adolescents of the same-sex.
Table 4. Percentage contribution of food to monounsaturated and polyunsaturated trans fatty acids intake, according to age group. City of São Paulo, Southeastern Brazil, 2003.
Adolescents (n=803) Adults (n=713) Elderly (n=782)
Food item % Total trans Food item % Total trans Food item % Total trans
Margarine 36.7 Margarine 34.7 Margarine 36.3
Filled cookie 11.0 Meat 10.0 Meat 10.2
Pizza 6.1 Pizza 6.8 Cracker 8.1
Rolls 5.8 Rolls 6.8 Rolls 7.6
Meat 5.5 Unfi lled cookie 5.5 White cake 3.7
Cracker 4.8 Cracker 4.6 (Cooked/fried) Grits 3.4
Microwave popcorn 1.7 White cake 2.8 Pizza 2.8
Whole milk 1.6 Whole milk 2.1 Unfi lled cookie 2.7
Butter 1.5 Butter 2.0 Whole milk 2.6
among the Irish population, through a semi-quantitative questionnaire on fat intake. In that population, marga-rine also accounted for more than 35% of all TFAs consumed. This fi nding could be attributed to the wides-pread consumption of this food, along with its elaidic acid content (C18:1 9trans), which is formed by partial hydrogenation of vegetable or marine oils.
Unlike adolescents, the second food that most contri-buted to TFA intake among adults and elderly was meat. In addition to the TFA isomers analyzed in the present study, other TFAs are present in meat, such as like vaccenic acid (C18:1 11trans) and conjugated linolenic acids (CLA). Both vaccenic acid and CLAs are found naturally in meat and dairy products through the process of bacterial biohydrogenation of linoleic and linolenic acid in the rumen.5,9 The fi ndings of meat and
cow’s milk among the ten food items with the greatest contribution is not because of the high TFA content of these items but, rather, because these foods are often consumed in large amounts. The health effects from natural TFA intake (vaccenic acid and CLA) that have been described in the literature are still inconclusive.5,7,9
Some studies using animal models and cell cultures derived from humans have demonstrated several
bene-fi cial effects from CLA, in relation to many disorders such as cardiovascular and infl ammatory diseases, insulin resistance and different types of cancer. These effects have been attributed to the antiadipogenic, antiatherogenic, anti-infl ammatory, antidiabetogenic and anticarcinogenic activities of CLA. However, in most of the clinical studies on humans, CLA did not show these benefi cial effects.5,9
Given that the TFA intake in the population studied was above the WHO recommendations, and considering the adverse effects of TFAs on health, it is important to implement public health policies for effective control over TFA intake. The Brazilian Ministry of Health, through its National Health Surveillance Agency
(Agência Nacional de Vigilância Sanitária,ANVISA),
has already established that all labels for processed food products must include information on trans fat content. However, for food items produced in fast food restaurant chains, bakeries or any other facilities where foods are sold with no packaging labels or information, the ANVISA regulation may not succeed in reducing TFA intake.
Placing limits on TFA content in food items was an effective action for reducing TFA intake in Denmark. Danish authorities established a maximum limit of 2% for trans fats in all food items a few years ago. In 2005, the availability of TFA-free margarines signifi cantly reduced TFA intake.12,18
In Brazil, production of TFA-free margarines started in 2005, using technologies such as interesterifi cation of vegetable oils and the use of fractions derived from palm and palm kernel oil.
Eliminating TFAs from margarines can help reduce trans fat intake, but it is essential to replace the TFAs that are present in widely consumed food items such as fi lled cookies and bakery products. A simulation analysis showed that elimination of TFAs from marga-rines alone would reduce the TFA intake from 5.0 g/day (SE = 0.2) to 3.1 g/day (SE = 0.1), i.e. from 2.4% (SE = 0.1) to 1.4% (SE = 0.03) of total energy. However, the contribution of TFAs to dietary energy would be still above the recommended levels, which reinforces the urgent need for interventions in Brazil.
1. Allison DB, Egan SK, Barraj LM, Caughman C, Infante M, Heimbach JT. Estimated intakes of trans fatty and other fatty acids in the US population. J Am Diet Assoc. 1999;99(2):166-74. DOI:10.1016/S0002-8223(99)00041-3
2. Ascheiro A, Hennekens CH, Buring JE, Master C, Stampfer MJ, Willet WC. Trans-fatty acids and risk of myocardial infarction. Circulation. 1994;89(1):94-101. 3. Aued-Pimentel S, Caruso MSF, Cruz JMM, Kumagai EE,
Côrrea DUO. Ácidos graxos saturados versus ácidos graxos trans em biscoitos. Rev Inst Adolpho Lutz. 2003;62(2):131-7.
4. Bertolino CN, Castro TG, Sartorelli DS, Ferreira SRG, Cardoso MA. Infl uência do consumo alimentar de ácidos graxos trans no perfi l de lipídios séricos em nipo-brasileiros de Bauru, São Paulo, Brasil. Cad Saude Publica. 2006;22(2):357-64. DOI:10.1590/S0102-311X2006000200013
5. Bhattacharya A, Banu J, Rahman M, Causey J, Fernandes G. Biological effects of congutaded linoleic acids in health and disease. J Nutr Biochem. 2006;17(12):789-810. DOI:10.1016/j. jnutbio.2006.02.009
6. Block G, Hartman AM, Dresser CM, Carroll MD, Gannon J, Gardner L. A data-based approach to diet questionnaire design and testing. Am J Epidemiol. 1986;124(3):453-69.
7. Cantwell MM, Flynn MA, Cronin D, O’Neill JP, Gibney MJ. Contribution of foods to trans unsaturated fatty acid intake in a group of Irish adults. J Hum Nutr Diet. 2005;18(5):377-85. DOI:10.1111/j.1365-277X.2005.00636.x
8. Fisberg RM, Villar BS. Manual de receitas e medidas caseiras para cálculo de inquéritos alimentares: manual elaborado para auxiliar o processamento de inquéritos alimentares. São Paulo: Signus; 2002. 9. Funck LG, Barrera-Arellano D, Block JM. Ácido
linoléico conjugado (CLA) e sua relação com a doença cardiovascular e os fatores de risco associados. Arch Latinoam Nutr. 2006;56(2):123-34.
10. Harnack L, Lee S, Schakel SF, Duval S, Luepker RV, Arnett DK. Trends in the trans-fatty acid composition of the diet in a metropolitan area: The Minnesota Heart Survey. J Am Diet Assoc. 2003;103(9):1160-6. DOI:10.1016/S0002-8223(03)00976-3
11. Lemaitre RN, King IB, Patterson RE, Psaty BM, Kestin M, Heckbert SR. Assessment of trans-fatty acid intake with a food frequency questionnaire and validation with adipose tissue levels of trans-fatty acids. Am J Epidemiol. 1998;148(11):1085-93.
12. Leth T, Jensen HG, Mikkelsen AA, Bysted A. The effect of the regulation on trans fatty acid content in Danish food. Atheroscler Suppl. 2006;7(2):53-6. DOI:10.1016/j.atherosclerosissup.2006.04.019 13. Martin CA, Matsushita M, Souza NE. Ácidos graxos
trans: implicações nutricionais e fontes na dieta. Rev Nutr. 2004;17(3):351-9. DOI:10.1590/S1415-52732004000300009
14. Mensink RPM, Katan MB. Effect of dietary fatty acids on high-density and low-density lipoprotein cholesterol levels in healthy subjects. N Eng J Med. 1990;323(7):439-45.
15. Mozaffarian D, Katan MB, Ascherio A, Stampfer MJ, Willett WC. Trans fatty acids and cardiovascular disease. N Engl J Med. 2006;354(15):1601-13. DOI:10.1056/NEJMra054035
16. Nutrition Screening Initiative. Incorporating nutrition screening and interventions into medical practice: a monograph for physicians. Washington, DC; 1994. (Nutrition interventions: the next steps).
17. Pinheiro ABV, Lacerda EMA, Benzecry EH, Gomes MCS, Costa VM. Tabela para avaliação de consumo alimentar em medidas caseiras. 4.ed. São Paulo: Atheneu; 2000.
18. Stender S, Dyerberg J, Bysted A, Leth T, Astrup AV. Hojt indhold af industrielt producerede transfedtsyrer i populaere fodevarer - men ikke i Danmark - sekundaerpublikation. Ugeskr Laeger. 2006;168(17):1654-7.
19. Thompson FE, Byers T. Dietary assessment resource manual. J Nutr. 1994;124(11 Suppl):2245-317. 20. Willett WC, Stampfer MJ, Manson JE, Colditz GA,
Speizer FE, Rosner BA, et al. Intake of trans fatty acids and risk of coronary heart disease among women. Lancet. 1993;341(8845):581-5. DOI:10.1016/0140-6736(93)90350-P
21. Willett WC. Nutrition epidemiology. 2.ed. New York: Oxford; 1998. DOI:10.1093/acprof:oso/97801951229 78.001.0001
22. World Health Organization. Physical status: the use and interpretation of anthropometry. Geneva; 1995. (WHO Technical Report Series, 854).
23. World Health Organization. Diet, nutrition and the prevention of chronic disease. Geneva; 2003. (WHO Technical Report Series, 916).
24. World Health Organization. Child Growth Standards. Growth Reference Data for 5-19 years. [cited 2009 Nov 1]. Available from: http://www.who.int/growthref/en/
REFERENCES