ABSTRACT
http://dx.doi.org/10.1590/1678-775720130529
Estimates of self-reported dietary behavior related
to oral health among adolescents according to
the type of food
Regiane Cristina do AMARAL1, Luiz Felipe SCABAR2, Betzabeth SLATER3, Paulo FRAZÃO4
1- Department of Social and Preventive Dentistry, School of Dentistry, State University of Campinas, Piracicaba, SP, Brazil. 2- Department of Public Health, School of Dentistry, University Paulista (UNIP), São Paulo, SP, Brazil.
3- Department of Nutrition, School of Public Health, University of São Paulo, São Paulo, SP, Brazil. 4- Department of Public Health, School of Public Health, University of São Paulo, São Paulo, SP, Brazil.
Corresponding address: Regiane Cristina do Amaral - Faculdade de Odontologia de Piracicaba - Universidade Estadual de Campinas - Av. Limeira, 901 - Piracicaba - SP - Brazil -13414-903 - Phone: (+55 19) 2106-5200 - e-mail: [email protected]
!
O
bjective: To compare estimates of food behavior related to oral health obtained through a self-report measure and 24 hour dietary recalls (R24h). Method: We applied three R24h and one self-report measure in 87 adolescents. The estimates for eleven food items items, the values reported by the adolescents were higher than the values estimated by R24h. The percentage of adolescents who reported intake frequency of 1 or more times/ day was higher than the value obtained through R24h for all food items except soft drinks. The highest values of crude agreement between the instruments, individually, were found !"#$ %&#$ ' * suggest that adolescents tend to report a degree of exposure to the food items larger than what they actually experience in their daily lives.Keywords: Questionnaires. Adolescent. Dietary sucrose.
INTRODUCTION
The assessment of food intake in children and adolescents is desirable for monitoring of their nutritional status17,and self-report measures of
known accuracy have been used on epidemiological research14,20,24. To evaluate the accuracy of these
instruments, we use standard methods, such as daily food intake, dietary history, duplicate diet, weighing food diet and 24-hour recalls (R24h). However none of them are considered of excellent performance to accurately determine what is ingested for all age groups10,21. Even in studies
based on a “gold standard” method as food weighing, there can be deviations in the estimation of some items1.
The R24h is among the most widely used instruments for assessing the accuracy of self-report measures. It is considered a fast and + 3
individual’s diet when applied repetitively4,18,24.
This repetitive evaluation is important because deviations can be found in the estimates produced by self-report measures.
Studies involving parents of children or adults showed that the estimates of food intake are considerably underestimated for the unhealthy foods and overestimated for the healthy ones1,11. Moreover, estimates for children and adolescents can be affected by the recall bias. They have problems in correlating the frequency of food intake and the time of ingestion, and sometimes they also tend to remember just the preferred foods12,17.
Children and adolescents frequently have 5 portion. This fact is often associated with cognitive constraints, a little explored subject in the literature3,17.
there is an increased ability to participate in evaluations such as diet recall without the help of parents. However, only evaluations of the past 24 hours are accurate17*
associating items of diet with time are reported as an information overload, since many times the child does not have a clear memory of past events. Thus, it is necessary to reconstruct the events by making inferences from what they usually ingest. This inference many times isn’t what the child ingested, but can portray a usual diet3. On the other hand, the period of adolescence
is characterized by intense changes of physical, psychological and social context, and cognitive ability and level of emotional maturity may be variable in this period13.
Most of the studies for validating food frequency questionnaires are concerned about investigating the nutritional composition of the diet and the intake amount of calories and nutrients (macro or micro). These elements are important in nutritional studies9,20,23,26<
estimating food behaviors, such as the frequency of carbohydrate intake with and without sugar, are scarce15. This frequency is the main etiologic factor
for dental caries6, a chronic disease considered a
serious public health problem28.
Thus the objective of this study was to compare estimates of food behavior related to oral health produced by a self-report measure and dietary recalls of 24 hours.
MATERIAL AND METHODS
A cross-sectional study was conducted among adolescents attending public schools in Piracicaba (0.7 ppm F in tap water), 157 km from the capital of São Paulo - Brazil, with an area of 1,377 km2
and a population of 364,571 people5. The study
was conducted from August through November 2011. The study was approved by the Research Ethics Committee of Public Health School - USP (protocol no. 2202).
The study population was selected from the representative sample of 483 adolescents that participated in the study “Determinant factors of the risk of obesity in adolescents from public schools of Piracicaba: cross-sectional study as a +> +?@GJ@ (São Paulo Research Foundation), process no. 2006/61085-0. A subsample was composed based on the six largest schools.
Measurement of food behavior
Nutritionists trained under the supervision of the Department of Nutrition from the Public Health School at the University of São Paulo applied three 24 hours dietary recalls (R24h). The dietary recalls
were administered at nonconsecutive days to cover a day in the weekend, setting up 15-day intervals between them. A self-applied instrument was answered at the end of the period. The self-report instrument had three questions for each one of the eleven food items. The questions were about food intake related to oral health, as well as frequency and the time of the day in which the food was ingested. Finally, we compared this instrument to the dietary recalls (R24h).
Instruments
The tools (self-report measure and R24h) were tested in a pilot study and adjusted accordingly * were administered by two dental surgeons and three trained nutritionists. The nutritionists used utensils such as cups, plates, and spoons to apply R24h29.
Food items
To examine the food behavior related to oral health in the past 15 days, the eleven investigated items were ice cream, fruits, chocolate, soft drinks, vegetables, juices with added sugar, biscuits $K and sweets (chewing gum, candy). These items were selected based on the results of a previous study on food intake conducted in Piracicaba-SP27,
using data related to the intake average obtained from two 24-hour recalls (R24h) applied in 93 adolescents. The food items were chosen taking into account the content of sucrose, the frequency of consumption and the number of adolescents who reported the food intake.
Data from food frequency were collected in six categories: 1 to 3 times in the last 15 days; 4 to 6 times in the last 15 days; 1 time a day; 2 times a day; 3 times a day; 4 or more times a day. Time of the day related to the food ingestion was registered according to three categories: at mealtime (breakfast, lunch or dinner), at another moment (mid-morning or mid-afternoon or evening before bedtime) or both. Items such as vegetables, greens and fruits were included based on questionnaires from WHO (2010) and CDC about diet, due to the importance these foods in relation to oral health-related behavior7,8.
Weight and height
The measures of body weight and height of the adolescents were performed using a digital scale with a capacity of 150 kg, sensitivity of 100 grams (Tanita, Solar Digital Scale HS 302, Tokyo, Japan), and a portable estadiometer (SECA Bodymeter 208, Hamburg, Germany). The volunteers were barefoot and wearing light clothing.
of the research site and the measurement used was the distance between the highest part of the head and the soles of the feet, in upright position. The volunteer was positioned so that the head was aligned with the Frankfurt plane (imaginary line from the external auditory canal until the lower orbit of the eye).
To weigh the volunteers, the scale was placed 3 * asked to look straight ahead while the weight was recorded by the researcher. Each measurement was made twice.
The researcher responsible for supervision was trained in the University of São Paulo. Correlation of the values was high (r=0.997).
Socioeconomic data
Socioeconomic data of the participants were obtained from a study conducted in 2007. Brazilian G'2 based on schooling level of
the household head and the presence of household goods and appliances in the house was used. The families were categorized in eight economic classes: A1, A2, B1, B2, C1, C2, D and E.
Data analysis
The data from R24h were converted into energy and nutrients by the software DietWin and the average consumption (kcal) was estimated. Moreover, they were separated in 11 food items: ice cream, fruits, chocolate, soft drink, greens, juices with added sugar, biscuits (with and $K
(chewing gum, candy) to allow the comparison with the issues of the self-report instrument. The data about the ingested item, intake frequency and the time of the food intake were checked in the R24h and the self-report measure. These data from both tools were entered into an Excel spreadsheet.
We performed the data checking to ensure their reliability, examining 20 chips randomly, and errors of data transcription were not found.
Chi-square and Student’s t test were used to compare the characteristics between the sub-sample and the reference population.
The correspondence between the responses + agreement and Kappa statistics when the response categories showed balance, and the difference between the highest and lowest value reached no more than 20% of the respondents. The responses on the intake frequency obtained through self-report instrument were grouped into three categories: “one or more times a day”; “up to 3 times over the past 15 days”; “4 to 6 times in the last 15 days”. We could thus have a better visualization of categories of frequency and could keep the category “one or more times a day” apart.
The Wilcoxon test was used to analyze the differences in average consumption estimated by R24h and the self-report measure. The chi-square of McNemar test was used to compare the differences in the percentage of respondents according to the category “one or more times a day” and the intake moment (only at mealtime or in another moment). Assuming type 1 error equal
Variables Sample
n (%)
Subsample n (%)
p
Gender male 218 (45.1) 34 (39.1) 0.3*
female 265 (54.9) 53 (60.9)
BMI (kg/m) up to 18.5 254 (52.6) 46 (52.9) 0.9*
18.6 to 24.9 181 (37.5) 33 (37.9)
>25.0 48 (9.9) 8 (9.2)
Sample Mean (sd)
Subsample Mean (sd)
p
Sweets (grams/day) 22.6 (21.1) 24.7 (20.5) 0.4**
Sugar (grams/day) 12.3 (16.0) 10.4 (14.3) 0.3**
Soft drinks (grams/day) 263.0 (258.7) 250.5 (267.2) 0.7**
Sweets (frequency/day) 0.5 (0.5) 0.6 (0.5) 0.4**
Sugar (frequency/day) 0.4(0.6) 0.4 (0.5) 0.3**
Soft drinks (frequency/day) 0.6 (0.6) 0.5 (0.6) 0.6**
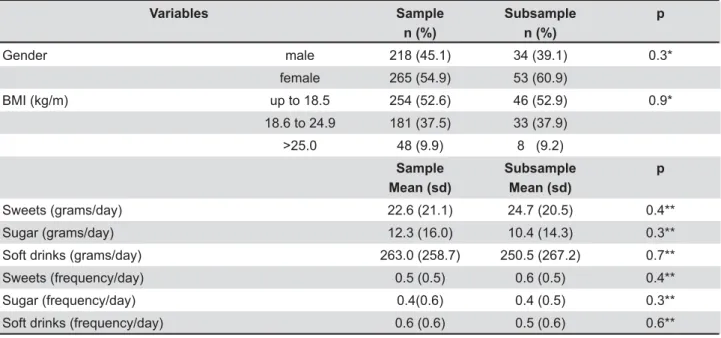
Notes: Data sample (2007) and subsample (2011) * Chi-square test. ** Student's t test
SD=standard deviation
to 5% and type 2 error equal to 20%, a sample of 85 or more participants would be needed to detect an effect size corresponding to 0.3 between the average daily intakes. The same sample size would be appropriated to detect a ratio between 1.8 and 2.2 between two proportions since the relative frequency of discordant pairs ranged from 0.5 to 0.9. The computer program SPSS 17.0 was used.
RESULTS
In this study, 87 of the 92 selected adolescents completed all phases of the research. Among these adolescents, 39.2% were male and the mean age was 13.4 years old (SD=0.7).
Regarding socioeconomic level, 4.6% were class A2, 24.1% were B1, 43.7% were B2, and 27.6% were C1. According to Table 1, there were + characteristics of the adolescents included in the study and the participants of the representative sample from the city. The samples did not differ statistically by gender, body mass index (BMI) and socioeconomic level.
The average energy intake in the 3 dietary recalls (R24h) in kcal was 2021.95 (±671.64), and the maximum and minimum values were respectively 4612.71 and 633.72. The volunteers had a mean weight of 54.67 kg, height of 1.60 m and BMI equal to 21.28 kg/m2; 21 were overweight
and 7 were considered obese according to the
WHO values.
The self-report instrument used was composed of 33 questions, 27 on the consumption of sweet products (containing sugar) interspersed with 6 items related to consumption of fruits, greens and vegetables.
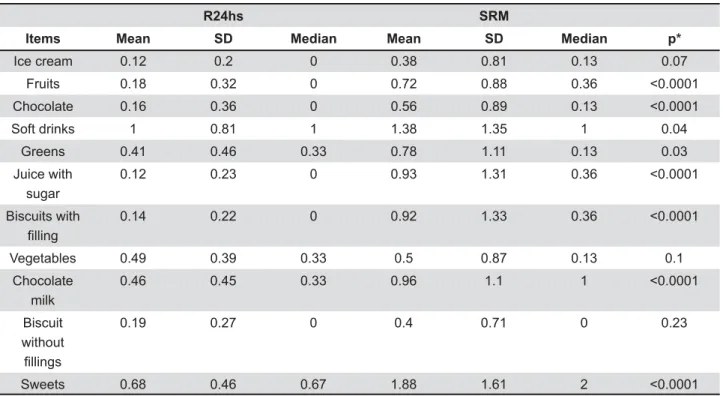
The mean values obtained through the self-report instrument were always higher than those +%&+ differences for most items (Wilcoxon p<0.05), except ice cream, vegetables and biscuits without *%$* +++ gender (data not shown).
The higher Spearman’s correlations were found for the items ice cream (rs=0.35, p=0.00), soft drink (rs=0.39, p=0.00) and chocolate milk (rs=0, 38, p=0.00), positioning them on the edge between a weak and moderate correlation. For fruits (rs=0.23, p=0.03), biscuits without ]^_! ]^_!$`+` (rs=0.25, p=0.02), the observed values showed a weak correlation. For other items, the values were lower than 0.20 and were not statistically
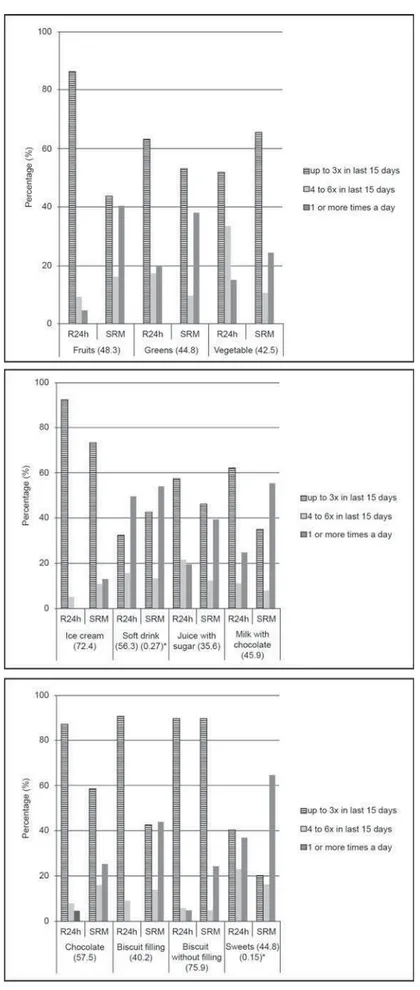
The percentage of adolescents who reported intake frequency “one or more times daily” was higher than the value obtained through R24h for all food items, except soft drinks (Table 3). Regarding the time of intake (only at the mealtime or at $+
R24hs SRM
Items Mean SD Median Mean SD Median p*
Ice cream 0.12 0.2 0 0.38 0.81 0.13 0.07
Fruits 0.18 0.32 0 0.72 0.88 0.36
Chocolate 0.16 0.36 0 0.56 0.89 0.13
Soft drinks 1 0.81 1 1.38 1.35 1 0.04
Greens 0.41 0.46 0.33 0.78 1.11 0.13 0.03
Juice with sugar
0.12 0.23 0 0.93 1.31 0.36
Biscuits with ¿OOLQJ
0.14 0.22 0 0.92 1.33 0.36
Vegetables 0.49 0.39 0.33 0.5 0.87 0.13 0.1
Chocolate milk
0.46 0.45 0.33 0.96 1.1 1
Biscuit without ¿OOLQJV
0.19 0.27 0 0.4 0.71 0 0.23
Sweets 0.68 0.46 0.67 1.88 1.61 2
Table 2- Mean, median, and standard deviation (SD) of daily intake (grams) assessed by three R24hs and a self-report measure (SRM), in 87 adolescents attending public schools in Piracicaba, Brazil, 2011
difference for the items greens, juice with added sugar, vegetables, chocolate milk, biscuits without +$ + K an overestimation of the intake in other times (Table 3).
At the individual level, the Kappa statistic was applied only for soft drinks (0.27) and sweets/ candy/gum (0.15), with level of agreement rated as “considerable” and “mild” consecutively.
Higher values of crude agreement between instruments, individually, were for the items biscuits without filling (75.9%), ice cream (72.4%), chocolate (57.5%) and soft drinks (56.3%) (Figure 1).
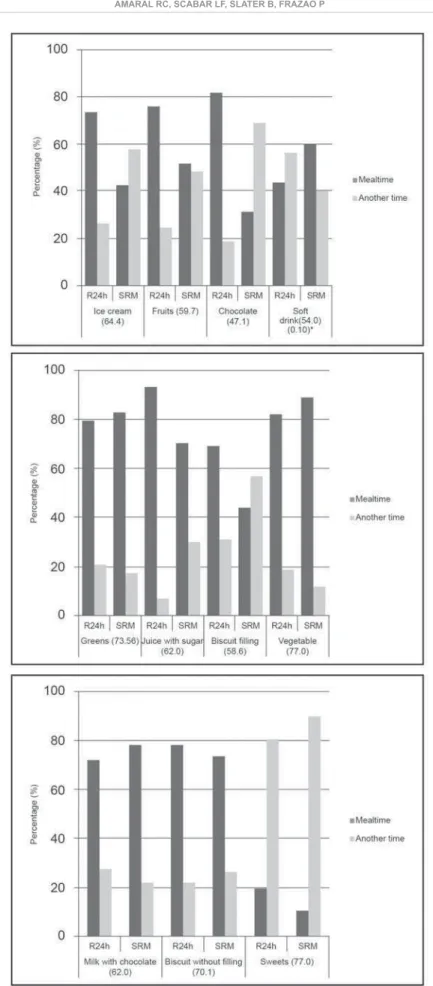
In relation to the time of sugary food intake, the R24h showed that soft drinks and sweets are consumed in other times besides the main meals, reaching 77.0% of agreement between the instruments (Figure 2).
The Kappa test was only possible to apply for the soft drink and the value was considered “mild” (0.10).
DISCUSSION
Sugars have an evidenced etiologic role in to tooth decay, not only by the amount of the sugar ingested, but mainly by the frequency of intake6. Thus, the instruments aiming to measure
this consumption are important to deepen understanding of the relationship between food behavior and dental caries in a context of multiple 3
Therefore, comparing estimates of dietary behavior related to oral health among adolescents produced by a self-report instrument and by 24-hour recalls is important to verify the reliability of these instruments. In the present study, this reliability showed high variation depending on the type of food investigated. We assessed the degree of crude agreement of responses, the average intake estimates, and the percentage distribution of participants according to the frequency of food intake in the last 15 days and the time of consumption.
The measurement of the degree of agreement between the values produced by both tools was made in relation to the categories of consumption frequency and time of intake (only at mealtime and at another moment). The results showed that the
Frequency per week and per day Time of the day
R24h SRM p R24h SRM p
up to 3 /15 days
4 a 6 /15 days
1 or +/ day
up to 3 /15 days
4 a 6 /15 days
1 or +/ day
MT AM MT AM
Ice cream 94.25 5.75 0 74.71 11.49 13.79 * 73.56 26.44 42.53 57.47
Fruits 86.21 9.2 4.6 43.68 16.09 40.23 75.86 24.14 51.72 48.28
Chocolate 87.36 8.05 4.6 58.62 16.09 25.29 81.61 18.39 31.03 68.97
Soft drinks 33.33 16.09 50.57 31.03 13.79 55.17 0.708 43.68 56.32 59.77 40.23 0.038
Greens 63.22 17.24 19.54 52.87 9.2 37.93 0.034 79.31 20.69 82.76 17.24 0.68
Juice with sugar
58.4 22 19.6 47.13 12.64 40.23 0.021 93.1 6.9 70.11 29.89 0.49
Biscuits with ¿OOLQJ
90.8 9.2 0 42.53 13.79 43.68 * 68.97 31.03 43.68 56.32
Vegetables 51.72 33.33 14.94 65.52 10.34 24.14 81.61 18.39 88.51 11.49 0.26
Chocolate milk
63.22 11.49 25.29 35.63 8.05 56.32 72.41 27.59 78.16 21.84 0.49
Biscuits ZLWKRXW¿OOLQJ
89.66 5.75 4.6 71.26 4.6 24.14 78.16 21.84 73.56 26.44 0.56
Sweets 40.23 22.99 36.78 19.54 16.09 64.37 19.54 80.46 10.34 89.66 0.11
Table 3- Percentage of adolescents according to their intake frequency over the past 15 days and time of the day of intake, both assessed by R24hs and self-report measure (SRM). Piracicaba, Brazil, 2011
Figure 1- Percentage of agreement (%) related to the responses obtained through the R24h and by the self-report measure (SRM) according to the intake frequency and type of food, Piracicaba, 2011, Brazil
Figure 2- Percentage of responses of crude agreement (%) and Kappa test comparing the R24h and the self - report measure (SRM), according to the time of the day and type of food ingested, Piracicaba, 2011, Brazil
agreement varies according to the type of food. Values of crude agreement equal or higher than 70% regarding the time of ingestion were observed for four food items. In relation to the intake frequency, this agreement level was noticed only for two items, which may indicate that adolescents have more readiness to describe the moment of food intake than its frequency in the last 15 days.
The degree of correlation between the average daily intakes was estimated as weak for the most studied foods. Only items as ice cream (rs=0.35, p=0.00), soft drink (rs=0.39, p=0.00) and chocolate milk (rs=0.38, p=0.00) presented weak to moderate correlation suggesting that the deviations are not homogeneous or subject to a linear correction.
The proportion of adolescents who reported intake frequency “one or more times daily” for a particular food was higher than the estimate obtained by reference measure for all items, except for the soft drink, which displayed equivalent consumption. The implication is that the estimates provided by the self-report measure should be used with caution.
According to the reference method, the percentage of adolescents who reported intake frequency “one or more times a day” for fruits, greens and vegetables was always lower than the value estimated by self-report measure. The same was observed for sugary foods. The results suggest that adolescents, before a self-report instrument, tend to report a degree of exposure to the food items larger than actually experience in their daily lives.
Regarding the moment of ingestion, no tendency for overestimating was clearly noted. Among six of the eleven items, the estimates produced by the + items whose estimates differed, it was observed that the most frequent category changed from mealtime to other times outside the main meal. This occurred for the items ice cream, fruits, K may suggest that in the face to face interview, a feature of reference method, adolescents tend to underestimate the consumption of these products outside the period of the mealtime. In this case, the self-report measure might be a useful tool considering that different behaviors in relation to the expected standard are less reported in a face to face interview.
Deviations in the estimation of food behavior are highlighted by several researchers. Some of them have argued that teenagers tend to remember only the preferred foods and do not possess the time dimension completely formed12,17,20.
There is a reasonable increase from individuals 7-8 years to 12 years of age in the ability of
children to participate in dietary recalls, but only for the food consumed in the immediate past, corresponding to the last 24 hours.
Parental involvement may be important to provide details about the types and amounts of food consumed, as children have not completed their cognitive development. However, the help of assessing the diet of the children, particularly if the study is concerned about evaluating what is consumed between main meals, in the period when the kids are at school or in other places out of their parents’ sight.
| associated with patterns of irregular diet, including eating out of the house, and concern with self-image can contribute to a greater or lesser lack of accuracy in reporting habitual diet17. In recent
years, changes have been observed in the social context of eating with a shift from a pattern based on family meal to a pattern based on more irregular and solitary eating. This not only increases the frequency of consumption but also confuses the function of the foods. Items that traditionally were part of the main meal and did not pose a risk to the oral health have become a threat, as the introduction of the snacks in other moments during the day25.
Some authors have emphasized that adolescents do not have cognitive maturity for decision-K *+ 3 + are still being formed in the adolescence19,22. Thus,
to ask for a teen to answer an instrument that assesses food consumption in the last 15 days may require a mental and cognitive effort beyond his/her ability, leading to errors in the estimation of food consumption3.
most frequently consumed. Nevertheless, for two items investigated by the reference method, none was consumed by adolescents at least once a day.
In spite of indicators related to group analysis have showed better application when compared to individual analysis indicators since the Kappa test could not be applied to all food groups, from a clinical point of view, the results suggest that the utilization of self-report instrument can lead to an overestimation of individual exposure compared to R24h.
To minimize recall bias, one might make use of food weighing as the “gold standard”. However, this method can also underestimate the daily intake among adolescents16. The present study
used kitchen utensils, glasses and cups to help the adolescents remember the consumed amount in the previous day, making sure to apply the 24-hour recall at least one day after the weekend, since the diet might vary in this period. Both instruments were applied individually. In the case of the R24h, the method was applied by trained nutritionists. To apply the self-report instrument, the adolescents were divided in small groups, distant from each other in individual portfolio, always with the presence of the researcher responsible to aid in case of any doubt.
CONCLUSION
There was considerable variability in the degree of concordance between the instruments, at the individual level, depending on the type of food. The response of the adolescents led to an overestimating of daily intake for 8 out of 11 food items measured by the self-report instrument. The percentage of adolescents that reported the intake frequency “one or more time daily” was higher than the estimate obtained through R24h for all food items, excepting soft drinks. Estimates of food behavior reported by adolescents should be considered with caution. Further studies are needed to develop a self-report measure particularly for items in which there was an overestimation.
ACKNOWLEDGMENTS
The authors thank Mr. Oldack Chaves, director of education in Piracicaba and all directors of the schools that participated in the survey, for the kind collaboration in this study. The study was supported by FAPESP (São Paulo Research Foundation), processes no. 2010/19599-1 and 2010/19857-0.
REFERENCES
1- Andersen LF, Lande B, Trygg K, Hay G. Validation of a semi-quantitative food-frequency questionnaire used among 2-year-old Norwegian children. Public Health Nutr. 2004;7(6):757-64. 2- Associação Brasileira de Empresas de Pesquisa. Critério Classificação Econômica Brasil. 2013 Jan [cited 2013 Mar 14]. Available from: http://www.abep.org/novo/Content. aspx?ContentID=301.
3- Baranowski T, Domel SB. A cognitive model of children's reporting of food intake. Am J Clin Nutr.1994;59(1):212S-217S. 4- Block G. A review of validations of dietary assessment methods. Am J Epidemiol. 1982;115(4):492-505.
5- Brasil. Ministério do Planejamento. Instituto Brasileiro de G| G%^_^J%^_%_% Available from: http://www.ibge.gov.br.
6- Burt BA, Pai S. Sugar consumption and caries risk: a systematic review. J Dent Educ. 2001;65(10):1017-23. 7- Center for Disease Control and Prevention. Global School-based Student Health Survey (GSHS). 2010 Set [cited 2012 Feb 12]. Available from: http://www.cdc.gov/gshs.
8- Center for Disease Control and Prevention. Nutrition for Everyone. 2010 Set [cited 2012 Feb 12]. Available from: http:// www.cdc.gov/nutrition/everyone/fruitsvegetables/index.html. 9- Dehghan M, del Cerro S, Zhang X, Cuneo JM, Linetzky B, Diaz R, et al. Validation of a semi-quantitative Food Frequency Questionnaire for Argentinean adults. PLoS One. 2012;7(5):e37958.
10- Domel SB. Self-reports of diet: how children remember what they have eaten. Am J Clin Nutr. 1997;65(4):1148S-1152S. 11- Esfahani FH, Asghari G, Mirmiran P, Azizi F. Reproducibility and relative validity of food group intake in a food frequency questionnaire developed for the Tehran Lipid and Glucose Study. J Epidemiol. 2010;20(2):150-8.
12- Goran MI. Measurement issues related to studies of childhood obesity: assessment of body composition, body fat distribution, physical activity, and food intake. Pediatrics. 1998;101(3):505-18.
13- Hargreaves DS. Revised You're Welcome criteria and future developments in adolescent healthcare. J Clin Res Pediatr Endocrinol. 2011;3(2):43-50.
14- Huybrechts I, De Bacquer D, Matthys C, De Backer G, De Henauw S. Validity and reproducibility of a semi-quantitative food-frequency questionnaire for estimating calcium intake in Belgian preschool children. Br J Nutr. 2006;95(4):802-16. 15- Kiwanuka SN, Astrøm AN, Trovik TA. Sugar snack consumption in Ugandan schoolchildren: validity and reliability of a food frequency questionnaire. Community Dent Oral Epidemiol. 2006;34(5):372-80.
16- Kobayashi T, Kamimura M, Imai S, Toji C, Okamoto N, Fukui M, et al. Reproducibility and validity of the food frequency questionnaire for estimating habitual dietary intake in children and adolescents. Nutr J. 2011;24:10-27.
17- Livingstone MB, Robson PJ, Wallace JMW. Issues in dietary intake assessment of children and adolescents. Br J Nutr. 2004;92:213-22.
18- Lopes AC, Caiaffa WT, Mingoti SA, Lima-Costa MF. Food intake in epidemiological studies. Rev Bras Epidemiol. 2003;6(3):209-19.
19- Luciana M, Collins PF. Incentive motivation, cognitive control, and the adolescent brain: is it time for a paradigm shift? Child Dev Perspect. 2012;6(4):392-9.
20- Matos SM, Prado MS, Santos CA, D'Innocenzo S, Assis AM, Dourado LS, et al. Validation of a food frequency questionnaire for children and adolescents aged 4 to 11 years living in Salvador, Bahia. Nutr Hosp. 2012;27(4):1114-9.
22- Peters JC, Vlamings P, Kemner C. Neural processing of high and low spatial frequency information in faces changes across development: qualitative changes in face processing during adolescence. Eur J Neurosci. 2013;37(9):1448-57.
23- Slater B, Philippi ST, Fisberg RM, Latorre MR. Validation of a semi-quantitative adolescent food frequency questionnaire applied at a public school in São Paulo, Brazil. Eur J Clin Nutr. 2003;57(5):629-35.
24- Slater B, Philippi ST, Marchioni DM, Fisberg RM. Validation of Food Frequency Questionnaires - FFQ: methodological considerations. Rev Bras Epidemiol. 2003;6(3):200-8.
25- Van Loveren C, Duggal MS. Experts' opinions on the role of diet in caries prevention. Caries Res. 2004;38(Suppl 1):16-23.
26- Vereecken C, Covents M, Maes L. Comparison of a food frequency questionnaire with an online dietary assessment tool for assessing preschool children's dietary intake. J Hum Nutr Diet. 2010;23(5):502-10.
27- Voci SM, Enes CC, Slater B. Validation of a Food Frequency Questionnaire by food groups for the adolescent population. Rev Bras Epidemiol. 2008;11(4):561-72.
28- World Health Organization. Equity, social determinants and public health programmes. 2012 Apr [cited 2012 A u g 8 ] . Av a i l a b l e f r o m : h t t p : / / w h q l i b d o c . w h o . i n t / publications/2010/9789241563970_eng.pdf.