SRef-ID: 1432-0576/ag/2005-23-393 © European Geosciences Union 2005
Annales
Geophysicae
Three-dimensional tracking of mid-latitude quasi-periodic E-region
echoes observed with the Chung-Li VHF radar
C. L. Chen1, C. J. Pan1, J. R¨ottger1, and V. K. Anandan*
1Institute of Space Science, National Central University, Chung-Li, 32054, Taiwan *On leave from National MST Radar Facility, Gadanki, India
Received: 13 December 2003 – Revised: 24 October 2004 – Accepted: 31 October 2004 – Published: 28 February 2005
Abstract. This paper presents observations of low-altitude mid-latitude E-region irregularities obtained with the 52-MHz Chung-Li VHF radar. These are carried out in the in-terferometer mode to investigate the behavior of these irregu-larities over time and space. The observations presented here show the characteristics of type-II echoes noted by a nega-tive slope, i.e. they are approaching the radar as a function of time. The range-time-intensity (RTI) plots obtained through power spectrum analysis reveal the quasi-periodic striations, which are known as LQP (Low-altitude QP) echoes. Our interferometer analysis allows one to investigate the motion (i.e. “tracking”) of the LQP echo patches in three dimen-sions. This method is superior to just evaluating the varia-tions of the echo power as a function of range and time in the standard RTI-plots. By applying this method, we show that the echo patches in different striations remain at almost the same altitude when we trace the isolated echoing regions until they disappear from the radar view. We further com-pare the rate of change of the range (range rate dR/dt) by two techniques: one by simply measuring the varying slope of the LQP echoes from RTI plot, the other by tracking the three-dimensional locations of the LQP scatterers by using the in-terferometer technique. We finally prove that the changes in range as a function of time, deduced from the interferometer technique, are significantly correlated with those of the stan-dard range rate analysis. However, the stanstan-dard range rate analysis does not provide information about the correct loca-tion and the varialoca-tion of the LQP irregularities. The three-dimensional analysis, which we introduced for tracking indi-vidual striations, shows that LQP echo patches are confined to between 98 and 100 km altitude. This suggests that the ir-regularities which cause the LQP echoes drifted through the radar beam at approximately constant altitude, which we tend to attribute to a region of large-scale vertical shear of the hor-izontal wind.
Key words. Ionosphere (Ionospheric irregularities) – Radio science (Remote sensing; Ionospheric physics; Instruments and techniques)
Correspondence to:C. J. Pan ([email protected])
1 Introduction
Interferometer techniques have been extensively used for the study of ionosphere and atmosphere dynamics. Since Far-ley et al. (1981) introduced this technique for the study of equatorial electrojet irregularities with the Jicamarca radar, it has been implemented at various VHF radars, such as the MU radar (Yamamoto et al., 1994), the Chung-Li VHF radar (Pan et al., 1994), for instance. The multiple baseline in-terferometer technique helps to reveal the spatial and tem-poral characteristics of the scatterers, thereby imaging the motion/tracking of scatterers in the three-dimensional plane (Hysell and Burcham, 2000; Yamamoto et al., 1994; Wang and Chu, 2001). We apply this technique in this paper, as well, and can show that the additional information on the height of the scattering irregularities, creating the LQP echoes, can only be obtained by this more elaborate tech-nique and yields further information about the larger scale behavior of these irregularities. In this paper we are not dis-cussing the scattering mechanism of the irregularities which leads to the LQP echoes. We notice, though, that they are obviously characterized by a high coherence which is con-sistent with high aspect sensitivity.
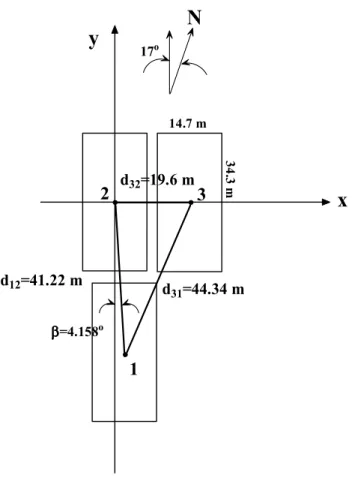
d
31=44.34 m
d
32=19.6 m
d
12=41.22 m
β β β β=4.158o
1
2
3
x
y
N
17o
14.7 m
34
.3
m
Fig. 1. Geometry of Chung-Li VHF radar antenna array used for interferometer observation. The origin is at the phase center of
antenna array 2. The y-axis points toward 17◦west of geocentric
north. The phase center of antennas 2 and 3 determine the x-axis, and the z-axis points into the zenith direction.
This theory also failed to explain the observations of mul-tiple striations within the QP echoes (Tsunoda et al., 1999) and their semidiurnal behavior (Pan and Tsunoda, 1999). Re-cently, Larsen (2000) proposed that neutral wind shear insta-bility can explain the spatial and temporal periodicities as-sociated with QP echoes. It depends on large vertical wind shear of the horizontal wind. Large wind shear at the thresh-old of instability is frequently observed in connection with QP echoes. Due to the high collision frequency in this al-titude around 100 km, the wind profile reflects itself in the plasma density profile. This then has some kind of similar shear as the neutral wind profile and can give rise to plasma instabilities. This can also explain that the observed plasma striations are assumed to drift with the horizontal wind. Pe-riodicities can be generated by superimposed gravity waves. Haldoupis et al. (2001) studied QP echoes in the zonal di-rection using azimuth-time-intensity (ATI) analysis. They suggest that these typical striations in mid-latitude E-region backscatter are due to the motion of unstable plasma struc-tures, most likely sporadic-E patches, which drift along with the neutral wind, that have zonal scale lengths of several tens of kilometers, much larger than the size predicted by Larsen’s theory. The simulations made by Bernhardt (2002) confirm
this as well. More recently, Hysell et al. (2002) used an in-beam radar imaging technique, and applied both refraction and finite aspect angle sensitivity to prove that striations in range-time-intensity (RTI) maps of QP echoes are the signa-tures of migrations of a spatially localized, elongated scat-tering region inside a sparsely filled radar volume. Similar observations and conclusions have also been made by Hal-doupis et al. (2003). QP echoes are observed simply to be due to sequential unstable plasma patches or blobs which traverse across the radar field-of-view, sometimes in a wave-like fash-ion. Also, the three-dimensional observations on 30 MHz (Hysell and Burcham, 2000) show that the QP echoes can be recognized as quasi-point target scatterers drifting through the radar beam at approximately constant altitude.
Recently, a striking finding was reported by Rao et al. (2000) by carrying out multi-beam high resolution MU radar observations, Urbina et al. (2000) by simultaneously operating a 50-MHz radar interferometer at Camp Santiago and the Arecibo incoherent scatter radar. Later, the find-ing was also reported by Pan and Rao (2002) and Patra et al. (2002) by operating at 53 MHz the MST radar located at Gadanki. The new finding of these experiments was that the radar backscatter from lower altitudes (<100 km) also dis-plays quasi-period features. To differentiate these echoes which have a different appearance at lower altitudes from QP echoes of the kind reported by Yamamoto et al. (1991), low altitude QP (LQP) were adopted for this new class of echoes. This paper presents interferometry observations carried out using the 52-MHz Chung-Li VHF radar to improve our understanding of the characteristics and behavior of these newly detected low altitude QP echoes, called LQP echoes. We show that the echo patches in different striations remain at almost the same altitude between 98 and 100 km when we trace the isolated echoing regions until they disappear from the radar view. Then we show that the range varia-tions with time (range rates) along different striavaria-tions, ob-tained by two techniques: one by measuring the slope of the LQP echoes from RTI plots, and the other by determining the 3-dimensional locations of the same striations with respect to time by interferometer measurements, are well correlated. In Sect. 2 we describe the observation and the analysis of the experiment. Results and discussion are presented in Sect. 3 and conclusions are drawn in Sect. 4.
2 Observations and analysis
The Chung-Li VHF radar (geographic latitude 24.9◦N, 121◦E) is a mono-static pulsed Doppler radar operating on 52-MHz. The radar consists of three identical antenna, trans-mitter and receiver modules, which are coherently phase-synchronized. The geometry of the antenna system used for the interferometry observation is shown in Fig. 1. A further system description of this interferometer mode can be ob-tained from Pan et al. (1994).
-200 -100 0 100 200 0
0.5 0.8 1
Array 1&2
cohe
re
nc
e
-200 -100 0 100 200 Array 2&3
-200 -100 0 100 200 Array 3&1
-200 -100 0 100 200 -180
-90 0 90 180
(m/s)
ph
as
e(
d
eg
)
-200 -100 0 100 200
(m/s)
-200 -100 0 100 200
(m/s) -200 -100 0 100 200
70 80 90
Array 1
Po
w
er
(d
B
)
-200 -100 0 100 200 Array 2
-200 -100 0 100 200 Array 3 Range = 130.2 km LT = 18:28:20
(a)
(b)
(c)
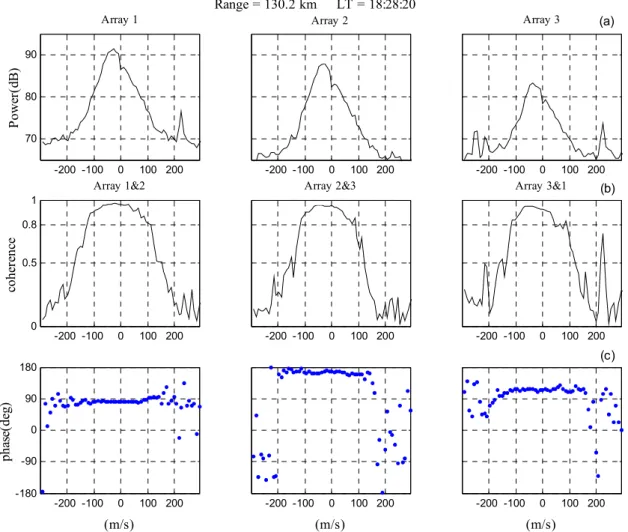
Fig. 2.(a)A sample power spectrum of backscatter signals from Esirregularities received by three antenna arrays observed on 3 July 2000.
(b)Coherence and(c)Phase obtained through cross-spectral analysis for array pairs of 1–2, 2–3, and 3–1 are shown from the left panel to
the right panel, respectively.
were done with 4µs pulse length (600 m range resolution), an interpulse period of 1200µs, coherent integrations over four interpulse periods and with a range observation win-dow of 120 km to 144 km. A 64-point Fast Fourier Trans-form (FFT) was used to compute the complex Doppler spec-tra of the echoes for each range gate of each of the three individual receiving antenna channels. To obtain the range-time-intensity (RTI) map the complex normalized cross spec-trum is computed, is ensemble and averaged over 50 times (around 20 s) to obtain the power, coherence and phase. We note that pronounced QP echoes were observed during 18:00 to 20:30 LT on 3 July. We later show with the interferom-eter method, that these are actually LQP echoes; we note that this feature (namely, LQP) cannot be determined with the standard RTI technique. Figure 2 shows such typical power spectra of echoes observed in the period at the range of 130.2 km around 18:28 LT. Although pronounced LQP echoes appeared during 18:00 to 20:30 LT, only data with high signal-to-noise ratio from about 18:20 to 18:33 are pre-sented. From the signal power deduced from the spectra we obtain the range-time-intensity diagram shown in Fig. 3.
From the complex Doppler spectra the coherence and the phase as a function of Doppler frequency was calculated for the combinations of the three channels. In order to assure an acceptable significance of the coherence and its phase, a careful noise subtraction of the spectra has been done. A typical case of these spectra is shown in Fig. 2. Following the standard procedure introduced by Farley et al. (1981), these parameters allow for the deduction of the angular spread and the location of the echo targets. The first set of data in Fig. 2 shows typical power with non-zero Doppler shift. The high coherence observed over the total frequency range, where the signal power exceeds a proper limit, supports earlier findings on QP echoes, that the irregularities of these LQP echoes are highly aspect sensitive. Since they are also fairly localized in range, it implies that the signals come, as usual in such cases, from a localized echoing region. If there would not be an aspect sensitivity, we would expect echoes which are not confined to limited ranges but rather spread out.
Time (LT)
Ran
g
e (
k
m)
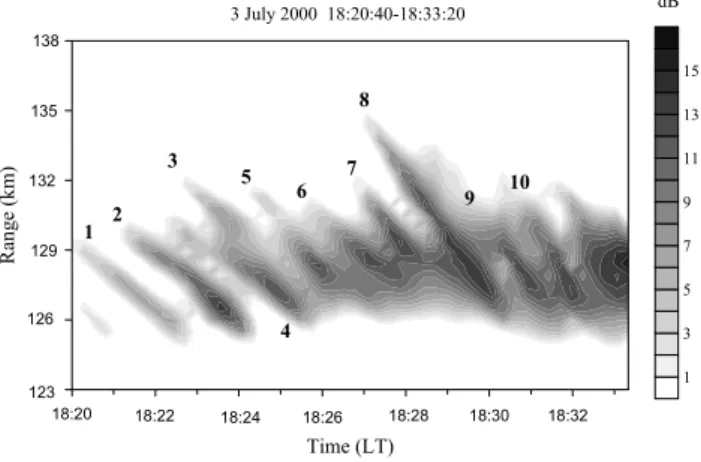
1 3 5 7 9 11 13 15 3 July 2000 18:20:40-18:33:20 dB
1 2 3
4 5
6 7
8
9 10
123 126 129 132 135 138
18:20 18:22 18:24 18:26 18:28 18:30 18:32
Fig. 3. Range-time-intensity plot of QP echoes observed with the Chung-Li VHF radar between 18:20 to 18:33 LT on 3 July 2000.
do not observe. These observations were typical in our ex-periment, which means that we can consider the echoes as being from an isolated echoing region in the radar volume.
In order to trace the variation of the location of the echoes, we introduce the following coordinate system: The local zenith direction is the coordinate z with the origin at the phase center of antenna array 2. Since the antenna beam is pointed in a direction 17◦west of north in azimuth and 49◦ in elevation, such that it is perpendicular to the field line at the height of 250 km. However, calculation shows that the elevation angle perpendicular to the field line at the height of 105 km from the Chung-Li radar site is about 51.5◦. We defined the y-axis as pointing toward 17◦west of geocentric north, x is the axis orthogonal to the y and z coordinates. From the mean phases of the cross spectra (lower panels of Fig. 2) we deduce the azimuth and elevation of the backscat-ter locations in each range gate. We have chosen the coher-ence limit of 0.8, since here the phase values are very stable and not distorted by noise (see Fig. 2). In order to obtain an reliable arrival angle of the QP echo patches, the phase dif-ferences computed from the complex normalized cross spec-trum of the echoes for antenna pairs 1–2, 2–3 and 3–1 with coherence exceeding 0.8 were used. From the phase differ-ences1φ12(ω)and1φ23(ω)for antenna pairs 1–2, 2–3, the
elevation angleθ (ω) and azimuth angleφ (ω)of target can be derived as follows (Wang and Chu, 2001):
φ (ω)=tan−1
tanβ+ d12
d23cosβ
1φ
23(ω)+2π m+1923
1φ12(ω)+2π n+1912
−β, (1)
θ (ω)=cos−1
1φ
23(ω)+2π m+1923
kd23sinφ
, (2)
where k=2π/λis the radar wave number,λis the radar wave length, m and n are the interferometry lobe numbers in az-imuth and vertical directions, respectively, resulting from grating lobes of this interferometer setup. 1ψ12 and1ψ23
Table 1.Mean projection velocities (m/s) in the x, y and z directions of the striations in Fig. 3.
striation dx/dt dy/dt dz/dt
1 15 −27 −10
2 8 −29 −11
3 18 −11 −10
4 8 −44 −4
5 60 −37 −1
6 77 −38 0
7 122 −44 −1
8 68 −23 −7
9 127 −70 6
10 152 −72 1
represent the system phase biases for antenna pairs 1–2 and 2–3, respectively, andβis the angular deviation between an-tenna pairs from the right angle triangle, as shown in Fig. 1. To determine the values of m and n, the angular range in which all-possible Es echoes may appear has to be con-sidered. Using the IGRF-2000 model these angular ranges were estimated. The values n=4, m=0,−1,1ψ12=295◦and
1ψ23=5◦in Wang and Chu (2001) are used for our
estima-tion. Using Eqs. (1) and (2), the coordinates of the target in different gateRis obtained from
x(ω)=Rcosθ (ω)sinφ (ω), y(ω)
=Rcosθ (ω)cosφ (ω)andz(ω)=Rsinθ (ω). (3) When we trace the striations in the RTI plot and compared the related gate and time with the data obtained by interfer-ometry, we obtain the positions of LQP echo patches in dif-ferent striations, respectively. To obtain the mean velocity projections in the x, y and z directions of the striations, we need the mean locations of the scattering patches in every gate. We have averaged the x, y and z obtained from Eq. (3) for all Doppler frequencies with coherence larger than 0.8, respectively. The mean projection velocities in the x, y and z directions of different striations are shown in Table 1.
3 Results and discussion
As the RTI plot in Fig. 3 shows, there are multiple echo traces which comprise QP echoes with up to four striations being visible at the same time (around 18:27 LT). There are reports on the simultaneous presence of multiple of QP echoes with up to 8 to 9 striations (Tsunoda et al., 1999; Hysell and Bur-cham, 2000). From our observations it is apparent that the echo patches inside the striations were varying with time and have negative slope, which means that they propagated to-wards the radar.
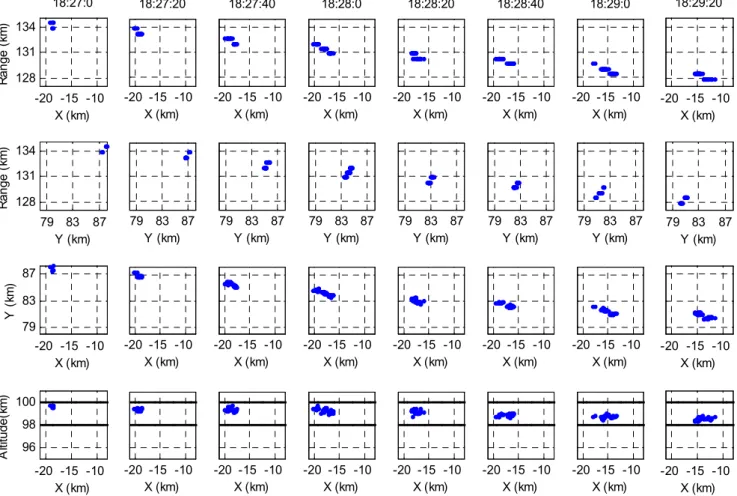
-20 -15 -10 128
131 134
18:27:0
X (km)
R
a
ng
e (
km
)
79 83 87
128 131 134
Y (km)
R
a
ng
e (
km
)
-20 -15 -10 79
83 87
X (km)
Y (
km
)
-20 -15 -10 96
98 100
X (km)
A
lti
tu
d
e
(k
m
)
-20 -15 -10 18:27:20
X (km)
79 83 87
Y (km)
-20 -15 -10 X (km)
-20 -15 -10 X (km)
-20 -15 -10 18:27:40
X (km)
79 83 87
Y (km)
-20 -15 -10 X (km)
-20 -15 -10 X (km)
-20 -15 -10 18:28:0
X (km)
79 83 87
Y (km)
-20 -15 -10 X (km)
-20 -15 -10 X (km)
-20 -15 -10 18:28:20
X (km)
79 83 87
Y (km)
-20 -15 -10 X (km)
-20 -15 -10 X (km)
-20 -15 -10 18:28:40
X (km)
79 83 87
Y (km)
-20 -15 -10 X (km)
-20 -15 -10 X (km)
-20 -15 -10 18:29:0
X (km)
79 83 87
Y (km)
-20 -15 -10 X (km)
-20 -15 -10 X (km)
-20 -15 -10 18:29:20
X (km)
79 83 87
Y (km)
-20 -15 -10 X (km)
-20 -15 -10 X (km)
Fig. 4.Series of three-dimensional distribution of the striation number 8 (Fig. 3) of the QP echoes, observed by the interferometry technique. The data start at 18:27:00 and end at 18:29:20 LT on 3 July 2000. The first two panels display the range vs. the x- and y- axes, respectively. The third panels display the motion projected in the x–y plane. The bottom panel shows the altitude vs. the x-axis.
three-dimensional location of the backscatter in each range gate and the time history about the spatial variation of the LQP echoes as well.
The combination of the three-dimensional variations of the isolated echoing region along with RTI plots and velocity measurements is important to infer the dynamics of theEs irregularities causing the LQP echoes. It is interesting to in-vestigate whether these irregularities are being created in-situ (i.e. by movement of an instable background), or exist and are advected with the background (i.e. move into the radar observing volume). This is not an unambiguous task, but our observations and interpretations seem to provide a tool for this purpose.
Figure 4 presents a representative example of the motion of the eighth striation patch (see Fig. 3 for numbering). When we trace the eighth striation in the RTI plot and compared the corresponding gate and time with the data obtained by inter-ferometry, we obtain the positions of patches obtained from Eq. (3) and displayed for all Doppler frequencies with coher-ences of more than 0.8. The first two panels display the range vs. the x- and y- axes, respectively. The third panel displays the motion projected in the x-y plane. The bottom panel shows the altitude vs. the x-axis. The time increases from
the left column to the right column. Its range distribution is from 134 km down to 126 km, which is an extent of about 8 to 9 km. Comparing the data obtained by interferometry with the IGRF 2000 model, we find the corresponding angular range with respect to the Earth’s magnetic field producing the LQP echoes mainly within±0.5◦and no more than±1◦off the perpendicularity direction to the Earth’s magnetic field. When we traced the striation 8, the echo patches drift into the radar volume and disappear from the radar view; mean-while, the aspect angular range shifts from negative (about
18:20 18:22 18:24 18:26 18:28 18:30 18:32 Time ( LT )
96 98 100
A
lt
it
u
d
e(
k
m)
3 July 2000 18:20:40-18:33:20
10101010
Fig. 5. Averaged altitude variations of ten striations during their existence in the radar volume on 3 July 2000.
North(Y) East(X)
A
lt
it
ude
t1 t2 t3 t4
∆ ∆ ∆ ∆y
∆ ∆ ∆ ∆x Time
t1 t2 t3 t4
Ra
n
g
e
(a) (b)
Fig. 6.(a)A sketch of an ideal striation in the range time plot.(b)
Simple geometry of an ideal striation by tracing an isolated echo-ing region with a constant velocity at a fixed altitude, which would result in the range–time variation in (a).
Similar characteristics are observed in all striations of our LQP echoes, which we detected. In order to show more clearly the altitude behavior of the LQP echoes, ten stria-tions were plotted together in Fig. 5. From Fig. 5, it seems to indicate that the irregularities drift into the radar volume and they stay in the same altitude between 98 km and 100 km before 18:40 LT. After this period, they stay in the altitude between 95 km and 98 km until they disappear from the radar view. Around 18:27 LT, there are four striations coexisting in different range gates in the RTI plot (Fig. 3). But Fig. 5 reveals that they stay at almost the same altitude. Let us pre-sume that it is most unlikely that they were associated with different sporadic-E layer. Similar to the projection in the x-y plane of the striation 8 in Fig. 4, we find that thex-y simplx-y change their locations only in the x–y plane, i.e. they move horizontally.
From the results described above we propose an interpre-tation of the striations of these LQP echoes, as they presum-ably can be characterized as isolated echoing regions, which drift at constant altitude and with fairly constant horizontal velocity through the radar observing volume. Figure 6a dia-grams a drifting echo patch (single striation) as it is viewed in the backscattered radar signal. Figure 6b shows the three-dimensional view of the echo patches as a function of time.
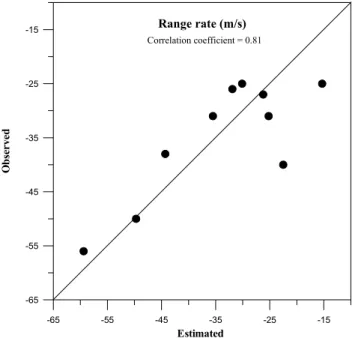
Based on these observations, a numerical simulation is suggested for obtaining the range rate (i.e. the change of range as a function of time deduced from the RTI plot) of
-65 -55 -45 -35 -25 -15
Estimated -65
-55 -45 -35 -25 -15
O
b
se
rv
ed
Range rate (m/s) Correlation coefficient = 0.81
g
Fig. 7.Correlation of the range rates dR/dt obtained by two observ-ing methods. The ordinate displays the range rate deduced from the RTI plot (Fig. 3), and the abscissa displays the range rate estimated from Eq. (4) by the interferometry technique.
the echoes when they drift into the radar volume. Take the coordinates of the target as P (x, y, z), which moves with velocity
U=
dx
dt, dy dt,
dz dt
at the rangeR= q
x2+y2+z2,
wherex=R cosθ sinφ, y=R cosθcosφand z=R sinθ,θand
φare elevation and azimuth angles, respectively. Then we obtain the range rate,
dR
dt =cosθsinφ dx
dt +cosθcosφ dy dt +sinθ
dz
dt, (4)
where dx/dt,dy/dtanddz/dtare the velocity projections of the target in the x, y and z direction, respectively. The mean velocity projections in the x, y and z directions of the stria-tions are used for ourdx/dt, dy/dtanddz/dt, respectively. Us-ing Eqs. (1) and (2), we find that the elevation and azimuth of the targets lay between 48◦≤θ≤53◦,−15◦≤φ≤ 5◦, re-spectively. By finding θ (ω) andφ (ω) for individual echo patches and mean velocity projections in the x, y and z di-rections of the striation, the range rate is estimated and aver-aged, respectively. In order to qualify this estimate, deduced from the interferometer measurements, we compared these results with the observed range rate, which is obtained from the slope of the striations in RTI plot. Figure 7 presents the corresponding correlation of the range rate deduced directly from the RTI and the one deduced from the interferometer measurements.
rates obtained from RTI plot are between 0.8 and 1.2, except for striations 3 and 8, with about 0.6. This result suggests that the magnitudes of the range rates obtained from inter-ferometry method are close to those which we obtained from the RTI plot. The correlation coefficient up to 0.8 ensures that our conclusion has a good statistical significance.
In general, it is widely reported that QP echoes occur at higher altitudes (>100 km) than we observed here. Recently, the radar backscatter from low altitudes where the “contin-uous” echoes usually appear also displayed quasi-periodic features. To distinguish these echoes from QP echoes of the kind reported by Yamamoto et al. (1991), the name “Low al-titude QP” (LQP) was adopted for this class of echoes and we have shown here that they really are at low altitudes and also remain at about the same mean altitude during the observing period of several tens of minutes.
In summary, a significant difference between these two types of echoes is that the LQP echoes are confined to a nar-row height band of about 2–4 km, whereas the QP echoes of-ten exof-tend for more than 20 km above 100 km altitude (Pan and Rao, 2002). The altitude observed in this experiment is below 100 km and extends no more than 4 km with period-icity around 2 min, which seem to resemble the features of LQP echoes.
Chu and Wang (1997), by using the interferometry tech-nique, showed that the QP echoes in the RTI plot can result from the isolated and discrete plasma irregularities drifting in the illuminating region at a constant speed along a fixed and stationary track. Those QP echoes occur mainly above the range of 140 km, whose corresponding height is above 110 km. The striation spacing in the range is about 8–15 km. In the RTI plot they show positive slopes, with a range rate at about 48 m/s, and the lifetime of each streak within 5– 10 min. On the other hand, our observation shows features of LQP echoes which is the first time reported study with the Chung-Li VHF radar.
Striations in the RTI plots could be interpreted in several ways. The slope of the striation in the RTI plot shows that the patches move toward the radar or away from the radar depending on whether the slope is negative or positive. One interpretation is in terms of tracing the isolated echoing re-gions that drifted into the radar volume. If so, then the range rates of the QP echoes are mainly indicative of the radial drift of the scatters. By two different techniques of calculating the range rate, the agreement between the range rates in the RTI plots and the estimated range rates from interferometry sup-ports our conjecture that LQP echoes behave like spatially localized scatters. The elevation and azimuth of observed data lay between 48◦≤θ≤53◦,−15◦≤φ≤5◦, respectively. The estimated values are about|cosθsinφ|<0.2, 0.57<cosθ
cosφ<0.67, and sinθ <0.8, respectively. Although some-times the zonal components of the deduced trace velocities is 150 m/s, the contributions to the range rate slope of LQP echoes are mainly resulting in the meridional drift of the scat-tering irregularity regions.
At one time, a high multiplicity of QP echoes has been observed (Tsunoda et al., 1999; Hysell and Burcham, 2000).
It is unlikely that multiple striations can be associated with distinct sporadic E-layers. The finding of LQP echo patches in multiple striations being at a constant height could clar-ify that the striations can be interpreted as the signatures of an isolated echoing region drifting horizontally at about con-stant altitude. If there were several isolated patches staying in the radar volume and they were distributed in different range gates, respectively, then they would drift for a time and vanished, respectively. The counterpart in the RTI plot is multiple striations of LQP echoes with different range rates, depending on their speeds away from or toward the radar. Because of their patchy appearance, and since they are asso-ciated with an isolated echoing region traversing across the radar beam, the echoes seem to inherently bear a degree of quasi-periodic character. The striation periodicity behaves diversely. It is related to the space between isolated patches drifting into the radar volume.
It is most likely that the original wind shear remains at about the same altitude over the fairly short distance in which we observe these echoes. The height around 100 km is a wind shear preferential altitude (Larsen, 2000). When we reason-ably assume that the observed LQP echoes are in a wind shear, the wind shear only changes with altitude and slowly with time. Since patches embedded in the background wind likely move at the velocity of the mean wind or the plasma drift within the unstable shear region, a change in the sign of the range rate should reflect a reversal in the neutral wind velocity component toward or away from the radar, i.e. in the meridional wind direction.
Our results on the general nature of these LQP echoes could be interpreted in the following way: Since the irreg-ularity patches remain at about constant height, we assume that they are generated in a strong shear region, which ex-tends over a large horizontal distance at constant altitude. The patches generated by the wind instability, in turn, cause the quasi-periodic striations when they drifted into radar vol-ume. The RTI striations of LQP echoes are then the signa-tures of migration of spatially localized and unstable plasma structures or a gradient wind field. Given a reversal in the neutral wind or plasma velocity components, the striations should reflect a slope change in the RTI plot. When there are several patches coexisting in the radar volume, we find mul-tiple striations at one time. In order to discriminate between the neutral and plasma instability mechanisms responsible for these striations, measurements of neutral wind profiles are need, which our experiments cannot provide. We propose that this may be done in a campaign applying a combination of different instruments.
4 Summary
irregularities drift into and through the radar beam at around 98 km to 100 km altitudes. The study also reveals that, in the same time period, echo patches in different QP echo stria-tions did exist at the same altitude. It is shown that the dy-namics of the LQP irregularities, i.e. their motion, can sig-nificantly be obtained from the combination of the range-time-intensity and the interferometer techniques using VHF radar. The application of the latter, namely the interferom-eter method, is mandatory to dinterferom-etermine the proper three-dimensional behavior of these LQP echoes, namely to show that they are really at low altitudes. We also found that they kept their altitude during the observing time and that the range rate changes are essentially only caused by the change in horizontal position.
Acknowledgements. The authors were supported by the National Science Council of the Taiwan/R.O.C. through the grant NSC 91-2811-M008-0025 during the course of the study described here.
Topical Editor M. Lester thanks two referees for their help in evaluating this paper.
References
Bernhardt, P. A.: The modulation of sporadic-E layers by Kelvin-Helmholtz billows in the neutral atmosphere, J. Atmos. Sol-Terr. Phys., 64, 1487–1504, 2002.
Chau, J. L. and Woodman, R. F.: Low-latitude quasiperiodic echoes observed with the Piura VHF radar in the E-region, Geophys. Res. Lett., 26, 2167–2170, 1999.
Choudhary, R. K. and Mahajan, K. K.: Tropical E-region field-aligned irregularities: Simultaneous observations of continuous and QP echoes, J. Geophys. Res., 104, 2613–2619, 1999. Chu, Y. H. and Wang, C. Y.: Interferometry observations of
three-dimensional spatial structures of sporadic-E irregularities using the Chung-Li VHF radar, Radio Sci., 32, 817–832, 1997. Farley, D. T., Ierkic, H. M., and Fejer, B. G.: Radar
interferome-try: a new technique for studying plasma turbulence in the iono-sphere, J. Geophys. Res., 86, 1467–1472, 1981.
Fukao, S., Yamamoto, M., Tsunoda, R. T., Hayakawa, H., and Mukai, T.: The SEEK (Sporadic-E Experiment over Kyushu) campaign, Geophys. Res. Lett., 25, 1761–1764, 1998.
Haldoupis, C., Hussey, G. C., Bourdillon, A., and Delloue, J.: Azimuth-Time-Intensity striations of quasiperiodic radar echoes from the mid-latitude E-region ionosphere, Geophys. Res. Lett., 28, 1933–1936, 2001.
Haldoupis, C., Bourdillon, A., Kamburelis, A., Hussey, G. C., and Koehler, J. A.: 50 MHz continuous wave interferometer obser-vations of the unstable mid-latitude E-region ionosphere, Ann. Geophys., 21, 1589–1600, 2003,
SRef-ID: 1432-0576/ag/2003-21-1589.
Hysell, D. L. and Burcham, J. D.: HF radar observations of
quasiperiodicE- layer echoes over North America, J. Geophys.
Res., 104, 4361–4371, 1999.
Hysell, D. L. and Burcham, J. D.: The 30-MHz radar interferometer studies of midlatitude E-region irregularities, J. Geophys. Res., 105, 12 797–12 812, 2000.
Hysell, D. L., Yamamoto, M., and Fukao, S.: Imaging radar obser-vations and theory of type I and type II quasiperiodic echoes, J. Geophys. Res., 107, doi10.1029/2002JA009292, 2002.
Kelly, M. C., Riggin, D., Pfaff, R. F., Swartz, W. E., Providakes, J. F., and Huang, C. S.: Large amplitude quasi periodic fluctuations associated with a midlatitude sporadic-E layer, J. Atmos. Terr. Phys., 57, 1165–1178, 1995.
Larsen, M. F.: A shear instability seeding mechanism for quasiperi-odic radar echoes, J. Geophys. Res., 105, 24 931–24 940, 2000. Pan, C. J., Liu, C. H., R¨ottger, J., and Su, S. Y.: A three dimensional
study of E-region irregularity patches in the equatorial anomaly region using the Chung-Li VHF radar, Geophys. Res. Lett., 21, 1763–1766, 1994.
Pan, C. J. and Tsunoda, R. T.: Quasi-periodic echoes observed with the Chung-Li VHF radar during the SEEK campaign, Geophys. Res. Lett., 25, 1809–1812, 1998.
Pan, C. J. and Tsunoda, R. T.: Semidiurnal behavior of quasi-periodic echoes in the mid-latitudes Es region observed with the Chung-Li VHF radar, Geophys. Res. Lett., 26, 2621–2624, 1999. Pan, C. J. and Rao, P. B.: Low altitude quasi-periodic radar echoes observed by the Gadanki VHF radar, Geophys. Res. Lett., 29 (10), doi10.1029/2001GL014331, 2002.
Pan, C. J. and Rao, P. B.: Morphology of the field-aligned E-layer irregularities observed by the Gadanki VHF radar, Proceedings of the Tenth workshop on technical and scientific aspects of MST radar 13–20 May 2003, Piura, Peru, 114–117, 2003.
Patra, A. K., Sripathi, S., Kumar, V. S., and Rao, P. B.: Evidence of kilometer-scale waves in the lower E-region from high resolution VHF radar observations over Gadanki, Geophys. Res. Lett., 29 (10), doi1029/2001GL013340, 2002.
Rao, P. B., Yamamoto, M., Uchida, A., Hassenpflug, I., and Fukao, S.: MU radar observations of kilometer-scale waves in the mid-latitude lower E-region, Geophys. Res. Lett., 27, 3667–3670, 2000.
Tsunoda, R. T., Fukao, S., and Yamamoto, M.: On the origin of quasi-periodic radar backscatter from midlatitude sporadic-E, Radio Sci., 29, 349–365, 1994.
Tsunoda, R. T., Buoncore, J. J., Saito, A., Kishimoto, T., Fukao, S., and Yamamoto, M.: First observations of quasi-periodic radar echoes from Stanford, California, Geophys. Res. Lett., 26, 995– 998, 1999.
Urbina, J., Kudeki E., Franke, S. J., Gonzalez, S., Zhou, Q., and Collins, S. C.: 50 MHz radar observations of mid-latitude E-region irregularities at Camp Santiago, Puerto Rico, Geophys. Res. Lett., 27, 2853–2856, 2000.
Wang, C. Y. and Chu, Y. H.: Interferometry investigations of blob-like sporadic-E plasma irregularity using the Chung-Li VHF radar, J. Atmos. Solar-Terr. Phys., 63, 123–133, 2001.
Woodman, R. T., Yamamoto, M., and Fukao, S.: Gravity wave
mod-ulation of gradient drift instabilities in mid-latitude sporadic-E
irregularities, Geophys. Res. Lett., 18, 1197-1200, 1991. Yamamoto, M., Fukao, S., Woodman, R. F., Ogawa, T., Tsuda, T.,
and Kato, S.: Midlatitude E-region field-aligned irregularities observed with the MU radar, J. Geophys. Res.,96, 15 943-15 949, 1991.
Yamamoto, M., Komoda, N., Fukao, S., Tsunoda, R. T., and Ogawa, T.: Spatial structure of the E-region field aligned irregularities revealed by the MU radar, Radio Sci., 29, 337–347, 1994. Yamamoto, M., Ono, T., Oya, H., Tsunoda, R.T., Larsen, M. F.,
Fukao, S., and Yamamoto, M.: Structure in sporadic-Eobserved