www.ann-geophys.net/31/1103/2013/ doi:10.5194/angeo-31-1103-2013
© Author(s) 2013. CC Attribution 3.0 License.
Annales
Geophysicae
Geoscientiic
Geoscientiic
Geoscientiic
Geoscientiic
Observations of HF-induced instability in the auroral E region
N. M. Schlatter1, N. Ivchenko1, B. Gustavsson2, T. Leyser3, and M. Rietveld4
1School of Electrical Engineering, Royal Institute of Technology, Teknikringen 31, 10044 Stockholm, Sweden 2EISCAT Scientific Association, Rymdcampus 1, 98192 Kiruna, Sweden
3Swedish Institute for Space Physics, Uppsala Division, Box 537, 751 21 Uppsala, Sweden 4EISCAT Scientific Association, Ramfjordmoen, 9027 Ramfjordbotn, Norway
Correspondence to:N. M. Schlatter ([email protected])
Received: 11 April 2012 – Revised: 24 March 2013 – Accepted: 13 May 2013 – Published: 21 June 2013
Abstract. Enhancements were observed in backscattered radar power during an ionospheric heating experiment from two distinct altitude regions in the auroral E region above Tromsø. For the experiment the EISCAT Tromsø heater was operated with O mode and X mode alternated at 4.04 MHz, close to the 3rd electron gyroharmonic. Ion-line data recorded with the EISCAT UHF radar reveal different temporal evolutions as well as different ion-line characteris-tics for the enhancements from the two altitude regions. The upper layer is dominated by a strong central feature, whereas the lower layer has three peaks corresponding to the cen-tral feature and the two ion lines. The altitude region of the two closely spaced (altitude separation∼5 km) but distinct enhancements is close to the critical altitude for the heater wave.
Keywords. Ionosphere (active experiments)
1 Introduction
High-power HF (2.6–12 MHz) radio waves can modify the ionospheric plasma significantly. The so-called pump wave can interact with the plasma in a nonlinear way and excite a wide range of wave modes (Gurevich, 2007). Close to the reflection height of the O-mode pump wave Langmuir and ion-acoustic waves can be exited by the parametric decay instability (PDI) (Perkins and Kaw, 1971) and the modula-tional instability (MI) (Fejer and Leer, 1972). Nonlinear ef-fects of the enhanced Langmuir and ion-acoustic fluctuations are treated in Langmuir turbulence theory (e.g. Robinson, 1997; Dubois et al., 1993). To study the interaction region of the pump wave with the plasma, a smooth electron density profile with large scale height and small temporal
variabil-ity is desired. The excited Langmuir and ion-acoustic waves give rise to radar backscatter of incoherent backscatter radars used for measuring plasma bulk properties in the ionosphere. Ionospheric modification experiments at high latitude have been conducted in the F region (Stubbe, 1996; Gurevich, 2007), and more recently observations of heating-induced in-stabilities were also reported from the E region, including sporadic E layers (e.g. Baddeley et al., 2012; Dhillon et al., 2009; Rietveld et al., 2002).
Below the reflection altitude of the pump wave, the pump wave is in resonance with upper-hybrid oscillations. The res-onance instability (Vaskov and Gurevich, 1984; Mjølhus, 1993) acting at this altitude, a few kilometres below the pump reflection altitude, causes the generation of small-scale (1–10 m) field-aligned density irregularities (striations). Pre-existing irregularities trap the induced upper-hybrid waves, leading to heating of the electrons. Due to plasma transport along the magnetic field lines, the density irregularities are enhanced. The growth of the striations gives rise to anoma-lous absorption of HF waves at the upper-hybrid resonance altitude. Therefore, pump-induced enhanced radar backscat-ter from the pump reflection altitude is usually only observed during the first hundreds of milliseconds of pumping. How-ever, when pumping on a electron gyroharmonic frequency, the growth of striations is suppressed (Honary et al., 1995; Robinson et al., 1996) and enhanced radar backscatter per-sists (Honary et al., 1999).
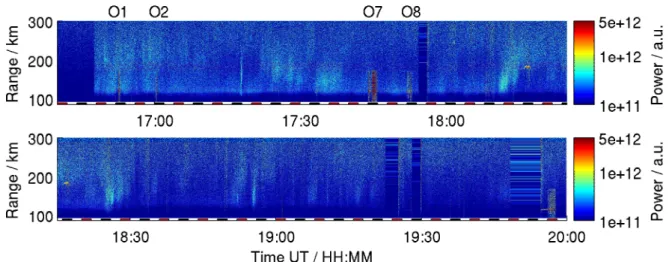
Fig. 1.Overview of radar data obtained during the heating experiment, shown is the radar power profile. The red and black inlays at the bottom of the panels indicate heater on X mode and O mode, respectively.
near Tromsø. During the experiment run, considerable auro-ral activity was observed in the UHF radar data as well as in the optical instrument used for supporting observations. The electron precipitation reached down to the F region and at times also to the E region causing increased electron den-sities. We focus on observations when the electron precip-itation created overcritical E region electron densities. The ionospheric electron density profile during these perturbed times contained significant perturbations and was varying on timescales of several seconds.
2 Instrumentation
The EISCAT heater was operated at 4.04 MHz in a 2 min on 2 min off cycle at full power (152 MW ERP) between 16:00 and 20:00 UT. The polarization was altered between O mode and X mode in alternating HF-on periods and heater power was transmitted along the direction of the magnetic field. Af-ter 17:40 UT the heaAf-ter power was on–off modulated at 10 Hz during the 2 min cycles.
Observations of the E and F region were made with the EISCAT UHF radar (930 MHz) using the arc1 radar pro-gram. The arc1 radar uses an 64-bit alternating code and measures the ionospheric temperatures and electron densities between altitudes of 96 to 422 km with 0.9 km range resolu-tion and 0.44 s time resoluresolu-tion. The UHF radar was directed along the geomagnetic field corresponding to an elevation of 77.5◦and azimuth of 185.1◦. However, alternating codes
are not optimal for studies of plasma instabilities because of strong self-clutter caused by the strong echoes from the plasma instabilities that affect the ranges below and above the plasma instability. Because of this, data cannot be used to determine electron density and plasma bulk properties in this altitude region. No plasma line data were recorded.
Supporting observations of the aurora were conducted with the Auroral Structure and Kinetics (ASK) optical instru-ment situated at the radar site. ASK contains three EMCCD cameras equipped with narrow bandwidth filters for observa-tions of auroral emissions at 673, 731.9 and 777.4 nm corre-sponding to N21PG, O+and O emissions, respectively. The
cameras’ field of view is 3◦×3◦observing in the field-aligned
direction. A more detailed description of the instrument is given by Dahlgren et al. (2008).
3 Observations
−20 0 20 110
120 130
16:52:52
−10 10 16:52:56
−20 0 20 16:53:04
Frequency / kHz
Altitude / km
Power profile O1
16:53 16:54 160
140 120
100 1e+11
1e+12 5e+12
a.u.
Fig. 2.The top panel shows the radar power profile observed dur-ing O-mode heatdur-ing cycle O1 (16:52–16:54 UT) with enhancements in backscattered power from two distinguished altitude layers. At times of enhanced backscatter self-clutter caused by the radar pro-gram can be seen at altitudes up to 180 km. In the bottom panel ion-line spectra are shown measured at 16:52:52, 16:52:56 and 16:53:04 UT with 4 s integration. The spectra are normalized to an arbitrary value and the baseline of each spectrum corresponds to altitude.
−20 0 20 110
120 130
17:00:20
−10 10 17:00:24
−20 0 20 17:00:28
Frequency / kHz
Altitude / km
Power profile O2
17:01 160
140 120
100 1e+11
1e+12 5e+12
a.u.
Fig. 3.Same as Fig. 2 for heating cycle O2 (17:00–17:02 UT).
3.1 Continuous heating
Two of the heating cycles produced enhancements in backscatter with a few seconds of duration from two distinct altitudes. During these heating cycles the heater was oper-ated in the continuous mode. The temporal evolution of the two layers were different from each other. In the first heating cycle, called O1 (16:52–16:54), the bottom layer appeared first, followed by the top layer with several seconds of coex-istence. In the top panel of Fig. 2, the radar power profile is shown with the enhancements at an altitude of about 120 km. Heating cycle O2 (17:00–17:02) is shown in Fig. 3, where the top layer of enhancement, at∼120 km altitude, appears first.
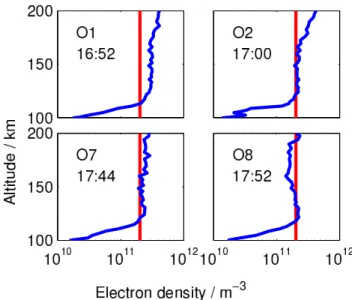
Electron density profiles measured with the radar previous to each heating cycle and 1 min integration show high gra-dients in the lower E region, around the critical density, and
Fig. 4.Electron density profiles (1 min integration) measured with the radar close to the heating cycles discussed. The time inlay, in UT, indicates the corresponding heating cycle and the red vertical line is the critical density for the heater wave.
Fig. 5.Statistical properties of the ion-line spectrum recorded dur-ing the second heatdur-ing cycle (17:00–17:02 UT) split into top and bottom layer shown in red and blue respectively. Left and centre panel: frequency distribution of the ion lines. The left panel shows the down-shifted ion line; the centre panel the distribution for the up-shifted one. Right panel: distribution of the central feature am-plitude relative to the amam-plitude of the enhanced ion lines.
a flat profile in the upper E region. In the upper E region no density depletion is found. The density profiles are shown in Fig. 4. Electron temperatures observed in the altitude region of enhancements were<1000 K.
−20 0 20 110
120 130
17:44:32
−10 10 17:45:04
−20 0 20 17:45:40
Frequency / kHz
Altitude / km
Power profile O7
17:44 17:45 160
140 120
100 1e+11
1e+12 5e+12
a.u.
Fig. 6.Same as Fig. 2 for heating cycle O7 (17:44–17:46 UT).
and 17:00:42 and by generally diffuse and weak structures thereafter.
Different spectral characteristics were observed for the enhanced backscatter associated with the lower and upper layer of enhancements during the heating cycles described above. Representative examples of spectra obtained during enhanced backscatter showing the lower and upper layer are given in the lower row of panels in Figs. 2 and 3 for heat-ing cycle O1 and O2, respectively. The spectra of the upper layer had a dominant central feature covering the ion lines al-most completely, whereas the lower layer showed three dis-tinct features which were the two enhanced ion lines and a central feature.
In order to look at the statistical properties of the spec-tra associated with the two layers, three Gaussian curves ac-cording toG(ν)=A/(√2π σ )exp(−(ν−ν0)2/(2σ2))were fitted to the three features of the enhanced ion-line spectra. The resulting distributions of frequencies for the enhance-ments observed during heating cycle O2 are shown in Fig. 5, where the results are split into lower (blue) and upper layer (red). In the left panel the down-shifted ion-line frequency distribution is shown, and in the centre panel the up-shifted ion-line distribution. Clearly the upper and lower layer dif-fered. The ion-line frequencies in the lower layer are higher by∼1.5 kHz. Results (not shown here) for heating cycle O1 discussed above were similar. The right panel shows the am-plitude of the central feature relative to the enhanced ion-line amplitudes. Again the analysis was split into upper and lower layer. As for the amplitude distributions, the frequency dis-tributions of the two layers differ. For heating cycle O2 the amplitude of the central feature in the lower layer was lower compared to the enhanced ion lines, whereas for the upper layer the central feature is more amplified. The analysis for heating cycle O1 (not shown here) also shows different dis-tributions for the lower and upper layer, although the central line in the lower layer is generally stronger than in heating cycle O2.
−20 0 20 110
120 130
17:52:20
−10 10 17:52:40
−20 0 20 17:52:52
Frequency / kHz
Altitude / km
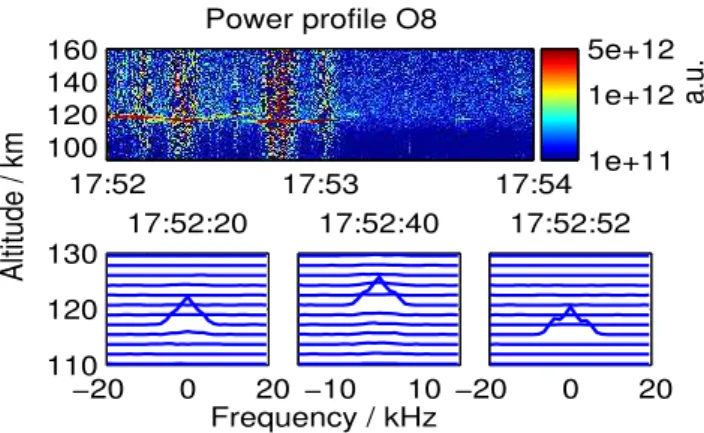
Power profile O8
17:52 17:53 17:54 160
140 120
100 1e+11
1e+12 5e+12
a.u.
Fig. 7.Same as Fig. 2 for heating cycle O8 (17:52–17:54 UT).
3.2 10 Hz on–off modulated heating
From 17:40 on, an additional 10 Hz on–off modulation to the heater power was used during the 2 min on heating cy-cles. The UHF power profiles of two heating cycles, O7 (17:44–17:46) and O8 (17:52–17:54), containing enhanced UHF backscatter from the E region are shown in Figs. 6 and 7, respectively. During heating cycle O7 the enhance-ments lasted for almost the whole cycle with a short interrup-tion after 25 s. Figure 6 shows examples of enhanced spectra obtained during this heating cycle in the bottom panel. The enhanced ion lines are clearly separated and appear as dis-tinct features of the spectra, with frequencies between 4 and 5 kHz. Besides, the enhanced ion lines a distinct central line was observed. Electron temperatures measured in the E re-gion just before the heating cycle were of roughly 500 K.
For heating cycle O8, enhancements were observed for about one minute with several short interruptions due to changes in the auroral intensity. This cycle differs from the others in terms of the enhancement in the backscattered power, which was rather low and at most one order of mag-nitude above thermal backscatter from the same region. The dominant feature in the spectra (Fig. 7 bottom row) was the central line with the enhanced ion lines present as shoulders at times. From the fitting analysis, the frequency of the en-hanced ion lines was found to be below 4 kHz and electron temperatures measured in the E region close to the heating cycle were<500 K.
Electron density profiles measured with the radar and 1 min integration previous to the heating cycle O7 and O8 are shown in Fig. 4, revealing decreasing electron densities compared to heating cycle O1 and O2 and a valley in the up-per E region for heating cycle O8. The profile in the lower E region, however, remains with similar characteristics.
4 Discussion
lines related to the PDI (Perkins and Kaw, 1971) and a zero Doppler shift feature related to the MI (Fejer and Leer, 1972). In the E region, electron collisions increase rapidly with decreasing altitude; for example, the electron collision fre-quency is∼5 kHz at 125 km altitude and∼9 kHz at 115 km. However, the spectra from the lower layer show much more sharp and distinct peaks. Observations of Tromsø heater-induced instabilities in the E region with the EISCAT VHF system presented by Rietveld et al. (2002) show no zero Doppler shift feature at the topside contrary to the results presented here. Their spectra from the top layer show two peaks representing the enhanced ion lines and only one peak in the bottom layer. The missing zero Doppler shift feature is common in observations with the VHF because of the large radar wavevector (Stubbe et al., 1992).
Since the duration of heater-induced instability in the up-per and lower layer are comparable, as well as the strength of enhancement (see Figs. 2 and 3), the effect of the heater on the electron temperature in the two regions is expected to be similar. However, the spectral features associated with the two layers differ from each other, which is not explainable due to different ion-line frequencies. Our observations there-fore suggest a different mechanism in the excitation of the instabilities in the upper and lower layer.
In the observations presented here, electron density pro-files (Fig. 4) indicate a flat density profile in the E region, especially for heating cycle O1 and O2. These profiles also show overcritical densities from the lower E region upward. Because of the instabilities and resulting self-clutter in the radar, data do not allow for detailed analysis of plasma bulk properties; an estimate of the electron density profile was de-rived with a combination of measured electron densities pre-vious/subsequently to instabilities and the measured power profiles during instabilities. This estimate (not shown here) and the electron density profiles indicate that the observed altitudes of instabilities are below the E region peak.
Observations in the E region above Tromsø with two lay-ers of enhancements were reported previously by Rietveld et al. (2002), who operated the heater also during auroral conditions. They interpreted these two layers as enhance-ments of backscattered power from the bottom and topside of the E region due to mode conversion from O to Z mode at the bottom side (Mishin et al., 2001). Observations of bot-tom and topside enhancements in the ionospheric F region were reported for the first time by Isham et al. (1990). The radio window associated with the conversion from O mode to Z mode lies around the Spitze or critical angle (Ginzburg, 1970) and for a horizontally stratified ionosphere; it is of the order of 1◦, as recently reported by Kosch et al. (2011) for
the Tromsø F region. However, for an ionosphere containing significant electron density perturbations, the conversion to Z mode is possible also at other angles than the critical angle, Mishin et al. (2001). As long as the Z-mode reflection den-sity or the topside is not reached, the Z-mode wave will con-tinue upward propagation. Reaching the topside, the Z-mode
wave may be absorbed and energy will be exchanged with the ionosphere, leading to electrostatic waves which can be detected with the radar (Eliasson, 2008). Gondarenko et al. (2003) show in their simulations that the observations from Rietveld et al. (2002) in the Tromsø E region can be ex-plained by the mechanism of mode conversion close to the reflection altitude. However, pump-induced enhanced radar backscatter reported herein indicate a somehow different and more complicated picture. First, the time evolution of the en-hancements observed at the two altitudes is different, with some observations of an absent lower layer. Thus, if inter-preted as E region bottom and topside enhancements, this suggests efficient mode conversion of the pump electromag-netic wave into Z-mode waves at the bottom side. Second, electron density profiles measured with the EISCAT UHF radar in vicinity of the heating cycles are overcritical, and no E region topside at the altitude of the observed enhance-ments is present. Third, the prevailing disturbed conditions are unlikely to produce an E region electron density profile in such a way that the condition for Z-mode propagation to the topside is fulfilled and the altitude separation between the enhancements at the bottom and topside is nearly constant, as suggested by the observations.
Instabilities observed with the 10 Hz on–off modulated heating scheme originated from only one altitude region. This might be connected to the the changing electron den-sity profile rather than different heating scheme.
The intention of this heating experiment was to produce results similar to results reported by Pedersen and Gerken (2005), or to modify the visible aurora in other ways. The heating scheme as well as the radar program therefore may not be optimal for studies of instabilities. For such studies, one usually operates the heater at a very low duty cycle in or-der to minimize the impact of the heater wave on the plasma, such as heating and inducing irregularities in the plasma (e.g. Djuth et al., 2004). These heater-induced irregularities to-gether with the changes in the electron density profile due to auroral activity make it impossible to provide an exact electron density profile. Also, the radar program, which has a fairly high altitude and temporal resolution, does not give reliable results for the plasma bulk properties at times of in-duced instability due to high self-clutter. However, the auro-ral activity, and therefore changes in the ionosphere on short timescales, puts the heater influence into perspective.
5 Conclusions
features of the ion lines and the central feature distinct from each other even though collision frequency increases rapidly with decreasing altitude. It was not possible to associate the altitudes of backscatter with the bottom or topside of the E re-gion layer due to lack of precise electron density profiles.
Acknowledgements. EISCAT is an international association sup-ported by research organizations in China (CRIRP), Finland (SA), Japan (NIPR and STEL), Norway (NFR), Sweden (VR) and the United Kingdom (NERC).
Topical Editor K. Kauristie thanks M. Kosch and one anony-mous referee for their help in evaluating this paper.
References
Baddeley, L. J., Haggstr¨om, I., Yeoman, T. K., and Rietveld, M.: First observations of SPEAR-induced topside and bottomside sporadic E layer heating observed using the EISCAT Sval-bard and SuperDARN radars, J. Geophys. Res., 117, A01307, doi:10.1029/2011JA017079, 2012.
Dahlgren, H., Ivchenko, N., Sullivan, J., Lanchester, B. S., Mark-lund, G., and Whiter, D.: Morphology and dynamics of aurora at fine scale: first results from the ASK instrument, Ann. Geophys., 26, 1041–1048, doi:10.5194/angeo-26-1041-2008, 2008. Dhillon, R. S., Robinson, T. R., and Yeoman, T. K.: Aspect
sen-sitive E- and F-region SPEAR-enhanced incoherent backscatter observed by the EISCAT Svalbard radar, Ann. Geophys., 27, 65– 81, doi:10.5194/angeo-27-65-2009, 2009.
Djuth, F. T., Isham, B., Rietveld, M. T., Hagfors, T., and La Hoz, C.: First 100 ms of HF modification at Tromsø, Norway, J. Geophys. Res., 109, A11307, doi:10.1029/2003JA010236, 2004.
Dubois, D., Hanssen, A., Rose, H., and Russell, D.: Space and Time Distribution of HF Excited Langmuir Turbulence in the Ionosphere: Comparison of Theory and Experiment. J. Geophys. Res., 98, 17543–17567, 1993.
Eliasson, B.: Full-scale simulation study of the generation of top-side ionospheric turbulence using a generalized Zakharov model, Geophys. Res. Lett., 35, L11104, doi:10.1029/2008GL033866, 2008.
Fejer, J. A. and Leer, E.: Purely Growing Parametric Instability in an Inhomogeneous Plasma, J. Geophys. Res., 77, 700–708, 1972. Ginzburg, V. L.: The propagation of electromagnetic waves in plas-mas, Int. Ser. of Monographs in Electromagnetic Waves, Oxford: Pergamon, 1970.
Gondarenko, N. A., Guzdar, P. N., Ossakow, S. L., and Bernhardt, P. A.: Linear mode conversion in inhomogeneous magnetized plasmas during ionospheric modification by HF radio waves, J. Geophys. Res., 108, 1470, doi:10.1029/2003JA009985, 2003. Gurevich, A. V.: Nonlinear effects in the ionosphere, Phys. Uspekhi,
50, 1091–1121, doi:10.1070/PU2007v050n11ABEH006212, 2007.
Honary, F., Stocker, A. J., Robinson, T. R., Jones, T. B., and Stubbe, P.: Ionospheric plasma response to HF radio waves operating at frequencies close to the third harmonic of the electron gyrofrequency, J. Geophys. Res., 100, 2156–2202, doi:10.1029/95JA02098, 1995.
Honary, F., Robinson, T. R., Wright, D. M., Stocker, A. J., Ri-etveld, M. T., and McCrea, I.: Letter to the Editor: First direct observations of the reduced striations at pump frequencies close to the electron gyroharmonics, Ann. Geophys., 17, 1235–1238, doi:10.1007/s00585-999-1235-6, 1999.
Isham, B., Kofman, W., Hagfors, T., Nordling, J., Thide, B., LaHoz, C., and Stubbe, P.: New phenomena observed by EISCAT during an RF ionospheric modification experiment, Radio Sci., 25, 251– 262, doi:10.1029/RS025i003p00251, 1990.
Kosch, M. J., Mjølhus, E., Ashrafi, M., Rietveld, M. T., Yeoman, T., and Nozawa, S.: Angular dependance of pump-induced bot-tomside and topside ionospheric plasma turbulence at EISCAT, J. Geophys. Res., 116, A03322, doi:10.1029/2010JA016014, 2011. Mishin, E., Hagfors, T., and Isham, B.: A generation mechanism for topside enhanced incoherent backscatter during high frequency modification experiments in Tromsø, Geophys. Res. Lett., 28, 479–482, 2001.
Mjølhus, E.: On the small scale striation effect in ionosphere radio modification experiments near harmonics of the electron gyrofre-quency, J. Atmos. Terr. Phys., 55, 9907–9918, 1993.
Pedersen, T. R. and Gerken, E. A.: Creation of visible artificial op-tical emissions in the aurora by high-power radio waves, Nature, 433, 498–500, 2005.
Perkins, F. and Kaw, P.: On the Role of Plasma Instabilities in Iono-spheric Heating by Radio Waves, J. Geophys. Res., 76, 282–284, 1971.
Rietveld, M. T., Isham, B., Grydeland, T., La Hoz, C., Leyser, T. B., Honary, F., Ueda, H., Kosch, M., and Hagfors, T.: HF-pump-induced parametric instabilities in the auroral E-region, Adv. Space Res., 29, 1363–1368, 2002.
Robinson, P. A.: Nonlinear wave collapse and strong turbulence, Rev. Mod. Phys., 69, 507–574, doi:10.1103/RevModPhys.69.507, 1997.
Robinson, T. R., Honary, F., Stocker, A. J., Jones, T. B., and Stubbe, P.: First EISCAT observations of the modification of F-region electron temperatures during RF heating at harmonics of the electron gyro frequency, J. Atmos. Terr. Phys., 58, 385–395, doi:10.1016/0021-9169(95)00043-7, 1996.
Stubbe, P.: Review of ionospheric modification experiments at Tromsø, J. Atmos. Terr. Phys., 58, 349–368, doi:10.1016/0021-9169(95)00041-0, 1996.
Stubbe, P., Kohl, H., and Rietveld, M. T.: Langmuir Turbulence and Ionospheric Modification, J. Geophys. Res., 97, 6285–6297, 1992.