AMTD
8, 10097–10120, 2015Range imaging using the Chung-Li VHF
radar
J.-S. Chen et al.
Title Page
Abstract Introduction
Conclusions References
Tables Figures
◭ ◮
◭ ◮
Back Close
Full Screen / Esc
Printer-friendly Version Interactive Discussion
Discussion
P
a
per
|
Discussion
P
a
per
|
Discussion
P
a
per
|
Discussion
P
a
per
|
Atmos. Meas. Tech. Discuss., 8, 10097–10120, 2015 www.atmos-meas-tech-discuss.net/8/10097/2015/ doi:10.5194/amtd-8-10097-2015
© Author(s) 2015. CC Attribution 3.0 License.
This discussion paper is/has been under review for the journal Atmospheric Measurement Techniques (AMT). Please refer to the corresponding final paper in AMT if available.
Evaluation of multifrequency
range-imaging technique implemented on
the Chung–Li VHF atmospheric radar
J.-S. Chen1, S.-C. Tsai2, C.-L. Su3, and Y.-H. Chu3
1
Center for General Education, China Medical University, Taichung, Taiwan
2
Department of Environmental Information and Engineering, National Defense University, Taoyuan, Taiwan
3
Institute of Space Science, National Central University, Jhongli, Taiwan
Received: 19 August 2015 – Accepted: 22 August 2015 – Published: 29 September 2015
Correspondence to: J.-S. Chen ([email protected])
AMTD
8, 10097–10120, 2015Range imaging using the Chung-Li VHF
radar
J.-S. Chen et al.
Title Page
Abstract Introduction
Conclusions References
Tables Figures
◭ ◮
◭ ◮
Back Close
Full Screen / Esc
Printer-friendly Version Interactive Discussion
Discussion
P
a
per
|
Discussion
P
a
per
|
Discussion
P
a
per
|
Discussion
P
a
per
|
Abstract
Multifrequency range imaging technique (RIM) has been implemented on the Chung– Li VHF-array radar since 2008 after its renovation. This study made a more complete examination and evaluation of the RIM technique to facilitate the performance of the radar for atmospheric studies. Various experiments of RIM with different radar
parame-5
ters such as pulse length, pulse shape, receiver bandwidth, transmitter frequency set, and so on, were conducted. The radar data employed for the study were collected from 2008 to 2013. It has been shown that two factors, the range/time delay of the signal traveling in the media and the standard deviation of Gaussian-shaped range-weighting function, play crucial roles in ameliorating the RIM-produced brightness (or power
dis-10
tribution); the two factors are associated with some radar parameters. In addition to radar parameters, long-term RIM data show that the aging of cable lines or key compo-nents of the radar system may result in an increase of the range/time delay of signal. It is also found that the range/time delay was visibly different for the echoes from the atmosphere with and without the presence of significant precipitation. A procedure of
15
point-by-point correction of range/time delay was thus conducted to minimize the bogus brightness discontinuity at range gate boundaries. With the RIM technique, the Chung– Li VHF radar demonstrates its first successful observation of double-layer structures as well as their temporal and spatial variations with time.
1 Introduction
20
The mesosphere–stratosphere–troposphere (MST) radar operated at very-high-frequency (VHF) band is a powerful instrument to study the atmosphere at all heights from near the ground up to the ionosphere. Among the capabilities of VHF-MST radar, continuous measurement of three-dimensional winds with a temporal resolution of sev-eral minutes and a vertical resolution of sevsev-eral hundred meters is praiseworthy (Lee
25
AMTD
8, 10097–10120, 2015Range imaging using the Chung-Li VHF
radar
J.-S. Chen et al.
Title Page
Abstract Introduction
Conclusions References
Tables Figures
◭ ◮
◭ ◮
Back Close
Full Screen / Esc
Printer-friendly Version Interactive Discussion
Discussion
P
a
per
|
Discussion
P
a
per
|
Discussion
P
a
per
|
Discussion
P
a
per
|
structures of refractivity irregularities, such as thin layers with the thickness of tens of meters, exist commonly in the atmosphere and can reflect dynamic behavior of the at-mosphere directly. However, a conventional atmospheric radar that operates at a spe-cific frequency and a finite pulse length is unable to resolve the thin layer structures embedded within the range gate. In view of this, a frequency-hopped technique was
5
introduced to the pulsed radar community to overcome this limitation (Franke, 1990). The frequency-hopped technique was initially implemented with two frequencies on the VHF-MST radar, which can only resolve a Gaussian-shaped single layer in the range gate. Implementation of the frequency-hopped technique with more than two frequencies was not achieved until 2001 for ultra-high-frequency (UHF) wind profiler
10
(Platteville 915 MHz radar at 40.19◦N, 104.73◦W) (Chilson et al., 2003, 2004). Since then, the European incoherent scatter (EISCAT) VHF radar, the middle and upper at-mosphere radar (MUR; 34.85◦N, 136.10◦E), the Ostsee wind (OSWIN) VHF radar (54.1◦N, 11.8◦E), the Chung–Li VHF radar (24.9◦N, 121.1◦E), and so on, were also implemented this technique to observe gravity waves, double-layer structures, Kelvin–
15
Helmholtz instability billows, convective structures, polar mesosphere summer echoes (PMSE), and so on, with high resolution in the range direction (e.g., Fernandez et al., 2005; Luce et al., 2006, 2008; Chen and Zecha, 2009; Chen et al., 2009). The termi-nologies of range imaging (RIM) (Palmer et al., 1999) and frequency-interferometric imaging (FII) (Luce et al., 2001) were given to the frequency-hopped technique for the
20
radar remote sensing of the atmosphere. Some advanced applications of RIM have also been proposed, e.g., a high-resolution measurement of wind field in the sampling gate (Yu and Brown, 2004; Chilson et al., 2004; Yamamoto et al., 2014). Moreover, three-dimensional imaging of the scattering structure in the radar volume has been put into practice by combing RIM and coherent radar imaging (CRI) techniques
(Has-25
AMTD
8, 10097–10120, 2015Range imaging using the Chung-Li VHF
radar
J.-S. Chen et al.
Title Page
Abstract Introduction
Conclusions References
Tables Figures
◭ ◮
◭ ◮
Back Close
Full Screen / Esc
Printer-friendly Version Interactive Discussion
Discussion
P
a
per
|
Discussion
P
a
per
|
Discussion
P
a
per
|
Discussion
P
a
per
|
In this study, a large amount of RIM data that were collected by the Chung–Li VHF radar operated with various pulse lengths and shapes, phase codes, receiver band-widths, frequency sets, and so on, for the period from 2008 to 2013 were analyzed to evaluate the capability of the RIM technique implemented on the radar. It has been shown that the performance of RIM for the thin layer measurement relies on a proper
5
calibration of the radar data, including time delay of radar signal, signal-to-noise ratio (SNR), and the range weighting function (Chen and Zecha, 2009). The time delay of the radar signal traveling in the media, such as the cable lines, free space, and pro-cessing time in the radar system, leads to a range delay and thereby gives a range error in the RIM processing. Besides, the range weighting function effect on the spatial
10
distribution of the RIM-produced brightness is also required to adequately correct to restore the fine structures in the radar volume (Chen et al., 2014b). To this end, the calibration approach proposed by Chen and Zecha (2009), which is more convenient for our studies, was employed in this study.
This article is organized as follow. In Sect. 2, the RIM capability of the Chung–Li
15
VHF radar is introduced briefly. Section 3 gives an example of RIM as well as its cal-ibration results for different radar parameters such as receiver system and frequency set. Section 4 presents the observations of precipitation and some layer structures. It is found that the time delay measured for precipitation echoes was different from that of clear-air turbulences. A deeper examination was made to improve the RIM-produced
20
brightness for precipitation echoes. In addition, double-layer structures and finer parts within the structures were resolved successfully to demonstrate the capability of RIM implemented on the radar system. Conclusion is drawn in Sect. 5.
2 Range-imaging technique of the Chung–Li VHF radar
The characteristics of the Chung–Li VHF radar system have been upgraded for several
25
AMTD
8, 10097–10120, 2015Range imaging using the Chung-Li VHF
radar
J.-S. Chen et al.
Title Page
Abstract Introduction
Conclusions References
Tables Figures
◭ ◮
◭ ◮
Back Close
Full Screen / Esc
Printer-friendly Version Interactive Discussion
Discussion
P
a
per
|
Discussion
P
a
per
|
Discussion
P
a
per
|
Discussion
P
a
per
|
such as rectangular, Gaussian, and trapezoid are also available, and corresponding fil-ter bandwidths can be chosen to match the transmitted pulse widths and pulse shapes. These renovations and improvements in the radar characteristics enable the newly up-graded Chung–Li VHF radar to use the RIM technique to observe fine structures in the atmosphere. The first experiment of RIM made with the Chung–Li radar was
con-5
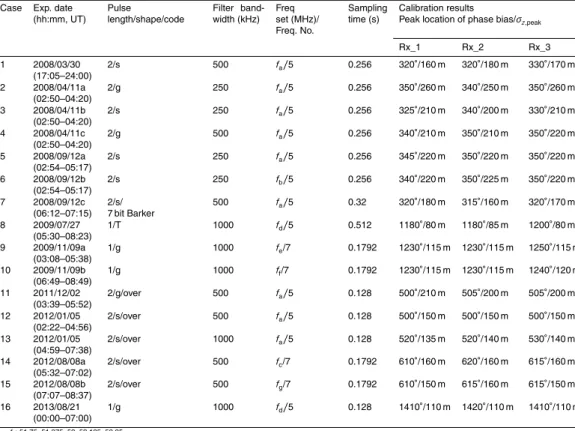
ducted successfully in 2008 (Chen et al., 2009), and since then many experiments with the RIM mode have been carried out by the radar. Table 1 lists many of the obser-vations and their calibration results that will be discussed later. As listed, 1 and 2 µs pulse lengths, three types of pulse shapes, and different bandwidths and frequency sets were tested. Moreover, three receiving channels (subarrays) were functioned for
10
reception of radar echoes. The analysis of various kinds of radar data can help us to realize the capability of the RIM technique implemented on the radar system for at-mospheric measurements. A possible drawback of RIM may arise from the relatively broad radar beamwidth (∼7.4◦), which may smear the measured structure imaging due
to a noticeable curvature of the radar beam.
15
In the RIM processing, the Capon method (Palmer et al., 1999) was employed to es-timate the range-dependent brightness. The Capon method is simple, less consump-tion of time, and robust for the processing of radar data. To acquire proper imaging of refractivity structures, corrections of range error and range weighting function effect are essential. In this study, we employed the calibration approach given by Chen and
20
Zecha (2009) to make necessary corrections, which has been successfully tested for the Chung–Li radar and the MUR (Chen et al., 2009). The estimator of mean square error that is used to determine the optimal parameters for correcting the RIM-produced brightness is given by:
∆B=
N
X
i=1
(B1i−B2i)
2
B1iB2i
(1)
25
AMTD
8, 10097–10120, 2015Range imaging using the Chung-Li VHF
radar
J.-S. Chen et al.
Title Page
Abstract Introduction
Conclusions References
Tables Figures
◭ ◮
◭ ◮
Back Close
Full Screen / Esc
Printer-friendly Version Interactive Discussion
Discussion
P
a
per
|
Discussion
P
a
per
|
Discussion
P
a
per
|
Discussion
P
a
per
|
values. Although the echoing structures in the overlapped sampling range intervals should be the same and are expected to give similar B1 and B2 values, the esti-matedB1 andB2 values may not be the same owing to the sampling range error and
range-weighting effect. Therefore,B1andB2values will approximate to each other
af-ter proper corrections of sampling range error and range-weighting effect are made.
5
An optimal correction will result in a smallest value of∆B, which can be achieved by changing the sampling range error and the standard deviation of the Gaussian-shaped range-weighting function in the calibration processing.
3 Observations and calibrations
Table 1 lists sixteen cases of the RIM experiments that were carried out between 2008
10
and 2013 by using the Chung–Li VHF radar. With the plentiful radar data, the long-term variation in some of the characteristics of radar system will be addressed and discussed. In addition, the RIM experiments conducted on 9 November 2009 (cases 9 and 10) are used as typical cases for specific demonstration.
3.1 Different receiver systems
15
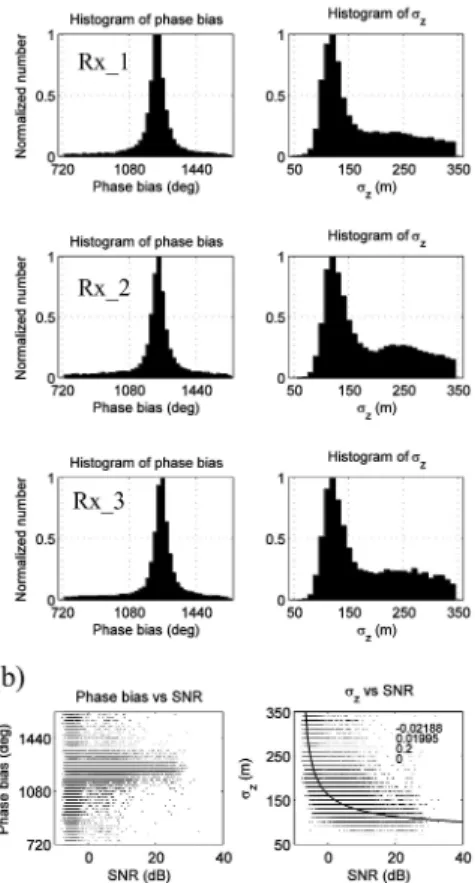
Figure 1 shows the statistic results of the calibration-estimated phase bias (left pan-els) and standard deviationσz (right panels) of the Gaussian range weighting function exp(−r2/σz2), where r is the range relative to the gate center, for the radar data of case 10. Only the atmospheric echoes with the SNR larger than−9 dB were analyzed
and presented in Fig. 1. Note that the value of 360◦
phase bias corresponds to a time
20
delay of 2 µs, or 300 m range error.
As shown in Fig. 1, the phase bias histograms of the three receiving channels were in consistent with each other. The mean phase biases were centered at around 1230◦ (peak location), corresponding to a time delay of∼6.833 µs, or 1.025 km range delay.
Note that some data with low SNR caused randomly distributed phase biases with
AMTD
8, 10097–10120, 2015Range imaging using the Chung-Li VHF
radar
J.-S. Chen et al.
Title Page
Abstract Introduction
Conclusions References
Tables Figures
◭ ◮
◭ ◮
Back Close
Full Screen / Esc
Printer-friendly Version Interactive Discussion
Discussion
P
a
per
|
Discussion
P
a
per
|
Discussion
P
a
per
|
Discussion
P
a
per
|
bers much less than that at peak location. In general, the distributions of phase biases for all of the RIM experiments listed in Table 1 were centered at their respective mean values, and the mean values of the three receiving channels were nearly the same. In view of this, the three receiver systems are thought to be approximately identical in conducting the RIM experiment. This, however, does not mean that the system phase
5
difference between receiving channels, which is a crucial parameter for spatial radar interferometry, is close to zero. Similarity of phase bias distributions between different receiving channels suggests that the range/time delay may not be the main cause of the system phase difference, if exists, between receiving channels of the Chung–Li radar. This issue is needed to clarify by other means and will not be discussed further
10
in this study.
Figure 1b presents scatter diagrams of phase bias (left) andσz (right) vs. SNR, re-spectively. As shown, for the data with SNR>0 dB, the phase biases distributed majorly in a range of 1080–1440◦, centered at around 1230◦. By contrast, theσ
z values were SNR dependent, as seen in the right panel of Fig. 1b. A curve has been determined
15
to represent the relationship betweenσz and SNR (Chen and Zecha, 2009), which is beneficial to produce the structure at gate boundaries with smoother imaging and is given below:
σz= a 1
(SNR+10)C +b
−d, (2)
where the four constantsa,b,c, andd are given in the plot (reading from top to
bot-20
tom). The fitting curve reveals that theσz value tends to approach to a constant value of about 100 m, as the SNR increases. This curve-approachedσz value at high SNR was close to the peak location ofσz histogram shown in the right panels of Fig. 1a. The
σz value at large SNR or the peak location ofσzhistogram can describe the theoretical shape of the Gaussian range weighting function. The dependence ofσz value on SNR
25
AMTD
8, 10097–10120, 2015Range imaging using the Chung-Li VHF
radar
J.-S. Chen et al.
Title Page
Abstract Introduction
Conclusions References
Tables Figures
◭ ◮
◭ ◮
Back Close
Full Screen / Esc
Printer-friendly Version Interactive Discussion
Discussion
P
a
per
|
Discussion
P
a
per
|
Discussion
P
a
per
|
Discussion
P
a
per
|
3.2 Time- and radar parameter-dependent characteristics
As revealed in Table 1, the peak locations of phase bias histograms for 1 µs pulse length were greatly larger than those for 2 µs pulse length. The cause of such difference is still unclear but worthy of continued investigation in the future for fully understanding the characteristics of the radar system or other fundamental factors. Another noticeable
5
feature is a variation in the peak location of phase bias with time. For 1 µs pulse length, the peak location was larger in 2013 than in 2009. For 2 µs pulse length the peak locations obtained in 2011 and 2012 were evidently larger than those obtained in 2008. The change in phase bias with time is presumably due to the aging of cable lines or some components in the radar system.
10
On the other hand, the peak location of σz histogram, σz,peak, was not
time-dependent. Instead, it is a function of pulse shape and filter bandwidth; for example, the three radar experiments (cases 2–4) conducted on 11 April 2008 with different pulse shapes and filter bandwidths that were set alternately in the experiments (Chen et al., 2009). The experiment with Gaussian-shaped pulse and 250 kHz bandwidth (case 2)
15
had a largerσz,peak than that with squared pulse shape but the same filter bandwidth
(case 3), and also larger than that with the same pulse shape but 500 kHz bandwidth (case 4), indicating a dependence ofσzvalue on radar pulse shape as well as receiver bandwidth.
More examples are the radar experiments (cases 8–10) carried out on 27 July and
20
9 November in 2009. The radar parameters of 1 µs pulse length and 1 MHz filter band-width employed in the three experiments were the same, but the frequency sets and the pulse shapes were different. The trapezoid shape employed in the case 8 is a mod-ified square pulse with a suppression of the sharp slopes at rising and falling edges of the pulse. We shall show later that the number of frequencies was not the main cause
25
of variation inσz,peak when the number of frequencies was more than five. However,
the pulse shape may play a role in determining theσz,peak value, in which the
AMTD
8, 10097–10120, 2015Range imaging using the Chung-Li VHF
radar
J.-S. Chen et al.
Title Page
Abstract Introduction
Conclusions References
Tables Figures
◭ ◮
◭ ◮
Back Close
Full Screen / Esc
Printer-friendly Version Interactive Discussion
Discussion
P
a
per
|
Discussion
P
a
per
|
Discussion
P
a
per
|
Discussion
P
a
per
|
phase bias on 27 July was smaller than that on 9 November by about 50◦; again, we attribute it to the aging of cable lines or some components in the radar system.
It is noteworthy that the experiment (case 7) carried out on 12 September 2008 used 7 bit barker codes for pulse coding, with other radar parameters the same as the first RIM experiment conducted on 30 March 2008. There were no noticeable differences in
5
the calibration results between the two cases. Moreover, the radar system was stable in 2008 because the peak locations of phase biases were in general agreement with each other.
3.3 Different frequency sets
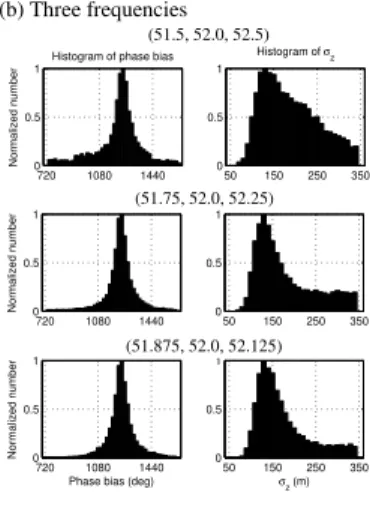
RIM exploits an advantage of frequency diversity. The number of carrier frequencies
10
and the frequency step play crucial roles in determining the performance of RIM. Fig-ure 2 compares the histograms of the calibration-estimated phase biases andσz val-ues at different frequency sets and frequency steps with the radar data of case 10. As shown, except for the two-frequency mode with the frequency pair (51.5, 52.5) MHz, all of other histograms had distinct peaks with locations at around 1240◦
. This result clearly
15
demonstrates that the RIM technique is a robust approach to estimate the range/time delay of signal in the media and/or radar system. It can also be seen from Fig. 2 that the more the carrier frequency number is used, and the smaller the frequency separa-tion is given, the more concentrated the distribusepara-tions of phase biases andσz values will be. A closer examination shows that the peak locations ofσz histograms approximate
20
to a value of 120 m as the number of carrier frequencies increases.
In light of the fact that the performance of estimating the phase bias and theσz value is superior with more carrier frequencies and smaller frequency step, we exhibit the RIM results of cases 9 and 10 to demonstrate fine atmospheric layer structures within the range gates, as shown in Fig. 3. The left panels of Fig. 3 shows the original
height-25
AMTD
8, 10097–10120, 2015Range imaging using the Chung-Li VHF
radar
J.-S. Chen et al.
Title Page
Abstract Introduction
Conclusions References
Tables Figures
◭ ◮
◭ ◮
Back Close
Full Screen / Esc
Printer-friendly Version Interactive Discussion
Discussion
P
a
per
|
Discussion
P
a
per
|
Discussion
P
a
per
|
Discussion
P
a
per
|
in short time interval. There were also many echoes from airplanes, which were strong but limited within short range and time interval. Ignoring these questionable echoes, a large number of thin layer structures with thickness as small as 30 m or less can be observed from the RIM-produced brightness distributions. The temporal and spatial variations of the thin layer structures were characterized by dynamic behavior, with the
5
features of prominent wavy structure (e.g., below the range height of 2.5 km in the panel a), descending or ascending gradually with time, and sudden occurrence or disruption of the layers at specific heights (e.g., between the range heights of 5.0 and 6.0 km in the time interval of 4.0 and 5.0 h). In addition, double-thin layer structures with a separation as small as 100 m or less can also be resolved (e.g., between the range height of 3.5
10
and 4.0 km in the panel b); we will discuss this type of layer structure in more detail in next section.
4 More observations and discussion
4.1 RIM for precipitation echoes
The calibration approach employed in the preceding section for the RIM processing
15
is based on the assumption that the atmospheric structures are continuous at the common edges of two adjacent range gates. With this assumption, the RIM-produced brightness at the common edges should be identical after the two factors of range/time delay and range weighting function effect are compensated. This assumption is basi-cally valid for random fluctuations of the atmospheric refractivity at the Bragg scale that
20
serve as the scatterers to generate the radar returns. However, the continuity assump-tion for discrete targets, such as precipitaassump-tion particles, may not be true. In such situ-ation of discrete targets, the RIM-produced brightness did not vary smoothly through gate boundaries even the calibrated parameters were applied. One example observed on 21 August 2013 is shown in Fig. 4. We should ignore the pulse-like echoes occurring
25
AMTD
8, 10097–10120, 2015Range imaging using the Chung-Li VHF
radar
J.-S. Chen et al.
Title Page
Abstract Introduction
Conclusions References
Tables Figures
◭ ◮
◭ ◮
Back Close
Full Screen / Esc
Printer-friendly Version Interactive Discussion
Discussion
P
a
per
|
Discussion
P
a
per
|
Discussion
P
a
per
|
Discussion
P
a
per
|
nearby airport. On the other hand, the strong echoes in the time interval between 5.5 h (05:30 UT) and 5.75 h (05:45 UT), and at around 5.0 h, were not only from the contin-uous refractivity fluctuations, but also from discrete precipitation particles. This feature can be verified from the power spectra of radar echoes as well as the rain rate mea-sured by the disdrometer located near the radar site, as shown in Fig. 5. The rain rate
5
in Fig. 5a shows two peak intensities occurred during the periods between 04:54 UT (4.9 h) and 05:06 UT (5.1 h) and between 05:30 UT (5.5 h) and 05:42 UT (5.7 h). The rainfall rate was alleviated between these two periods, and then almost vanished after
∼05:42 UT. In Fig. 5b, three typical power spectra of radar echoes with and without
precipitation are shown; the corresponding times of these power spectra are indicated
10
sequentially by the red arrows in Fig. 5a. In the rightmost panel of Fig. 5b, the Doppler velocities were around zero throughout the altitude; it is clear that the echoes were generated by refractivity fluctuations without the contribution from precipitation parti-cles. By contrast, Doppler velocities with large negative values were observed in the middle panel, which were associated with heavy rain. Note that the rainfall velocity was
15
so large that Doppler aliasing happened. The leftmost panel shows the condition of moderate precipitation, in which the spectral power of precipitation was much lower than that of refractivity fluctuations.
After range imaging with the constant phase bias indicated in Table 1, the RIM-produced brightness in the middle panel of Fig. 4 exhibits evident discontinuities at
20
the boundaries of range gates in the periods when intense precipitations occurred The occurrence of discontinuity of the RIM-produced brightness at gate boundaries is presumably due to improper phase bias (range error) compensating in the RIM pro-cessing. When adaptable phase bias was adopted for each estimate of brightness, we obtained a better result shown in the lowest panel of Fig. 4. As seen, discontinuity of
25
AMTD
8, 10097–10120, 2015Range imaging using the Chung-Li VHF
radar
J.-S. Chen et al.
Title Page
Abstract Introduction
Conclusions References
Tables Figures
◭ ◮
◭ ◮
Back Close
Full Screen / Esc
Printer-friendly Version Interactive Discussion
Discussion
P
a
per
|
Discussion
P
a
per
|
Discussion
P
a
per
|
Discussion
P
a
per
|
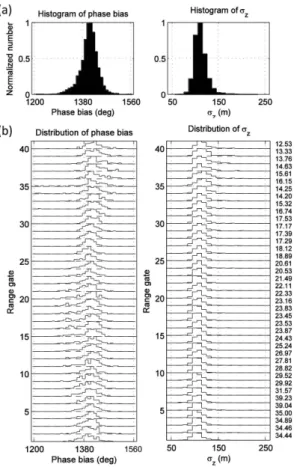
Figure 6a shows the histograms of phase biases andσz values for the data shown in Fig. 4. The overall features of the histograms of phase biases andσz values are simi-lar to those shown in Fig. 1, except for the peak location of phase biases. Normalized distributions of phase biases andσz values varying with range gates are shown in the panel b. In general, the phase biases centered at around 1400◦
. However, some phase
5
biases with values smaller than 1400◦ by as far as 90◦ can be observed in the range extent between 11th and 25th range gates. An examination shows that these phase biases were associated with intense precipitation echoes. In view of this, respective values of phase biases obtained from the calibration process were considered in the RIM processing to produce a more continuous imaging structure. Nevertheless, the
10
distributions ofσz values were quite consistent throughout the entire range gates. Ac-cordingly, adaptable phase bias for correction of range/time error is required and the result is shown in the lowest panel of Fig. 4.
The cause of difference in phase bias between precipitation and refractivity fluctu-ations is still unknown. A plausible conjecture is spatially inhomogeneous distribution
15
and temporally quick change of the discrete-natured precipitation particles in the radar volume, which may lead to a breakdown of the assumptions for calibration of RIM data. This issue may be investigated and clarified by using the technique of multi-receiver coherent radar imaging (CRI) (Palmer et al., 2005). Unfortunately, the Chung–Li radar does not have enough receiving channels for CRI technique and we need other
suit-20
able radars with CRI capability to conduct the radar experiment to tackle the problem of difference in phase bias between precipitation and refractivity fluctuations.
4.2 Double-layer structures
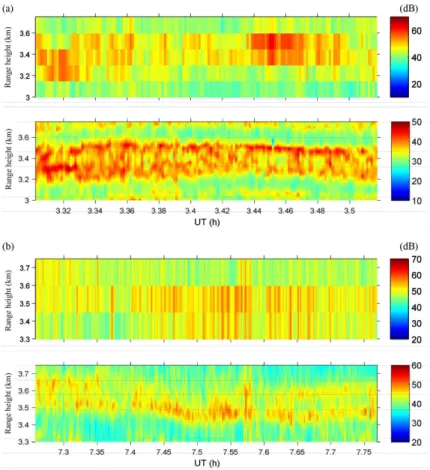
As shown in Fig. 3, various thin layer structures can be resolved by using the RIM technique. In this sub-section, two kinds of double-thin layer structures are presented.
25
phys-AMTD
8, 10097–10120, 2015Range imaging using the Chung-Li VHF
radar
J.-S. Chen et al.
Title Page
Abstract Introduction
Conclusions References
Tables Figures
◭ ◮
◭ ◮
Back Close
Full Screen / Esc
Printer-friendly Version Interactive Discussion
Discussion
P
a
per
|
Discussion
P
a
per
|
Discussion
P
a
per
|
Discussion
P
a
per
|
ical processes involved in the generation of the double-thin layer structure are Kelvin– Helmholtz instability (KHI) or vertically propagating wave breaking, both of which are associated with strong wind shear occurred in a very narrow extent. Strong turbulence mixing is expected to occur in the double-layer structure due to dynamically instabil-ity, which leads to an enhancement of perturbation of the atmospheric refractivity and
5
causes intermittent occurrences of the relatively intense echoes between the two lay-ers. The lower panel of Fig. 7b presents another type of double-thin layer structure that is characterized by temporal merging and separation of the upper and lower thin layers, and shows much finer height-time structure than the original HTI displayed in the upper panel of Fig. 7b. Notice that, being subject to a broad beam width (∼7.4◦) of
10
the Chung–Li VHF radar without CRI capability, the billow structures associated with the KHI will be difficult to identify due to a limitation of poor horizontal resolution that smears the RIM-produced brightness. In order to improve the capability of atmospheric measurement, implementation of the CRI capability on the Chung–Li VHF radar is rec-ommended.
15
5 Conclusions
The Chung–Li VHF radar initiated multifrequency experiment in 2008, giving the capa-bility of range imaging (RIM) for detecting meter-scale atmospheric structures. Plenty of radar data have been collected since then, using different radar parameters such as pulse length, pulse shape, receiver bandwidth, transmitter frequency set, and so on.
20
With these radar data, the RIM technique has been evaluated widely. Various kinds of thin layer structures with thickness of tens of meters were resolved by RIM even though the broad beamwidth of the radar beam may smear the echoing structures. For example, double-thin layer structures having occurrences of intense echoes within the two layers have been resolved for the first time of the Chung–Li VHF radar.
25
AMTD
8, 10097–10120, 2015Range imaging using the Chung-Li VHF
radar
J.-S. Chen et al.
Title Page
Abstract Introduction
Conclusions References
Tables Figures
◭ ◮
◭ ◮
Back Close
Full Screen / Esc
Printer-friendly Version Interactive Discussion
Discussion
P
a
per
|
Discussion
P
a
per
|
Discussion
P
a
per
|
Discussion
P
a
per
|
as the frequency separation of the two frequencies is small. For deriving the optimal range-weighting function, however, the use of seven carrier frequencies with 0.125 MHz frequency step results in much more accurate results than the use of two carrier fre-quencies. In addition, we find that the range/time delays estimated with 2 µs pulse length were much smaller than those of 1 µs pulse length for the Chung–Li radar.
An-5
other remarkable finding is that the longer the operating hours of the radar system is, the larger the range/time delay will be; this feature is presumably attributed to the aging of cable lines or components in the radar system. One more important finding in this study is a visible shift of range error when precipitation echoes are significant, which causes the problem of discontinuity in the RIM-produced brightness at range
10
gate boundaries. We propose in this article a process of point-by-point correction of range error to mitigate the brightness discontinuity to improve the imaging quality of the RIM-produced structures for precipitation environment.
Based on the capability of the RIM technique in resolving fine atmospheric struc-tures, it is expected that RIM can help us to reveal more detailed information on the
15
topics of special atmospheric phenomena, such as tremendously thin layer structure, minute turbulence configuration and spatial precipitation distribution in the radar vol-ume. It is also expected in the future that the RIM technique can be applied to the ionosphere for observing plasma density fluctuations in meteor trail as well as field-aligned plasma irregularities. High resolution at about several meters may reveal the
20
delicate structure of plasma irregularities in more detail, which can hopefully help us to understand the temporal evolution of plasma instability at the very beginning stage.
Acknowledgements. This work was supported by the Ministry of Science and Technology of ROC (Taiwan), Grants MOST103-2111-M-039-001 and MOST104-2111-M-039-001. The Chung–Li VHF radar is maintained by the Institute of Space Science, National Central
Uni-25
AMTD
8, 10097–10120, 2015Range imaging using the Chung-Li VHF
radar
J.-S. Chen et al.
Title Page
Abstract Introduction
Conclusions References
Tables Figures
◭ ◮
◭ ◮
Back Close
Full Screen / Esc
Printer-friendly Version Interactive Discussion
Discussion
P
a
per
|
Discussion
P
a
per
|
Discussion
P
a
per
|
Discussion
P
a
per
|
References
Chen, J.-S. and Zecha, M.: Multiple-frequency range imaging using the OSWIN VHF radar: phase calibration and first results, Radio Sci., 44, RS1010, doi:10.1029/2008RS003916, 2009.
Chen, J.-S., Su, C.-L., Chu, Y.-H., Hassenpflug, G., and Zecha, M.: Extended application of
5
a novel phase calibration method of multiple-frequency range imaging to the Chung–Li and MU VHF radars, J. Atmos. Ocean. Tech., 26, 2488–2500, 2009.
Chen, J.-S., Furumoto, J., and Yamamoto, M.: Three-dimensional radar imaging of atmospheric layer and turbulence structures using multiple receivers and multiple frequencies, Ann. Geo-phys., 32, 899–909, doi:10.5194/angeo-32-899-2014, 2014a.
10
Chen, J.-S., Su, C.-L., Chu, Y.-H., and Furumoto, J.: Measurement of range-weighting function for range imaging of VHF atmospheric radars using range oversampling, J. Atmos. Ocean. Tech., 31, 47–61, 2014b.
Chilson, P. B., Yu, T.-Y., Strauch, R. G., Muschinski, A., and Palmer, R. D.: Implementation and validation of range imaging on a UHF radar wind profiler, J. Atmos. Ocean. Tech., 20,
15
987–996, 2003.
Chilson, P. B.: The retrieval and validation of Doppler velocity estimates from range imaging, J. Atmos. Ocean. Tech., 21, 987–996, 2004
Fernandez, J. R., Palmer, R. D., Chilson, P. B., Häggström, I., and Rietveld, M. T.: Range imaging observations of PMSE using the EISCAT VHF radar: Phase calibration and first
20
results, Ann. Geophys., 23, 207–220, doi:10.5194/angeo-23-207-2005, 2005.
Franke, S. J.: Pulse compression and frequency domain interferometry with a frequency-hopped MST radar, Radio Sci., 25, 565–574, 1990.
Hassenpflug, G., Yamamoto, M., Luce, H., and Fukao, S.: Description and demonstration of the new Middle and Upper atmosphere Radar imaging system: 1-D, 2-D and 3-D imaging of
25
troposphere and stratosphere, Radio Sci., 43, RS2013, doi:10.1029/2006RS003603, 2008. Lee, C. F., Vaughan, G., and Hooper, D. A.: Evaluation of wind profiles from the NERC MST
radar, Aberystwyth, UK, Atmos. Meas. Tech., 7, 3113–3126, doi:10.5194/amt-7-3113-2014, 2014.
Luce, H., Yamamoto, M., Fukao, S., Hélal, D., and Crochet, M.: A frequency radar
interferomet-30
AMTD
8, 10097–10120, 2015Range imaging using the Chung-Li VHF
radar
J.-S. Chen et al.
Title Page
Abstract Introduction
Conclusions References
Tables Figures
◭ ◮
◭ ◮
Back Close
Full Screen / Esc
Printer-friendly Version Interactive Discussion
Discussion
P
a
per
|
Discussion
P
a
per
|
Discussion
P
a
per
|
Discussion
P
a
per
|
Luce, H., Hassenpflug, G., Yamamoto, M., and Fukao, S.: High-resolution vertical imaging of the troposphere and lower stratosphere using the new MU radar system, Ann. Geophys., 24, 791–805, doi:10.5194/angeo-24-791-2006, 2006.
Luce, H., Hassenpflug, G., Yamamoto, M., Fukao, S., and Sato, K.: High-resolution observations with MU radar of a KH instability triggered by an inertia-gravity wave in the upper part of a jet
5
stream, J. Atmos. Sci., 65, 1711–1718, 2008.
Yamamoto, M. K., Fujita, T., Aziz, N. H. B. A., Gan, T., Hashiguchi, H., Yu, T.-Y., and Ya-mamoto, M.: Development of a digital receiver for range imaging atmospheric radar, J. Atmos. Sol.-Terr. Phy., 118, 35–44, 2014.
Palmer, R. D., Yu, T.-Y., and Chilson, P. B.: Range imaging using frequency diversity, Radio Sci.,
10
34, 1485–1496, doi:10.1029/1999RS900089, 1999.
Palmer, R. D., Cheong, B. L., Hoffman, M. W., Fraser, S. J., and López-Dekker, F. J.:
Observa-tions of the small-scale variability of precipitation using an imaging radar, J. Atmos. Ocean. Tech., 22, 1122–1137, doi:10.1175/JTECH1775.1, 2005.
Yu, T. Y. and Brown, W. O. J.: High-resolution atmospheric profiling using combined spaced
an-15
tenna and range imaging techniques, Radio Sci., 39, RS1011, doi:10.1029/2003RS002907, 2004.
Yu, T.-Y., Furumoto, J., and Yamamoto, M.: Clutter suppression for high-resolution atmospheric observations using multiple receivers and multiple frequencies, Radio Sci., 45, RS4011, doi:10.1029/2009RS004330, 2010.
AMTD
8, 10097–10120, 2015Range imaging using the Chung-Li VHF
radar
J.-S. Chen et al.
Title Page Abstract Introduction Conclusions References Tables Figures ◭ ◮ ◭ ◮ Back Close
Full Screen / Esc
Printer-friendly Version Interactive Discussion Discussion P a per | Discussion P a per | Discussion P a per | Discussion P a per |
Table 1.RIM experiments of the Chung–Li VHF radar and calibration results.
Case Exp. date
(hh:mm, UT) Pulse length/shape/code Filter band-width (kHz) Freq set (MHz)/ Freq. No. Sampling time (s) Calibration results
Peak location of phase bias/σz,peak
Rx_1 Rx_2 Rx_3
1 2008/03/30
(17:05–24:00)
2/s 500 fa/5 0.256 320◦/160 m 320◦/180 m 330◦/170 m
2 2008/04/11a
(02:50–04:20)
2/g 250 fa/5 0.256 350◦/260 m 340◦/250 m 350◦/260 m
3 2008/04/11b
(02:50–04:20)
2/s 250 fa/5 0.256 325◦/210 m 340◦/200 m 330◦/210 m
4 2008/04/11c
(02:50–04:20)
2/g 500 fa/5 0.256 340◦/210 m 350◦/210 m 350◦/220 m
5 2008/09/12a
(02:54–05:17)
2/s 250 fa/5 0.256 345◦/220 m 350◦/220 m 350◦/220 m
6 2008/09/12b
(02:54–05:17)
2/s 250 fb/5 0.256 340
◦/220 m 350◦/225 m 350◦/220 m
7 2008/09/12c
(06:12–07:15) 2/s/ 7 bit Barker
500 fa/5 0.32 320
◦/180 m 315◦/160 m 320◦/170 m
8 2009/07/27
(05:30–08:23)
1/T 1000 fd/5 0.512 1180◦/80 m 1180◦/85 m 1200◦/80 m
9 2009/11/09a
(03:08–05:38)
1/g 1000 fe/7 0.1792 1230◦/115 m 1230◦/115 m 1250◦/115 m
10 2009/11/09b
(06:49–08:49)
1/g 1000 ff/7 0.1792 1230◦/115 m 1230◦/115 m 1240◦/120 m
11 2011/12/02
(03:39–05:52)
2/g/over 500 fa/5 0.128 500
◦/210 m 505◦/200 m 505◦/200 m
12 2012/01/05
(02:22–04:56)
2/s/over 500 fa/5 0.128 500
◦/150 m 500◦/150 m 500◦/150 m
13 2012/01/05
(04:59–07:38)
2/s/over 1000 fa/5 0.128 520◦/135 m 520◦/140 m 530◦/140 m
14 2012/08/08a
(05:32–07:02)
2/s/over 500 fc/7 0.1792 610◦/160 m 620◦/160 m 615◦/160 m
15 2012/08/08b
(07:07–08:37)
2/s/over 500 fg/7 0.1792 610◦/150 m 615◦/160 m 615◦/150 m
16 2013/08/21
(00:00–07:00)
1/g 1000 fd/5 0.128 1410
◦/110 m 1420◦/110 m 1410◦/110 m
fa: 51.75, 51.875, 52, 52.125, 52.25 fb: 51.75, 51.8, 52, 52.1, 52.25
fc: 51.75, 51.8, 51.875, 52.0, 52.1, 52.125, 52.25 fd: 51.5, 51.75, 52, 52.25, 52.5
fe: 51.5, 51.6, 51.75, 52, 52.2, 52.25, 52.5 ff: 51.5, 51.75, 51.875, 52, 52.125, 52.25, 52.5
fg: 51.75, 51.833334, 51.916667, 52.0, 52.083333, 52.166666, 52.25
AMTD
8, 10097–10120, 2015Range imaging using the Chung-Li VHF
radar
J.-S. Chen et al.
Title Page
Abstract Introduction
Conclusions References
Tables Figures
◭ ◮
◭ ◮
Back Close
Full Screen / Esc
Printer-friendly Version Interactive Discussion
Discussion
P
a
per
|
Discussion
P
a
per
|
Discussion
P
a
per
|
Discussion
P
a
per
|
Figure 1. (a)Histograms of the calibrated parameters for three independent receiving
chan-nels. Phase bin is 20◦ andσ
z bin is 10 m. The shapes and sizes of the three receiving arrays
are the same.(b)Scatter plot of the calibrated parameters vs. SNR for the second receiving
channel (Rx_2). The curve describing the relationship betweenσzand SNR is a fitting curve for
AMTD
8, 10097–10120, 2015Range imaging using the Chung-Li VHF
radar
J.-S. Chen et al.
Title Page Abstract Introduction Conclusions References Tables Figures ◭ ◮ ◭ ◮ Back Close
Full Screen / Esc
Printer-friendly Version Interactive Discussion Discussion P a per | Discussion P a per | Discussion P a per | Discussion P a per |
720 1080 1440 0
0.5 1
Histogram of phase bias
Phase bias (deg)
Normalized number
50 150 250 350 0
0.5 1
Histogram of σ z
σ z (m)
720 1080 1440 0
0.5 1
Histogram of phase bias
Phase bias (deg)
Normalized number
50 150 250 350 0
0.5 1
Histogram of σ z
σ z (m)
720 1080 1440 0
0.5 1
Histogram of phase bias
Phase bias (deg)
Normalized number
50 150 250 350 0
0.5 1
Histogram of σ z
σ z (m)
720 1080 1440 0
0.5 1
Histogram of phase bias
Phase bias (deg)
Normalized number
50 150 250 350 0
0.5 1
Histogram of σ z
σ z (m)
720 1080 1440 0
0.5 1
Histogram of phase bias
Phase bias (deg)
Normalized number
50 150 250 350 0
0.5 1
Histogram of σ z
σ z (m)
720 1080 1440 0
0.5 1
Histogram of phase bias
Phase bias (deg)
Normalized number
50 150 250 350 0
0.5 1
Histogram of σ z
σ z (m)
720 1080 1440 0
0.5 1
Histogram of phase bias
Phase bias (deg)
Normalized number
50 150 250 350 0
0.5 1
Histogram of σ z
σ z (m)
720 1080 1440 0
0.5 1
Histogram of phase bias
Phase bias (deg)
Normalized number
50 150 250 350 0
0.5 1
Histogram of σ z
σ z (m)
720 1080 1440 0
0.5 1
Histogram of phase bias
Phase bias (deg)
Normalized number
50 150 250 350 0
0.5 1
Histogram of σ z
σ z (m)
720 1080 1440 0
0.5 1
Histogram of phase bias
Phase bias (deg)
Normalized number
50 150 250 350 0
0.5 1
Histogram of σ z
σ z (m)
(a) Two frequencies (b) Three frequencies
(c) Five frequencies (d) Seven frequencies
(51.5, 52.5)
(51.75, 52.25)
(51.875, 52.125)
(52.0, 52.125)
(51.75, 52.0, 52.25)
(51.875, 52.0, 52.125) (51.5, 52.0, 52.5)
(51.5, 51.75, 52.0, 52.25, 52.5)
(51.75, 51.875, 52.0, 52.125, 52.25)
(51.5, 51.75, 51.875, 52.0, 52.125, 52.25, 52.5)
Figure 2.Histograms of the calibrated parameters for different sets of transmitter frequencies,
AMTD
8, 10097–10120, 2015Range imaging using the Chung-Li VHF
radar
J.-S. Chen et al.
Title Page
Abstract Introduction
Conclusions References
Tables Figures
◭ ◮
◭ ◮
Back Close
Full Screen / Esc
Printer-friendly Version Interactive Discussion
Discussion
P
a
per
|
Discussion
P
a
per
|
Discussion
P
a
per
|
Discussion
P
a
per
|
Figure 3. (a)Left panel: high-time intensity with a range resolution of 150 m. Right panel: range
imaging with a range step of 1 m.(b)is similar to(a), but the radar data were collected later on
AMTD
8, 10097–10120, 2015Range imaging using the Chung-Li VHF
radar
J.-S. Chen et al.
Title Page
Abstract Introduction
Conclusions References
Tables Figures
◭ ◮
◭ ◮
Back Close
Full Screen / Esc
Printer-friendly Version Interactive Discussion
Discussion
P
a
per
|
Discussion
P
a
per
|
Discussion
P
a
per
|
Discussion
P
a
per
|
Figure 4.(upper) High-time intensity with a range resolution of 150 m. (middle and bottom)
AMTD
8, 10097–10120, 2015Range imaging using the Chung-Li VHF
radar
J.-S. Chen et al.
Title Page
Abstract Introduction
Conclusions References
Tables Figures
◭ ◮
◭ ◮
Back Close
Full Screen / Esc
Printer-friendly Version Interactive Discussion
Discussion
P
a
per
|
Discussion
P
a
per
|
Discussion
P
a
per
|
Discussion
P
a
per
|
Figure 5. (a)Rain rate measured by the disdrometer located near the radar site. (b) Three
AMTD
8, 10097–10120, 2015Range imaging using the Chung-Li VHF
radar
J.-S. Chen et al.
Title Page
Abstract Introduction
Conclusions References
Tables Figures
◭ ◮
◭ ◮
Back Close
Full Screen / Esc
Printer-friendly Version Interactive Discussion
Discussion
P
a
per
|
Discussion
P
a
per
|
Discussion
P
a
per
|
Discussion
P
a
per
|
Figure 6. (a)Histograms of the calibrated parameters for the radar data used in Fig. 4.(b)
Nor-malized distributions of the calibrated parameters at different range gates. The value attached
AMTD
8, 10097–10120, 2015Range imaging using the Chung-Li VHF
radar
J.-S. Chen et al.
Title Page
Abstract Introduction
Conclusions References
Tables Figures
◭ ◮
◭ ◮
Back Close
Full Screen / Esc
Printer-friendly Version Interactive Discussion
Discussion
P
a
per
|
Discussion
P
a
per
|
Discussion
P
a
per
|
Discussion
P
a
per
|
Figure 7.Two types of double-layer structures observed on 9 November 2009. In(a, b)both, the