CPD
7, 3895–3918, 2011Reconstruction of rainfall in Zafra
M. I. Fern ´andez-Fern ´andez et
al.
Title Page
Abstract Introduction
Conclusions References
Tables Figures
◭ ◮
◭ ◮
Back Close
Full Screen / Esc
Printer-friendly Version Interactive Discussion
Discussion
P
a
per
|
Dis
cussion
P
a
per
|
Discussion
P
a
per
|
Discussio
n
P
a
per
|
Clim. Past Discuss., 7, 3895–3918, 2011 www.clim-past-discuss.net/7/3895/2011/ doi:10.5194/cpd-7-3895-2011
© Author(s) 2011. CC Attribution 3.0 License.
Climate of the Past Discussions
This discussion paper is/has been under review for the journal Climate of the Past (CP). Please refer to the corresponding final paper in CP if available.
Reconstruction of rainfall in Zafra
(southwest Spain) from 1750 to 1840 from
documentary sources
M. I. Fern ´andez-Fern ´andez1, M. C. Gallego1, F. Dom´ınguez-Castro1,
J. M. Vaquero1, J. M. Moreno Gonz ´alez2, and J. Castillo Dur ´an2
1
Departamento de F´ısica, Universidad de Extremadura, Spain
2
Centro de Estudios del Estado de Feria, Zafra, Spain
Received: 28 September 2011 – Accepted: 29 September 2011 – Published: 16 November 2011
Correspondence to: J. M. Vaquero ([email protected])
CPD
7, 3895–3918, 2011Reconstruction of rainfall in Zafra
M. I. Fern ´andez-Fern ´andez et
al.
Title Page
Abstract Introduction
Conclusions References
Tables Figures
◭ ◮
◭ ◮
Back Close
Full Screen / Esc
Printer-friendly Version Interactive Discussion
Discussion
P
a
per
|
Dis
cussion
P
a
per
|
Discussion
P
a
per
|
Discussio
n
P
a
per
|
Abstract
This work presents the first high-resolution reconstruction of rainfall in southwestern Spain during the period 1750–1840. The weather descriptions used are weekly re-ports describing the most relevant events that occurred in the Duchy of Feria. An index was defined to characterise the weekly rainfall. Monthly indices were obtained by sum-5
ming the corresponding weekly indices, obtaining cumulative monthly rainfall indices. The reconstruction method consisted of establishing a linear correlation between the monthly rainfall index and monthly instrumental data (1960–1990). The correlation
co-efficients were greater than 0.80 for all months. The rainfall reconstruction showed
major variability similar to natural variability. The reconstructed rainfall series in Zafra 10
was compared with the rainfall series of Cadiz, Gibraltar and Lisbon for the period 1750–1840, with all four series found to have a similar pattern. The influence of the North Atlantic Oscillation (NAO) on the winter rainfall reconstruction was found to be-have similarly to that of modern times. Other studies described are of the SLP values over the entire North Atlantic in the months with extreme values of rainfall, and unusual 15
meteorological events (hail, frost, storms and snowfall) in the reports of the Duchy of Feria.
1 Introduction
Knowledge of the climate of past centuries is crucial for a proper understanding of our current climate and its changes due to anthropogenic influences (IPCC, 2007). How-20
ever, little is known about the climate prior to the mid-nineteenth century when the first meteorological networks were set up in a number of countries and regions. Studies of past climates contribute significantly to the evaluation of climatic processes before the onset of systematic global human influences. Br ´azdil et al. (2005) categorise the data used in historical climatology as direct or indirect. Direct data may be descrip-25
CPD
7, 3895–3918, 2011Reconstruction of rainfall in Zafra
M. I. Fern ´andez-Fern ´andez et
al.
Title Page
Abstract Introduction
Conclusions References
Tables Figures
◭ ◮
◭ ◮
Back Close
Full Screen / Esc
Printer-friendly Version Interactive Discussion
Discussion
P
a
per
|
Dis
cussion
P
a
per
|
Discussion
P
a
per
|
Discussio
n
P
a
per
|
which reflects the impact of weather on elements of the natural system including the hydrosphere, the cryosphere and the biosphere (Br ´azdil et al., 2005).
In recent decades, there have been many papers published on historical climatology in Europe (Bradley and Jones, 1992; Pfister and Br ´azdil, 1999; Br ´azdil et al., 2005, 2010). A method to reconstruct long rainfall series using systematic descriptive obser-5
vations in weather diaries was developed by Gimmi et al. (2006). This method was used to reconstruct the precipitation in Bern (Switzerland) for the period 17600–2003. For the Mediterranean area, the paper by Diodato (2007) analyses rainfall during the pre-instrumental period 1675–1868 in southern Italy. Alcoforado et al. (2000) recon-structed the temperature and rainfall in southern Portugal during the Late Maunder 10
Minimum (1675–1715). In Spain, the pioneer in historical climatology research was
Manuel Rico Sinobas (1821–1898) who collected climatic information from different
historical archives and created a record of climate patterns in the past. Historical cli-matology in Spain has undergone major growth during the last 20 yr. There have been several attempts to reconstruct rainfall series for various places in Iberia at annual 15
and seasonal scales. These exercises have been based on documentary records be-cause the focus of the few dendroclimate studies in Iberia has been on temperatures (B ¨untgen et al., 2008). Other natural proxies have been considered. Romero-Viana et al. (2011) reconstructed winter rainfall since 1579 AD based on a laminated calcite sed-iment from Lake La Cruz (in eastern-central Iberia). A reconstruction of annual rainfall 20
since 1500 AD for Andalusia (southern Iberia) was performed by Rodrigo et al. (1999) using documentary data. Later, Rodrigo and Barriendos (2008) studied the seasonal and annual rainfall variability over the Iberian Peninsula (IP) during the 16th–20th cen-turies from extreme events reported in documentary sources. However, there has as yet been no reconstructed monthly rainfall series.
25
The coverage of Iberia in these studies has been irregular, despite the Peninsula’s
great climatic variability. Most works devoted to considering different regions of Iberia
have been biased towards Andalusia (southern Iberia) (Rodrigo et al., 1995; Rodrigo,
CPD
7, 3895–3918, 2011Reconstruction of rainfall in Zafra
M. I. Fern ´andez-Fern ´andez et
al.
Title Page
Abstract Introduction
Conclusions References
Tables Figures
◭ ◮
◭ ◮
Back Close
Full Screen / Esc
Printer-friendly Version Interactive Discussion
Discussion
P
a
per
|
Dis
cussion
P
a
per
|
Discussion
P
a
per
|
Discussio
n
P
a
per
|
in western Spain (especially the region of Extremadura) has received little attention until now.
In this paper, we present the first high-resolution reconstruction of rainfall series in the IP during the period 1750–1840 using documents related to the administration of the Duchy of Feria, a territory around the town of Zafra (SW Spain). These documents 5
are conserved in the Zafra Municipal Archive.
2 Data
The territory that corresponded to the Duchy of Feria is located in the southwest of the IP. In the 18th century, it consisted of sixteen municipalities located in two separate, but close, geographical areas (Fig. 1). The main region corresponded to 14 of these 10
municipalities including the capital of the Duchy, the town of Zafra and the other smaller region to just two municipalities. In 1567, the fifth Count of Feria was raised to the rank of duke and grandee due to his contributions to the state under Spain’s King Felipe II. One consequence was a major modernization of the town of Zafra, including the transformation of the old castle into a Renaissance style palace. Later, in the 17th 15
century, the Dukedom of Feria was united with the Marqueeship of Priego, and finally, in the 18th century, also with the Dukedom of Medinacelli. While Zafra was an industrial and commercial town, the surrounding areas were mainly dedicated to agriculture, in particular, cereal production.
The climate of Zafra is classified as Koppen type Csa (temperate with dry or hot 20
CPD
7, 3895–3918, 2011Reconstruction of rainfall in Zafra
M. I. Fern ´andez-Fern ´andez et
al.
Title Page
Abstract Introduction
Conclusions References
Tables Figures
◭ ◮
◭ ◮
Back Close
Full Screen / Esc
Printer-friendly Version Interactive Discussion
Discussion
P
a
per
|
Dis
cussion
P
a
per
|
Discussion
P
a
per
|
Discussio
n
P
a
per
|
2.1 Documentary proxy data
The weather descriptions used in this work are weekly reports submitted to the Duke describing the most relevant events occurring in his lands. Sometimes, these reports are more frequent due to problems or urgent tasks. They span the period from 1750 to 1840. They are conserved in a specific section denominated “Consultas y Decretos 5
del Ducado de Feria” of Zafra’s Municipal Archive.
In the early eighteen century, the Duke of Medinacelli had inherited the rights of the House of the Duchy of Feria. Living in Madrid, the capital of Spain, the Duke estab-lished an administrative framework in the Duchy for the management of his property. Beginning in 1750, an accountant informed him every week about events in the Duchy 10
of Feria. News about the weather was especially relevant for the Duke because it
affected how he had to manage the purchase and sale of cereal grains and other
prod-ucts from Madrid. In particular, knowledge of the weather conditions was essential to estimating the quality of the crops and to the correct management of the trade of cereals and other agricultural products. The accountant lived in Zafra, so that the me-15
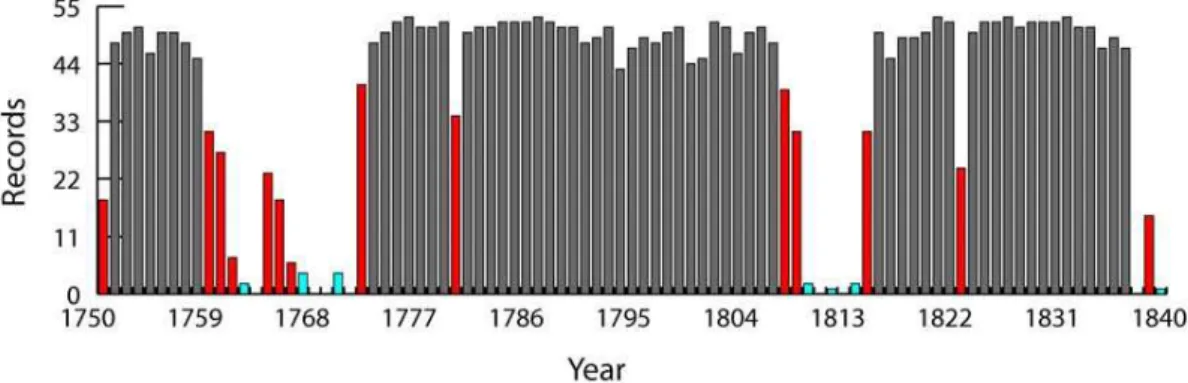
teorological information appearing in the documents mainly refers to this town. Only on special occasions, generally when extreme events have occurred, does one find weather information for other locations. Thus, weather information about Zafra appears in 84 of the years between 1750 and 1840. Figure 2 shows the number of available weekly reports per year containing weather information. There are two important gaps 20
in the series: the decade of the 1760s and the early 1770s, and the period 1810–1814 (Fig. 2). These gaps are due to changes in the accountants, who limited themselves to informing the Duke about economic matters in the Duchy of Feria and about the Napoleonic Wars in Iberia, respectively. In summary, there are weather reports for more than 80 % of the weeks of the year for 63 of the 84 yr with reports available (grey 25
CPD
7, 3895–3918, 2011Reconstruction of rainfall in Zafra
M. I. Fern ´andez-Fern ´andez et
al.
Title Page
Abstract Introduction
Conclusions References
Tables Figures
◭ ◮
◭ ◮
Back Close
Full Screen / Esc
Printer-friendly Version Interactive Discussion
Discussion
P
a
per
|
Dis
cussion
P
a
per
|
Discussion
P
a
per
|
Discussio
n
P
a
per
|
2.2 Instrumental data
We used instrumental rainfall data from the station located in Zafra to reconstruct the rainfall during the period 1750–1840. These data were obtained from Spain’s
Meteo-rology Agency (AEMET). The geographical coordinates of the station are 38◦25′40” N,
6◦24′27” W, 530 m a.s.l. The station has instrumental rainfall data from 1911, but with
5
gaps from 1913 to 1926 and from 1990 to 1997. The RHtestV2 software package (Wang, 2003) was used to test the homogeneity of the rainfall data for the period
1926–2007. This test is based on the penalized maximal t (Wang et al., 2007) and
the penalized maximalF (Wang, 2008a) tests embedded in a recursive testing
algo-rithm (Wang, 2008b). The results showed there to exist a changepoint in this data 10
series in 1958. Therefore, the period 1960–1990 was chosen for the reconstruction due to the homogeneity of its data.
3 Data analysis
3.1 The Feria Rainfall Index
The first step in the reconstruction process was to establish a weekly rainfall index 15
from the reports. To this end, we defined three different categories with the following
criteria: (a) an index value 0 was assigned to a week with no rainfall; (b) an index value 1 was assigned to a week when the report indicated rainfall on at least one day; and (c) an index value 2 was assigned when a report indicated continual rainfall for the week or heavy rain on at least two days.
20
Monthly cumulative rainfall indices were obtained by summing the corresponding weekly indices. Since most months had four full reports and a report that corresponded to two months, in these cases the value of the index was estimated proportional to the days belonging to each month. There were 43 months with weather information for only one week of the month. These months were removed from the data series for the 25
CPD
7, 3895–3918, 2011Reconstruction of rainfall in Zafra
M. I. Fern ´andez-Fern ´andez et
al.
Title Page
Abstract Introduction
Conclusions References
Tables Figures
◭ ◮
◭ ◮
Back Close
Full Screen / Esc
Printer-friendly Version Interactive Discussion
Discussion
P
a
per
|
Dis
cussion
P
a
per
|
Discussion
P
a
per
|
Discussio
n
P
a
per
|
Figure 3 shows the monthly time series of the reconstructed index with the values for each month. In general, the series shows high inter-annual variability. As expected, the months of the winter half of the year (in particular, the six months from November to April, inclusive) present high values of the index, and the summer months low values, especially the two central summer months of July and August (with values close to 5
zero). No clear trends appear in the monthly indices, although one notes that the values of the indices are higher in the central portion of the record (1770–1810) than in the last portion.
Figure 4 shows histograms of the distribution of the frequencies of the monthly rainfall index. The highest index value (8) is only found in January, March, April, November, 10
and December. A high frequency of index 0 is observed in the summer months. It is interesting to note that in April the index 0 appears in only two cases throughout the period of study. This indicates that there was rainfall in almost all the months of April.
3.2 Rainfall reconstruction
Our methodological approach to reconstruction was to establish a linear correlation 15
between the monthly rainfall index and monthly instrumental data. First, we calculated the percentiles from 1 to 99 of the index series for each month, and the same using the instrumental data for each month corresponding to the period 1960–1990 at the Zafra meteorological station. We then performed a linear correlation study between these two sets of percentiles, setting a significance level of 5 %. The resulting correlation co-20
efficients were greater than 0.80 for all months, with the highest values corresponding
to January (0.9782), February (0.9711), November (0.9818), and December (0.9695) and the lowest to the summer months, June (0.8374), July (0.8847), August (0.8344), and September (0.8744). The best linear fit for each month was used to estimate the monthly rainfall (expressed in millimetres).
CPD
7, 3895–3918, 2011Reconstruction of rainfall in Zafra
M. I. Fern ´andez-Fern ´andez et
al.
Title Page
Abstract Introduction
Conclusions References
Tables Figures
◭ ◮
◭ ◮
Back Close
Full Screen / Esc
Printer-friendly Version Interactive Discussion
Discussion
P
a
per
|
Dis
cussion
P
a
per
|
Discussion
P
a
per
|
Discussio
n
P
a
per
|
4 Results
The values of our rainfall reconstruction from 1750 to 1840 in Zafra are shown in Fig. 5. The average rainfall in each season is plotted in Fig. 5a, b, c and d, and the monthly rainfall series in Fig. 5e where the red line represents a 12-month moving average. The great variability observed in this reconstructed rainfall series is similar to the natural 5
variability of rainfall in this region. We identified two wet periods (from 1782 to 1789 and from 1799 to 1807) and two dry periods (from 1796 to 1798 and from 1816 to 1819).
In the first of these wet periods, 1782–1789, the main contributions to rainfall ap-peared in winter, autumn and spring. Specifically, the seasons that reached the highest 10
values were the winters of 1784 and 1785 (Fig. 5a). The seasonal average rainfall in these years was 172.2 mm and 194.8 mm, respectively. The years that presented the highest values in autumn (Fig. 5b) were 1783 (118.7 mm) and 1786 (120.5 mm), and in spring (Fig. 5c) were 1784 (136.2 mm) and 1785 (122.3 mm).
During the second of the wet periods, from 1801 to 1807, the main contributions 15
to the rainfall appeared in winter and autumn. Specifically, the years that presented the highest values in winter were 1800 and 1804, with average rainfall of 164.6 mm and 154.6 mm, respectively. In autumn, the years that reached the highest values of average rainfall were 1799 (122.4 mm), 1802 (113.0 mm), and 1803 (126.0 mm).
In the dry period 1796–1798, there were low values of rainfall in winter, autumn, and 20
spring. In particular, the lowest of these values corresponded to the winter of 1798, the autumn of 1797, and the springs of 1796 and 1797. In the other dry period, 1816–1819, there were low values of rainfall in all seasons.
By way of comparison of these results with other reconstructions in the literature for this geographical area, the results of Rodrigo et al. (1999, 2000) for Andalusia 25
CPD
7, 3895–3918, 2011Reconstruction of rainfall in Zafra
M. I. Fern ´andez-Fern ´andez et
al.
Title Page
Abstract Introduction
Conclusions References
Tables Figures
◭ ◮
◭ ◮
Back Close
Full Screen / Esc
Printer-friendly Version Interactive Discussion
Discussion
P
a
per
|
Dis
cussion
P
a
per
|
Discussion
P
a
per
|
Discussio
n
P
a
per
|
4.1 Comparison with rainfall in Gibraltar, Cadiz, and Lisbon
In order to check the reliability of our reconstruction, we compared the rainfall in Zafra, Lisbon, Cadiz and Gibraltar in the current period and during the period 1750–1840 (Fig. 6). All series are located in the southwest of Iberia (see Fig. 1) and have similar patterns of rainfall (Serrano et al., 1999) mainly influenced by the NAO (Zorita et al., 5
1992; Trigo et al., 2002; Gallego et al., 2005). Figure 6a shows the annual rainfall at these stations in the reference period (1960–1990). As expected, the pattern is similar in all four.
For the period 1750–1840, Cadiz has instrumental monthly rainfall data available from 1805 (Barriendos et al., 2002), Gibraltar from 1813 (Wheeler, 2007) and Lisbon 10
from 1816 (Trigo, 2009), but with a gap from 1826 to 1835. The total annual rainfall in Zafra, Cadiz, Gibraltar and Lisbon in the period common to all the series (1817–1826) can be seen in Fig. 6b. As in the modern period, all four series have a similar pattern.
Although a detailed analysis revealed minor differences between the modern and
his-torical periods, in general the quality and reliability of our reconstruction is confirmed 15
by this reproduction of the rainfall pattern for the southwest of the IP.
4.2 Relationship between the rainfall and NAO indices
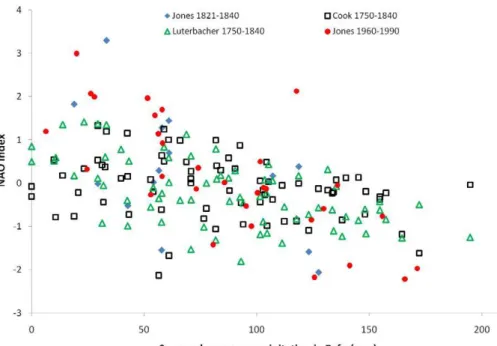
The NAO plays an important role in determining winter rainfall over the IP. We stud-ied the potential relationship of our reconstruction with the NAO index using two NAO reconstructions (Luterbacher et al., 2002a; Cook et al., 2002) and the classical NAO 20
instrumental index (Jones et al., 1997). The results for the relationship between the average winter rainfall in Zafra and the NAO index are shown in Fig. 7. The solid sym-bols (discs and diamonds) indicate the relationships corresponding to the instrumental values compiled by Jones et al. (1997) for the modern period (1960–1990; red discs) and for the historical period (1821–1840; blue diamonds). The open symbols (squares 25
CPD
7, 3895–3918, 2011Reconstruction of rainfall in Zafra
M. I. Fern ´andez-Fern ´andez et
al.
Title Page
Abstract Introduction
Conclusions References
Tables Figures
◭ ◮
◭ ◮
Back Close
Full Screen / Esc
Printer-friendly Version Interactive Discussion
Discussion
P
a
per
|
Dis
cussion
P
a
per
|
Discussion
P
a
per
|
Discussio
n
P
a
per
|
the NAO index reconstructions of Luterbacher et al. (2002a) (green triangles) and Cook et al. (2002) (black squares).
In general, the reconstructed indices present a weaker signal for these winter rainfall values than the instrumental index. Also, the reconstructed NAO indices are fairly insensitive to extreme rainfall values. In particular, the extreme values of rainfall in 5
Zafra for the period 1750–1840 are well connected with the instrumental NAO index, but not with the reconstructed NAO indices. Our rainfall reconstruction could, therefore, help improve the NAO reconstruction for this period.
4.3 Anomalies of Sea Level Pressure over the eastern North Atlantic and Europe for the period 1750–1840
10
In the previous section, it was noted that the reconstructed NAO indices do not repro-duce the extreme rainfall values for the period 1750–1840 very well. We, therefore, performed a study of the Sea Level Pressure (SLP) fields associated with our recon-structed extreme values.
To this end, we used the SLP database developed by Luterbacher et al. (2002b). SLP 15
anomalies relative to the average SLP value in the period 1750–1840 were calculated for the winter months (December, January, February) which had rainfall values above the 95th percentile (Fig. 8, left column) or below the 5th percentile (Fig. 8, right column). One observes that negative SLP anomalies around southwestern Europe with an an-ticyclonic circulation over the eastern Atlantic at high latitudes correspond to the winter 20
months with rainfall values above the 95th percentile (left column, Fig. 8). Indeed, this synoptic situation is described by Zorita et al. (1992) as being associated with greater rainfall over the IP. The maps of the winter months with rainfall below the 5th percentile (right column in Fig. 8), show positive SLP anomalies around southwestern Europe. The low-pressure system is displaced to high latitudes, leaving the Iberian Peninsula 25
CPD
7, 3895–3918, 2011Reconstruction of rainfall in Zafra
M. I. Fern ´andez-Fern ´andez et
al.
Title Page
Abstract Introduction
Conclusions References
Tables Figures
◭ ◮
◭ ◮
Back Close
Full Screen / Esc
Printer-friendly Version Interactive Discussion
Discussion
P
a
per
|
Dis
cussion
P
a
per
|
Discussion
P
a
per
|
Discussio
n
P
a
per
|
4.4 Other weather phenomena
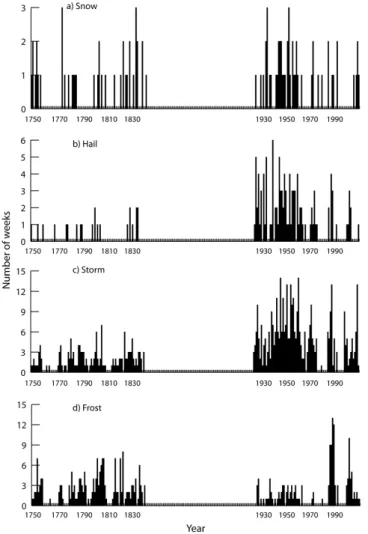
In addition to the exhaustive records of rainfall that we have studied above, the reports of the Duchy of Feria included descriptions of such meteorological events as hail, frost, storms and snowfall. These events may have a major influence on crops, although this will largely be determined by the time of year when they occur. A storm in May, 5
for example, could seriously affect the grain harvest, while the same storm in August
would be innocuous. Figure 9 shows, for the period 1750–1840, the number of weeks in each year in which (a) it snowed, (b) it hailed, (c) there were storms, and (d) it froze. We have also included the period 1926–2007 using the information from the Zafra meteorological station taken from AEMET. Note that the weekly weather reports 10
sometimes do not indicate the actual number of days on which these different events
occurred, so that it was impossible to construct daily series.
Snow is an infrequent weather event in the climate of Zafra. There were reports of snow for 28 of the 84 yr in the documents. The years of most weeks with snow reports were 1774 and 1832 (3 weeks per year). In the period 1800–1840, the accoun-15
tants recorded 15 yr with snowfall. Particularly remarkable was a snowfall recorded on 4 February of 1827 in both Cadiz and Zafra (Gallego, 2007). The years in which the accountant recorded most weeks with hail were 1804, 1831, 1836 and 1837 (two weeks per year). In the 84 years with weather descriptions, there were 38 yr with storm reports, mainly recorded in the summer months, and 64 yr with frost reports.
20
One observes in Fig. 9 that the modern series has a data gap. This corresponded to dates from May 1990 to May 1997. In general, the series do not appear to be homo-geneous, even in the modern period (observe, for example, the great variability in the modern frost series). Comparing the historical and the modern period, one sees that
the variability and average number of weeks for each weather event type differ
consid-25
CPD
7, 3895–3918, 2011Reconstruction of rainfall in Zafra
M. I. Fern ´andez-Fern ´andez et
al.
Title Page
Abstract Introduction
Conclusions References
Tables Figures
◭ ◮
◭ ◮
Back Close
Full Screen / Esc
Printer-friendly Version Interactive Discussion
Discussion
P
a
per
|
Dis
cussion
P
a
per
|
Discussion
P
a
per
|
Discussio
n
P
a
per
|
5 Conclusions
No previous historical climatology study of the Iberian Peninsula has considered the characteristics of the historical climate of southwestern Spain in any detail. Here, we here described a reconstruction of rainfall in southwestern Spain during the period 1750–1840 from a homogeneous source of weather descriptions in the town of Zafra, 5
achieving a particularly fine resolution. The reconstructed rainfall data are available at: http://salva-sinobas.uvigo.es. The results revealed two wet periods (from 1782 to 1789 and from 1799 to 1807), and two dry periods (from 1796 to 1798 and from 1816 to 1819). Comparison of the reconstructed rainfall series with the existing instrumen-tal series in southwest Iberia confirmed the reliability and quality of the reconstructed 10
series.
Winter rainfall in Zafra is largely influenced by the atmospheric circulation in the North-Atlantic region. We showed that published reconstructed NAO indices are not entirely consistent with the extreme values of rainfall in southwest Iberia for the period 1750–1840. Therefore, given the location and the quality of our series, it could help to 15
improve the reconstruction of the NAO index for this period. From a wider perspective, we then studied the SLP anomalies over the North Atlantic region corresponding to the months with extreme values of rainfall (below the 5th and above the 95th percentiles) in our reconstruction. The results showed typical synoptic situations that cause extreme rainfall in the southwestern Iberian Peninsula. Our rainfall reconstruction is, therefore, 20
sufficiently precise to be compatible with the published reconstructed SLP fields
(Luter-bacher et al., 2002b) even in the more extreme cases.
Acknowledgements. The authors are grateful to M. J. Alcoforado and D. Wheeler who provided the rainfall data for Lisbon and Gibraltar used in Fig. 6. Support from the Junta de Extremadura, Spain’s Science and Innovation Ministry (AYA2008-04864/AYA and AYA2011-25945), and 25
CPD
7, 3895–3918, 2011Reconstruction of rainfall in Zafra
M. I. Fern ´andez-Fern ´andez et
al.
Title Page
Abstract Introduction
Conclusions References
Tables Figures
◭ ◮
◭ ◮
Back Close
Full Screen / Esc
Printer-friendly Version Interactive Discussion
Discussion
P
a
per
|
Dis
cussion
P
a
per
|
Discussion
P
a
per
|
Discussio
n
P
a
per
|
References
AEMET-IM: Iberian Climate Atlas (Madrid: Agencia Estatal de Meteorolog´ıa and Instituto de Meteorologia), 2011.
Alcoforado, M. J., de F. Nunes, M., Garcia, J. C., and Taborda, J. P.: Temperature and precipita-tion reconstrucprecipita-tion in southern Portugal during the Late Maunder Minimum (AD 1675–1715), 5
Holocene, 10, 333–340, 2000.
Bradley, R. S. and Jones, P. D. (Eds.): Climate Since A.D. 1500, Routledge, London and New York, 679 pp., 1992.
Br ´azdil, R., Pfister, C., Heinz, W., Storch, H. V., and Luterbacher, J.: Historical climatology in Europe- the state of the art, Climatic Change, 70, 363–430, 2005.
10
Br ´azdil, R., Dobrovoln´y P., Luterbacher, J., Moberg A., Pfister, A., Wheeler, D., and Zorita, E.: European clmate of the past 500 years: new challenges for historial climatology, Climatic Change, 101, 7–40, 2010.
Barriendos, M., Mart´ın-Vide, J., Pe ˜na, J. C., and Rodr´ıguez, R.: Daily Meteorological Observa-tions in C ´adiz – San Fernando. Analysis of the Documentary Sources and the Instrumental 15
Data Content (1786–1996), Climatic Change, 53, 151–170, 2002.
B ¨untgen, U., Frank, D., Grudd, H., and Esper, J.: Long-term summer temperature variations in the Pyrenees, Clim. Dynam., 31, 615–631, 2008.
Cook, E. R., D’Arrigo, R. D., and Mann, M. E.: A Well-Verified, Multiproxy Reconstruction of the Winter North Atlantic Oscillation Index since A.D. 1400, J. Climate, 15, 1754–1764, 2002. 20
Diodato, N.: Climatic fluctuations in southern Italy since the 17th century: reconstruction with precipitation records at Benevento, Climatic Change, 80, 411–431, 2007.
Gallego, D., Garcia-Herrera, R., Calvo, N., and Ribera, P.: A new meteorological record for C ´adiz (Spain) 1806–1852: Implications for climatic reconstructions, J. Geophys. Res., 112, D12108, doi:10.1029/2006JD008272, 2007.
25
Gallego, M. C., Garc´ıa, J. A., and Vaquero, J. M.: The NAO signal in daily rainfall series over the Iberian Peninsula, Clim. Res., 29, 103–109, 2005.
Gimmi, U., Luterbacher, J., Pfister, C., and Wanner H.: A method to reconstruct long precipita-tion series using systematic descriptive observaprecipita-tions in weather diaries: the example of the precipitation series for Bern, Switzerland (1760–2003), Theor. Appl. Climatol., 87, 185–199, 30
2006.
Assess-CPD
7, 3895–3918, 2011Reconstruction of rainfall in Zafra
M. I. Fern ´andez-Fern ´andez et
al.
Title Page
Abstract Introduction
Conclusions References
Tables Figures
◭ ◮
◭ ◮
Back Close
Full Screen / Esc
Printer-friendly Version Interactive Discussion
Discussion
P
a
per
|
Dis
cussion
P
a
per
|
Discussion
P
a
per
|
Discussio
n
P
a
per
|
ment Report of the Intergovernmental Panel on Climate Change, 2007.
Jones, P. D., J ´onsson, T., and Wheeler, D.: Extension to the North Atlantic Oscillation using early instrumental pressure observations from Gibraltar and South-West Iceland, Int. J. Cli-matol., 17, 1433–1450, 1997.
Luterbacher, J., Xoplaki, E., Dietrich, D., Jones, P. D., Davies, T. D., Portis, D., Gonzalez-5
Rouco, J. F., von Storch, H., Gyalistras, D., Casty, C., and Wanner, H.: Extending North Atlantic Oscillation Reconstructions Back to 1500, Atmos. Sci. Lett., 2, 114–124, doi:10.1006/asle.2001.0044, 2002a.
Luterbacher, J., Xoplaki, E., Dietrich, D., Rickli, R., Jacobeit, J., Beck, C., Gyalistras, D., Schumtz, C., and Wanner, H.: Reconstruction of Sea Level Pressure fields over the Eastern 10
North Atlantic and Europe back to 1500, Clim. Dynam., 18, 545–561, doi:10.1007/s00382-001-0196-6, 2002b.
Mart´ın-Vide, J. and Barriendos, M.: The use of rogation ceremony records in climatic recon-struction: a case study from Catalonia (Spain), Climatic Change, 30, 201–221, 1995. Mart´ın-Vide, J. and Barriendos, M.: Secular climatic oscillations as indicated by catastrophic 15
floods in the Spanish Mediterranean coastal area (14th–19th centuries), Climatic Change, 38, 473–491, 1998.
Pfister, C., Br ´azdil, R., Glaser, R., Bokwa, A., Holawe, F., Limanowka, D., Kotyza, O., Munzar, J., R ´acz, L., Str ¨ommer, E., and Schwarz-Zanetti, G.: Daily weather observations in sixteen-thcentury Europe, Climatic. Change, 43, 111–150, 1999.
20
Rodrigo, F. S.: A new method to reconstruct low-frequency climatic variability from documentary sources: application to winter rainfall series in Andalusia (Southern Spain) from 1501 to 2000, Climatic Change, 87, 471–487, 2008.
Rodrigo, F. S. and Barriendos, M.: Reconstruction of seasonal and annual rainfall variability in the Iberian peninsula (16th–20th) from documentary data, Global Planet. Change, 63, 25
243–257, 2008.
Rodrigo, F. S., Esteban Parra, M. J., and Castro Diez, Y.: Reconstruction of Total Annual Rain-fall in Andalusia (Southern Spain) During the 16th and 17th Centuries from Documentary Sources, Theor. Appl. Climatol., 52, 207–218, 1995.
Rodrigo, F. S., Esteban-Parra, M. J., Pozo-V ´azquez, D., and Castro-D´ıez, Y.: A 500-year pre-30
cipitation record in southern Spain, Int. J. Climatol., 19, 1233–1253, 1999.
CPD
7, 3895–3918, 2011Reconstruction of rainfall in Zafra
M. I. Fern ´andez-Fern ´andez et
al.
Title Page
Abstract Introduction
Conclusions References
Tables Figures
◭ ◮
◭ ◮
Back Close
Full Screen / Esc
Printer-friendly Version Interactive Discussion
Discussion
P
a
per
|
Dis
cussion
P
a
per
|
Discussion
P
a
per
|
Discussio
n
P
a
per
|
Romero-Viana, L., Juli `a, R., Schimmel, M., Camacho, A., Vicente, E., and Miracle, M. R.: Reconstruction of annual winter rainfall since A.D. 1579 in central-eastern Spain based on calcite laminated sediment from Lake La Cruz, Climatic Change, 107, 343–361, doi:10.1007/s10584-010-9966-7, 2011.
Serrano, A., Garc´ıa, J. A., Mateos, V. L., Cancillo, M. L., and Garrido, J.: Monthly Modes of 5
Variation of Precipitation over the Iberian Peninsula, J. Climate, 12, 2894–2919, 1999. Trigo, R. M., Osborn, T. J., and Corte-Real, J. M.: The North Atlantic Oscillation influence on
Europe: climate impacts and associated physical mechanisms, Clim. Res., 20, 9–17, 2002. Trigo, R. M., Vaquero, J. M., Alcoforado, M.-J., Barriendos, M., Taborda, J., Garc´ıa-Herrera, R.,
and Luterbacher, J.: Iberia in 1816, the year without a summer, Int. J. Climatol., 29, 99–115, 10
2009.
Till, C. and Guiot, J.: Reconstruction of precipitation in Morocco sin 1100 AD based onCedrus atlanticatree-ring widths, Quaternary Res., 33, 337–351, 1990.
Wang, X. L.: Detection of Undocumented Changepoints: A Revision of the Two-Phase Regres-sion Model, J. Climate, 16, 3383–3385, 2003.
15
Wang, X. L., Wen, Q. H., and Wu, Y.: Penalized maximal t test for detecting undocu-mented mean change in climate data series, J. Appl. Meteorol. Climatol., 46, 916–931, doi:10.1175/JAM2504.1, 2007.
Wang, X. L.: Penalized maximal F-test for detecting undocumented mean-shifts without trend-change, J. Atmos. Oceanic. Tech., 25, 368–384, 2008a.
20
Wang, X. L.: Accounting for autocorrelation in detecting mean-shifts in climate data series using the penalized maximaltorF test, J. Appl. Meteorol. Climatol., 47, 2423–2444, 2008b. Wheeler, D.: The Gibraltar climatic record: Part 2 Precipitation, Weather, 62, 99–105, 2007. Zorita, E., Kharin, V., and von Storch, H.: The atmospheric circulation and sea surface
temper-ature in the North Atlantic area in winter: their interaction and relevance for Iberian precipi-25
CPD
7, 3895–3918, 2011Reconstruction of rainfall in Zafra
M. I. Fern ´andez-Fern ´andez et
al.
Title Page
Abstract Introduction
Conclusions References
Tables Figures
◭ ◮
◭ ◮
Back Close
Full Screen / Esc
Printer-friendly Version Interactive Discussion
Discussion
P
a
per
|
Dis
cussion
P
a
per
|
Discussion
P
a
per
|
Discussio
n
P
a
per
|
Fig. 4.Histograms of the distribution of frequencies of monthly rainfall indices during the period
CPD
7, 3895–3918, 2011Reconstruction of rainfall in Zafra
M. I. Fern ´andez-Fern ´andez et
al.
Title Page
Abstract Introduction
Conclusions References
Tables Figures
◭ ◮
◭ ◮
Back Close
Full Screen / Esc
Printer-friendly Version Interactive Discussion
Discussion
P
a
per
|
Dis
cussion
P
a
per
|
Discussion
P
a
per
|
Discussio
n
P
a
per
|
Fig. 5. Estimated rainfall in Zafra for the period 1750–1840. The red line is the 12-month
CPD
7, 3895–3918, 2011Reconstruction of rainfall in Zafra
M. I. Fern ´andez-Fern ´andez et
al.
Title Page
Abstract Introduction
Conclusions References
Tables Figures
◭ ◮
◭ ◮
Back Close
Full Screen / Esc
Printer-friendly Version Interactive Discussion
Discussion
P
a
per
|
Dis
cussion
P
a
per
|
Discussion
P
a
per
|
Discussio
n
P
a
per
|
a)
b)
Fig. 6. Rainfall in Zafra, Gibraltar, Cadiz and Lisbon:(a)for the period 1960–1990;(b)for the
CPD
7, 3895–3918, 2011Reconstruction of rainfall in Zafra
M. I. Fern ´andez-Fern ´andez et
al.
Title Page
Abstract Introduction
Conclusions References
Tables Figures
◭ ◮
◭ ◮
Back Close
Full Screen / Esc
Printer-friendly Version Interactive Discussion
Discussion
P
a
per
|
Dis
cussion
P
a
per
|
Discussion
P
a
per
|
Discussio
n
P
a
per
|
Fig. 7. Relation between the average winter rainfall in Zafra and the NAO index. For details
CPD
7, 3895–3918, 2011Reconstruction of rainfall in Zafra
M. I. Fern ´andez-Fern ´andez et
al.
Title Page
Abstract Introduction
Conclusions References
Tables Figures
◭ ◮
◭ ◮
Back Close
Full Screen / Esc
Printer-friendly Version Interactive Discussion
Discussion
P
a
per
|
Dis
cussion
P
a
per
|
Discussion
P
a
per
|
Discussio
n
P
a
per
|
Fig. 8.Maps of average anomalies (%) of Sea Level Pressure for the winter months (December,
CPD
7, 3895–3918, 2011Reconstruction of rainfall in Zafra
M. I. Fern ´andez-Fern ´andez et
al.
Title Page
Abstract Introduction
Conclusions References
Tables Figures
◭ ◮
◭ ◮
Back Close
Full Screen / Esc
Printer-friendly Version Interactive Discussion
Discussion
P
a
per
|
Dis
cussion
P
a
per
|
Discussion
P
a
per
|
Discussio
n
P
a
per
|
Fig. 9. (a)Number of weeks with snowfall.(b)Number of weeks with hail.(c)Number of weeks