Knowledge Management as a Determining Factor in the Retention of Professionals
in the Industry: A Case Study in an Organization in the Furniture Industry
Osmarina Pedro Garcia Garcia†
Universidade Estadual do Oeste do Paraná Sandra Maria ColtreΩ
Universidade Estadual do Oeste do Paraná
ABSTRACT
This study investigates which one(s) of the knowledge management factor(s), via the tacit and/ or explicit way, are crucial in retaining professionals in a company in the furniture industry. The research was exploratory, with lifting procedure, and qualitative and quantitative approach. Data were collected from June to August 2014 in a furniture industry of Francisco Beltrão/PR, through a questionnaire applied to 224 employees of administrative, industrial and commercial areas, as follows: 11 managers, 44 responsible for the area and 169 operational employees. The Likert scale detected the frequency of respondents’ views. To provide consistency to the indings, the data obtained Multivariate Analysis statistical treatment, developed in the free R software. We applied the Main Component Analysis, Factorial Analysis, Correspondence Analysis, Correlation Analysis and Chi-squared Test separately for tacit and explicit ways. After the analysis, we concluded that through the factors shown in the study, both pathways inluence the retention of employees of the surveyed company.
Keywords: Knowledge management. Knowledge management Factors. Tacit and explicit ways.
*Author for correspondence:
†. UNIOESTE - Universidade Estadual do
Oeste do Paraná
Rua Rio de Janeiro 1405, Cascavel – PR CEP 85801-030
E-mail: [email protected]
Ω. Universidade Estadual do Oeste do
Paraná
Rua São Paulo, 500 - Cascavel - Paraná - CEP: 85801-020
E-mail: [email protected]
Note from the Editor: This paper was accepted by Bruno Felix.
1. INTRODUCTION
K
nowledge management has been discussed both in the academic and organizational ields. The rehearshal by Michael Polanyi, in 1962, with the article Tacit Knowing: Its bearing on some problems of philosophy was one of the bases in which Nonaka & Takeuchi (1997) developed in Japanese companies innovative management actions, explained in the book A theory of organizational knowledge creation. The strength of the subject in transforming the individual into collective learning in the organizations maintaining its constant productivity, drew the attention of all.However, studies on knowledge management, so far, have emphasized the explicit knowledge,- that which is formalized in books, systems manuals, reports, spreadsheets, documents repositories of data, etc. - that can be transmitted systematically. Tacit knowledge however, is understood as one that is personal and complex, resulting from experience. It is created by the interaction between tacit knowledge (person) and explicit (result of human action). Tacit, in essence, is practical and is usually the result of a long experience, from a coexistence and an expertise. It has a contextual dimension, evaluative and mutant as it varies from one individual to the other and is linked to the expertise of each individual (NONAKA; TAKEUCHI, 1997).
Tacit knowledge is what is acquired during life. However, it is often discarded by several authors due to it being linked to the intent of the human view that can change from one situation to another and be subjective (NONAKA; TAKEUCHI, 1997). Even though some scholars and managers remain skeptical about the tacit knowledge, it is human perceptions that inluence our decisions. Nowadays it is known that decisions purely by instrumental rationality are not conirm. Such decisions are always permeated by substantive rationality. And if the knowledge is within people, the management of such knowledge by other people, consists of a complex, continuous process that involves the awaereness of the involved.
As a result of globalization, companies are involved in a complex unprecedented volume of information, generating, in turn, a need to create products for current markets and dealing with new competitors, which requires their constant innovation. It is in this context that the development of knowledge management is stimulated; seeking the interaction between employees and company. This interaction should be more consistent every day since turnover costs are high and cause great inconvenience to the pace of organizational productivity. And today, organizations in pursuit of actions that retain the employee, has led them to develop environments and retention programs that were previously unthought-of.
policies and frameworks to keep them there. Many studies show that employees satisied with their work environment contribute efectively to the organization and therefore, identifying how to retain employees has generated many studies. The challenge is to ind out what employees think is important to remain in their workplaces.
In view of these arguments, the study investigated which one(s) of the knowledge management factor(s), via the tacit and/or explicit way, are crucial in retaining professionals in a company in the furniture industry.
2. KNOWLEDGE MANAGEMENT IN ORGANIZATIONS
Ever since the 90’s, knowledge management has become the front oice of management processes. Nonaka & Takeuchi (1995), Davenport & Prusak (1998) and Senge (1999), among others, have produced studies that helped to support what is known as knowledge management. Researchers, consultants and experts in the ield began to encourage existing businesses to consider the creation of knowledge as a source of competitive advantage for its sustainability, aiming at building a learning environment to meet the demands of a society of the postindustrial knowledge. In this context, knowledge organizations emerge, which are those focused on knowledge management, new management behaviors related to sustainability and social responsibility. For Nonaka & Takeuchi (1995), successful organizations are those that: create new knowledge, extensively disseminate them throughout the organization, and rapidly, incorporate them into new products, services and technologies; in addition to improving working conditions for the people who are part of them.
The demand is for a new employee proile that is lexible, multifunctional, able to solve problems and a behavior aimed at the sustainability and humanization of work. The new proile is based on new capabilities and humane attitudes. Frigotto (1998) alleges that the presence of such professional has become more frequent as the world economy began producing more knowledge workers. This worker, through their intellect and knowledge, becomes the target of a new qualiication basis which the globalized world has been demanding in businesses. A new competence is required of workers, which exceeds the performance of tasks with quality and the formal knowledge required for them. As a result, today’s organizations seek professionals who articulate knowledge management, who increasingly centralize their focus on workers’ tacit knowledge.
the company. This positioning is supported by (PROST; RAUB; ROMHARDT, 2007; BROWN; DUGUID, 2001).
In this sense, corporate knowledge is seen as an asset that must be managed by the company seeking to reverse it into organizational proitability improvement. And a proitable enterprise aggregates development to its surroundings because it generates jobs and moves the economy.
2.1. CREATION AND CONVERSION OF ORGANIZATIONAL KNOWLEDGE
The creation and conversion of organizational knowledge is a continuous and dynamic interaction between the conversion of tacit knowledge to explicit knowledge through the four knowledge conversion modes as presented by Takeuchi & Nonaka (2008, p. 23).
1. Socialization: Share and create tacit knowledge through direct experience; 2. Externalization: Articulate tacit knowledge through dialogue and relection; 3. Combination: Systematize and apply explicit knowledge and information; 4. Internalization: Learning and acquiring new tacit knowledge in practice.
Laudon & Laudon (2004, p. 324) report that “As knowledge becomes an essential and strategic asset, organizational success increasingly depends on the compan’s ability to produce, gather, store and disseminate knowledge”. Such a capability is in the people who are part of it and perform the conversion of knowledge. For Nonaka & Takeuchi (1997, p.146), knowledge is created by mid-level management, who are the task force leaders, since they are in the center of the process performing the intersection of information lows of the two hubs. They are considered as the “strategic node that connects the top management to front-line managers”, playing a key role in facilitating the creation of organizational knowledge.
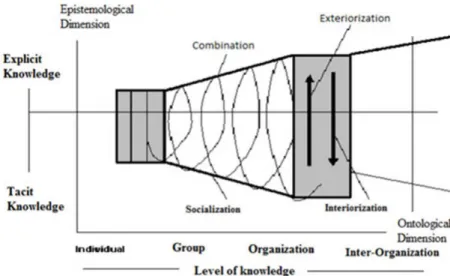
Nonaka & Takeuchi (1997) explain the knowledge conversion process as a spiral, which begins at the individual level and begins lighting up and expanding interaction networks that cross borders between sections, departments, divisions and organizations. The organizational knowledge creation process comprises two dimensions: an ontological (entities creators of knowledge) and the other epistemological (personal knowledge) are represented in a spiral manner as shown in Figure 1.
The ontological one is represented on the horizontal axis and implies organizational knowledge. This dimension comes from the understanding that knowledge is only created by individuals, thus, an organization cannot create knowledge alone, it contributes to the expansion of knowledge created by individuals (NONAKA; TAKEUCHI, 1997).
SOURCE: Nonaka & Takeuchi (1997, p. 82).
Figure 1. Spiral of Organizational Knowledge Creation.
having always as parameters their stages of development and their human limits (NONAKA; TAKEUCHI, 1997).
It is understood that when converting knowledge from the individual into organizational level resulting in socialization, when the process occurs from individual to individual; in externalization, in which the process is from individual to the group; in combination, it occurs from the group to the organization; in internalization, which stems from the organization to the individual, the knowledge spiral emerges.
2.2. KNOWLEDGE MANAGEMENT IN BRAZIL
Knowledge management has contributed efectively to the productivity of Brazilian workers and for the development of national management models. Wood JR, Tonelli & Cooke (2012) argue that large companies have demonstrated concern regarding the moment for people management, in search of business growth, executives eager to attract employees with the appropriate proile to the company’s culture who are willing to socialize and aspire to develop their careers. Teixeira Filho (2000) argues that knowledge has become the most important economic factor in organizations corporate environment, both in global as in Brazilian organizations.
companies to invest in the tacit way, claiming that the expertise of its employees adds economic value to the company. These are experiences that Brazilian companies are gradually applying.
Brazilian companies need to take advantage of the knowledge acquired by studies undertaken in companies abroad and brought to Brazil, as is the case in studies by Polanyi (1962) and Nonaka & Takeuchi (1997), which in addition to the dissemination of knowledge and its identity naturally seek to preserve human values.
2.3. FACTORS OF THE TACIT AND EXPLICIT WAYS
Ever since the studies by Polanyi (1966) on tacit knowledge, an immense set of knowledge was formed on how knowledge can be created, identiied, classiied, disseminated, reused, optimized enhanced and integrated into the organizational culture. For the author, tacit knowledge is pre-relective and develops from direct experience and action. It is inherent to afective, cognitive and motor capabilities, and is diicult to verbalize, for being intrinsically linked to the individual expertise. It is referred to tacit knowledge when indicating that there are things that the human being knows, but cannot express. One only acts based on this knowledge. It is identiied as the dominant principle of all knowledge. And when it is articulated and explained, it ceases to be and is transformed into information to the recipient.
Thus, tacit knowledge is an indispensable part of any knowledge, it is the knowledge that is truly translated into competitive advantage. A fact that makes it diicult to competitors to reproduce. However, tacit knowledge is the basis for the explicit knowledge. And thus, the conversion from tacit to explicit is necessary, in order for the company to understand it, use it, and create new knowledge from it.
In companies the factors of tacit way linked to the human behavior are: management style of leaders; communication systems; interpersonal relationships and; job satisfaction. For Aziz (2014), these factors subsidize knowledge management. On the other hand, the explicit knowledge that which formal, clear, regimented, divided into data, information and models. “[…] explicit knowledge deals with past events and is driven to a theory independent of its context” (NONAKA; TAKEUCHI, 1997, p. 67). For Polanyi (1966) the explicit can be expressed in words, numbers and easily shared, representing only the tip of the iceberg of the set of knowledge as a whole. They can be important to guide decisions.
2.4. RETENTION AND TALENT MANAGEMENT
In the era of knowledge, as important as hiring a talent it is to keep it. The retention of employees includes a set of personnel policies and management practices involving the behavior of managers and the role of human resources. Talent management has the task of managing people, gradually gaining ground and it shows that currently the major diference in the inal result is the person. For Aziz (2014), the maintenance of a good employee culminates with some factors of knowledge management. The employee’s relationship with his superiors is important because it afects the organizational climate and organizational values, that inluences in the employee’s decision to leave or to stay.
For Nakashima (2003), employee retention is inluenced by the attractive features that the company ofers and the reconciliation of organizational and individual objectives. Transparency in communication, participation in events, quality of life and appreciation of the potential are important aspects that retain people.
Companies are not only in search of people to compose their teams, they do not see how talented professionals with potential and capacity to develop themselves and grow within the organization. Prost, Raub & Romhardt (2007) add that, companies must carefully structure processes to select, store and regularly update the acknowledgement of potential value. Organizations seek people who identify with its mission, vision, culture and values to achieve corporate and professional success. Expressions widely used nowadays, such as ierce competition, globalization and instability have become alive in the business world. To this end, in any of these situations the presence of human beings is dismissed (ARAÚJO; GARCIA, 2009).
Thus, it is evident, according to the above authors, the importance of retaining true talents in businesses. However, what are companies ofering in their policies in order to retain talent that obtains this result? Thus, what factors are actually considered key to retaining employees was the reason for this study.
3. MATERIAL AND METHODS
This study was exploratory which according to Gil (2002), aims to deepen our knowledge of the issue at hand to enlarge the view of a particular fact, improving an idea via hypotheses that will be tested. The procedure is the survey type. Gil (2002, p. 70) reports that they:
It was cross sectional comprising the period from June to August 2014, without considering the evolution of data over time (Rouquayrol & Almeida, 2006). The researched factors are related to the tacit and explicit way, as is displayed in Table 1 and 2. The hypotheses of the study were: H1 - the factors of tacit and explicit way retain talent. H2 - only the factors of the explicit way retain talent. H3 - only the factors of the tacit way retain talent. For each airmative hypothesis, there was a negative one.
We considered four factors with 16 variables for the tacit way and seven factors with 24 variables for the explicit way, according to Charts 1 and 2.
Primary data were collected through a questionnaire containing 40 questions regarding the factors of tacit and explicit way. The population consisted of 281 professionals, distributed in 14 irst and second-level managers; 55 in charged employees and 212 operational employees.
For greater consistency, the data were subjected to statistical analysis, through Multivariate Analysis, and for each one of the ways (tacit and explicit) we applied the Principal Component Analysis technique and Factor Analysis. Subsequently, the Correspondence Analysis technique for
Table 1. Spearman Correlation Coeicients of the Set of Tacit Way Variables.
P1 P2 P3 P4 P5 P6 P7 P8
P2 0.795446
P3 0.627712 0.729454
P4 0.525449 0.588736 0.547854
P5 0.40402 0.453013 0.411183 0.468978
P6 0.527208 0.561984 0.513497 0.530782 0.488007
P7 0.519004 0.579571 0.457989 0.581229 0.524031 0.705633
P8 0.538386 0.607154 0.544832 0.525742 0.513333 0.708441 0.750355
P9 0.483165 0.508566 0.49788 0.456115 0.390164 0.582058 0.599717 0.648652
P10 0.483335 0.550597 0.536991 0.491372 0.406267 0.514593 0.521364 0.554643
P11 0.455881 0.498804 0.5079 0.510381 0.453327 0.533251 0.595178 0.592566
P12 0.420677 0.481063 0.484871 0.453037 0.414464 0.529249 0.572124 0.563642 P13 0.500749 0.566134 0.550495 0.502924 0.318076 0.396482 0.468357 0.504071 P14 0.439716 0.539128 0.592153 0.446931 0.269693 0.325215 0.400196 0.447746
P15 0.407016 0.489401 0.450281 0.469714 0.33859 0.367157 0.428516 0.431219
P16 0.423785 0.517764 0.515743 0.405378 0.352315 0.390704 0.419834 0.49341
P9 P10 P11 P12 P13 P14 P15
P10 0.719518
P11 0.651587 0.725063
P12 0.628506 0.678291 0.818168
P13 0.522808 0.658656 0.541881 0.499001
P14 0.466578 0.574513 0.506886 0.557126 0.708252
P15 0.493807 0.558371 0.49902 0.453403 0.639066 0.603086
P16 0.465018 0.573624 0.528253 0.46887 0.596113 0.655876 0.73157
Table 2. Principal components; Proportion of the total variance; explained by the PC; Cumulative proportion of the total variance; Eigenvalue; for the 16 scores.
Principal Component Proportion of the total variance explained
Cumulative proportion of the total variance explained
(Ferreira; 2008: > = 70%)
Eigenvalue (Kaiser’s rule, > 1)
CP1 0.5549 0.5549 2.98
CP2 0.0865 0.6414 1.18
CP3 0.0676 0.7090 1.04
SOURCE: research data, R software (2014).
Chart 1. Factors and variables of the factors of the tacit way.
Factors Variables of the factors
1 - Management style of the leaders
1 - Treatment style with their subordinates. 2 - Incentive for team-working.
3 - Way to awaken the commitment of employees.
4 - Opportunity to participate in the decision-making process.
2 - Communication systems
1 - Noise. 2 - Transparency.
3 - Efectiveness in decision making.
4 - Fluidity between supervisors, teams and colleagues.
3 - Interpersonal relationship
1 - Compliance with standards.
2 - Based on trust and respect for individual values. 3 - For generation of professional information. 4 - Creativity related to teamwork.
4 - Job satisfaction
1 – Organizational climate in the company.
2 - Motivation of balance between personal and business objectives. 3 - Professional recognition.
4 - Appreciation by the market with employment security.
SOURCE: Adapted from Nonaka & Takeuchi (1997); Polanyi (1962); Davenport & Prusak (1998); Klein (1998) and Ribeiro (2006).
each way measured the association between each factor and service time (in the current position and company). As a result, the Canonical Correlation Analysis measured the association between each way (tacit and explicit) versus service time (time in the current position and time in the company). We also developed a contingency table to relate the variables: group 1 (age, gender, level of education, sector and position held) with group 2 (service time in the current position and time of service in the company), through the Chi-square test.
Chart 2. Factors and variables of the factors of the explicit way.
Factors Variables of the factors
1 - Recruitment policies
1 - Form of disseminating vacancies.
2 - Clear exposition of the technical and behavioral proile by the human resource.
3 - The internal recruitment process.
2 - Selection policies
1 - Clear explanation of the vision and business objectives. 2 - Professional growth perspectives.
3 - Appreciation of human competencies.
3 - Training systems
1 - Development courses and personal qualiication.
2 - Internal and external training process.
3 - Financial incentives for participation in training. 4 - Freedom to choose qualifying programs.
4 - Remuneration policies
1 - Salary stimulating factor.
2 - Bonuses policy and other bonuses.
3 - Increased responsibility with inancial recognition. 5 - Beneits policies
1 - Cultural, health and leisure incentives. 2 - Allowance on continued education.
3 - Beneits to family members.
6 - Performance evaluation
1 - Performance evaluation process.
2 - Suggestions and criticism from colleagues. 3 - Incentives for self-development.
4 - Feedback with periodic analysis of the direction.
7 - Promotion systems for career and position.
1 - Transparency in the career rise in the position. 2 - Opportunity to receive a promotion.
3 - Personal appreciation in professional growth. 4 - Incentives to take on top position.
SOURCE: Adapted from Nonaka & Takeuchi (1997); Polanyi (1962); Davenport & Prusak (1998); Klein (1998) and Ribeiro (2006).
For the use of the techniques mentioned, it is recommended by Meyers, Gamst & Guarino (2013) that the sample should be at least ive times and at the most ten times the amount of variables in the research, implying a minimum of 200 responses. The number of variables is 40 (questions of the questionnaire), which multiplied by ive - which is the minimum desired- we obtain the amount 200 responses. For a population of 281 employees, were obtained 224 responses, which represents 5.6 times the multiplication of the 40 variables, becoming the research sample; which gives consistency to the data considering that it is beyond the minimum required for validation. The sample became consistent, representative, reliable and unbiased, with: 11 managers, 44 sector-in charged employees 169 operational employees. There was a 100% return of questionnaires.
The presentation includes the dimensions: Tacit Way and Explicit Way. We applied the techniques to both ways: Principal Component Analysis - PCA; Factor Analysis - FA; Chi-square Test; Correspondence Analysis - CA and Canonical Correlation Analysis - CCA.
4.1. TACIT WAY
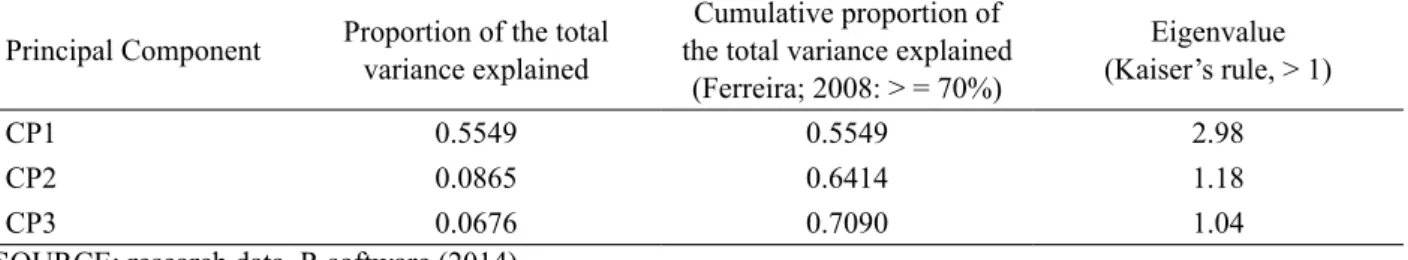
At this stage, for the factors of the tacit way mentioned in Chart 1, we found that for all values of the Spearman correlation coeicient were signiicant at 5% (p-value < 0.05). The variables formed three groups of principal components.
From the PCA presented in Table 1, we selected three principal components, termed as PC1, PC2 and PC3. We can observe that PC1 accounted for the highest percentage of explanation of the total variability of scores for the 16 survey questions representing the tacit way which forms (55.49%), followed by PC2 (8.65%) and PC3 (6.76%), as shown in Table 2.
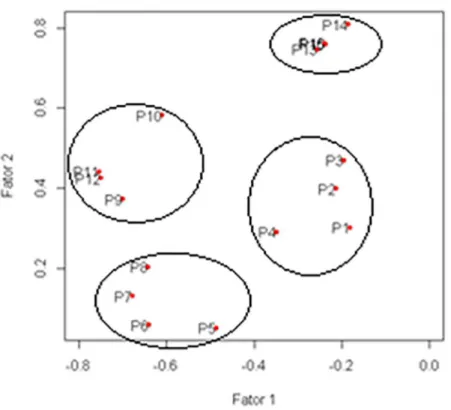
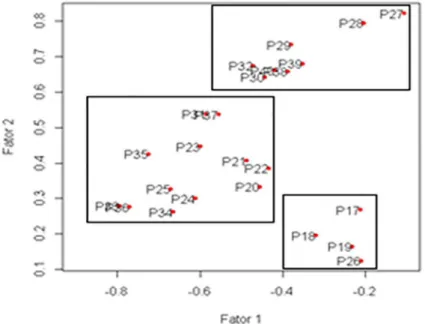
By using the technique of principal components, along with the factor analysis and varimax rotation to deine the groups of questions, with similar scores in relation to the total surveyed employees. Figure 2 shows the factor loadings for the formation of the irst two common factors, being the most signiicant ones, as shown in Table 2, each of whom represents the percentage of 55.49% and 8.65% of the total data variability.
Through the irst two common factors, we observed a clustering of questions divided into four groups. They are inserted in the factors: management style of the leaders, communication systems, interpersonal relationships and job satisfaction. We found that the employees in general have similar perception among the four factors of the tacit way. Through Figure (3-a) we can observe that PC1 represents 55.49% of the total data variability. Therefore, it is the PC responsible for the highest percentage of explanation of the total scores variability. Formed by the inluence of the variables of the factors: management style of leadership and interpersonal relationships, which obtained similar scores.
Figure 2. Scatter plot of factor loadings of each question, applying in the factor analysis the varimax rotation.
SOURCE: research data, R software (2014).
(a) (b)
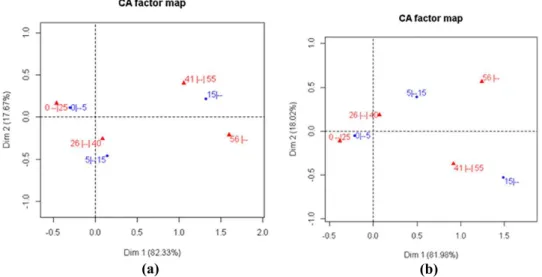
Figure 3. Biplot graph for each PC pair - PC1; PC2 and PC3.
SOURCE: research data, R software (2014).
With the formation of the three PCs, we found that employees have similar perceptions among all the factors of the tacit way, and this denotes that the questions are inserted correctly in their proper factors.
formation of the three PCs the association between one and the other factor successively occurred, with none being left without an association. Forming groups of two consecutive associated factors.
4.1.1. EXPLICIT WAY
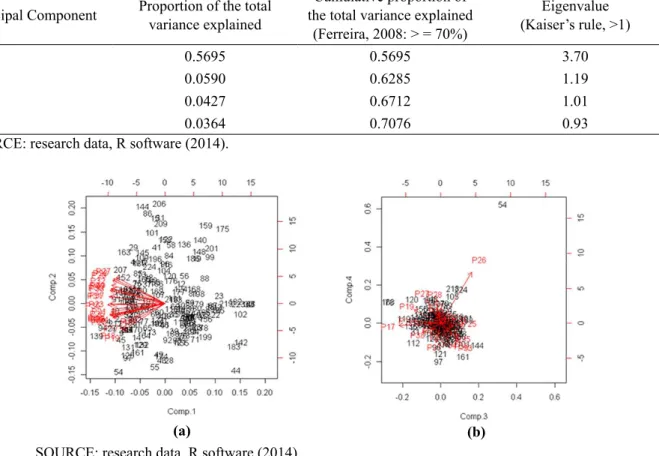
Similarly, for the explicit way factors mentioned in Table 2, we observed that for all values of the Spearman correlation coeicient were signiicant at 5% (p-value < 0.05). For the variables (questions of the questionnaire) of this way, we formed four groups of principal components- PCs., which are speciied in Table 3.
Through Table 4, we can observe that the PC1 was responsible for the highest percentage of the total scores variability for 24 questions of the explicit way (56.95%), followed by PC2 (5.90%), PC3 (4.27%) and PC4 (3.64%).
Table 4 shows the principal components (PCs); proportion of the total variance of the 24 scores, explained by each PC; cumulative proportion of the total variance of the 24 scores, explained by the PCs and the eigenvalue of each PC.
PC1 consisted of higher factor load, 56.95%, represented by the variables of the factors: selection policies, remuneration policies, beneits policies, training systems, performance evaluation, promotion systems in the career and position.
Figure (4-a) demonstrates that all employees present similar values for PC1. Of the seven factors presented in this research, six of them achieved very close answers, these factors are: selection policies, beneits policies, performance evaluation, promotion systems in the career and position, remuneration policies and training systems. We found that the staf show that their identiication with the factor was little only for the recruitment systems factor. PC2 however, presents presents the second total data variability and the second percentage of explanation of the total scores variability. Representing in the Figure (4-a), indicates that employees attributed the highest scores to the remuneration policies questions and the lowest scores to questions concerning recruitment policies. They oscillate between high scores, for one factor, and low scores, to another. For this reason, we performed the comparison between scores.
Table 3. Spearman Correlation Coeicients of the Set of Explicit Way Variables.
P17 P18 P19 P20 P21 P22 P23 P24
P18 0.629577
P19 0.554209 0.559729
P20 0.460141 0.574436 0.53401
P21 0.397914 0.492195 0.478889 0.6987
P22 0.479541 0.590698 0.528035 0.73044 0.695854
P23 0.457922 0.4966 0.444252 0.585398 0.572319 0.567067
P24 0.478561 0.506647 0.48964 0.621475 0.582903 0.653539 0.625946
P25 0.40558 0.472166 0.494745 0.582151 0.609325 0.589287 0.652565 0.754032
P26 0.233685 0.253808 0.276203 0.333982 0.319666 0.335722 0.350062 0.398563 P27 0.417789 0.399318 0.374352 0.464941 0.516066 0.537411 0.571464 0.438666
P28 0.38532 0.39342 0.380311 0.488742 0.513562 0.550145 0.586205 0.528988
P29 0.373936 0.411716 0.329278 0.480455 0.53376 0.580156 0.60531 0.547684
P30 0.420967 0.460913 0.475639 0.610739 0.570314 0.555128 0.624156 0.56109
P31 0.462542 0.507688 0.429411 0.531458 0.571963 0.61928 0.572138 0.616343
P32 0.429371 0.451684 0.362981 0.579558 0.556017 0.523223 0.579045 0.557289 P33 0.455206 0.570165 0.428529 0.590206 0.633169 0.592211 0.669172 0.621639
P34 0.499841 0.493106 0.473803 0.539928 0.500837 0.579667 0.59644 0.521917
P35 0.416393 0.504121 0.452283 0.615756 0.610612 0.64325 0.777042 0.622997
P36 0.489602 0.492736 0.486305 0.607268 0.594755 0.609642 0.64002 0.698631
P37 0.505732 0.454834 0.43788 0.483825 0.578029 0.529661 0.593886 0.596523
P38 0.550039 0.435742 0.44235 0.538258 0.614387 0.541577 0.600105 0.535905
P39 0.43973 0.441282 0.409501 0.540393 0.538855 0.599729 0.56999 0.571247
P40 0.450822 0.454669 0.378844 0.625966 0.599716 0.566739 0.602765 0.527297
P25 P26 P27 P28 P29 P30 P31 P32
P26 0.387116
P27 0.482988 0.274102
P28 0.504277 0.325569 0.772212
P29 0.597777 0.273199 0.692658 0.664512 1
P30 0.563711 0.291292 0.616577 0.706478 0.698694
P31 0.662822 0.338705 0.557465 0.602502 0.668932 0.708981
P32 0.604663 0.167043 0.620094 0.648816 0.654203 0.68818 0.732585
P33 0.669006 0.348433 0.466119 0.478588 0.581452 0.605506 0.680783 0.582937 P34 0.542757 0.310225 0.458463 0.502792 0.475712 0.591145 0.547413 0.461331 P35 0.659911 0.355857 0.528322 0.590447 0.599974 0.676852 0.649706 0.658159 P36 0.684105 0.350826 0.419164 0.506041 0.523582 0.581176 0.684125 0.605947 P37 0.559451 0.291956 0.525726 0.528147 0.601857 0.608178 0.690528 0.580684
P38 0.552189 0.294208 0.583656 0.566081 0.5802 0.604154 0.614974 0.613148
P39 0.540886 0.306407 0.6215 0.625755 0.590285 0.56916 0.571292 0.596001
P40 0.542707 0.279352 0.562102 0.608105 0.64513 0.599229 0.602489 0.665579
P33 P34 P35 P36 P37 P38 P39 P40
P34 0.730152
P35 0.751028 0.723948
P36 0.728149 0.67238 0.687914
P37 0.626422 0.583145 0.654917 0.64993
P38 0.540333 0.541957 0.598631 0.579912 0.777272
P39 0.534235 0.544651 0.623697 0.547697 0.70148 0.775441
P40 0.587998 0.494652 0.626152 0.616013 0.617618 0.765469 0.720743
Table 4. Principal Components; Proportion of the total variance; explained by the PC; Cumulative proportion of the total variance; Eigenvalue; for the 24 scores.
Principal Component Proportion of the total variance explained
Cumulative proportion of the total variance explained
(Ferreira, 2008: > = 70%)
Eigenvalue (Kaiser’s rule, >1)
CP1 0.5695 0.5695 3.70
CP2 0.0590 0.6285 1.19
CP3 0.0427 0.6712 1.01
CP4 0.0364 0.7076 0.93
SOURCE: research data, R software (2014).
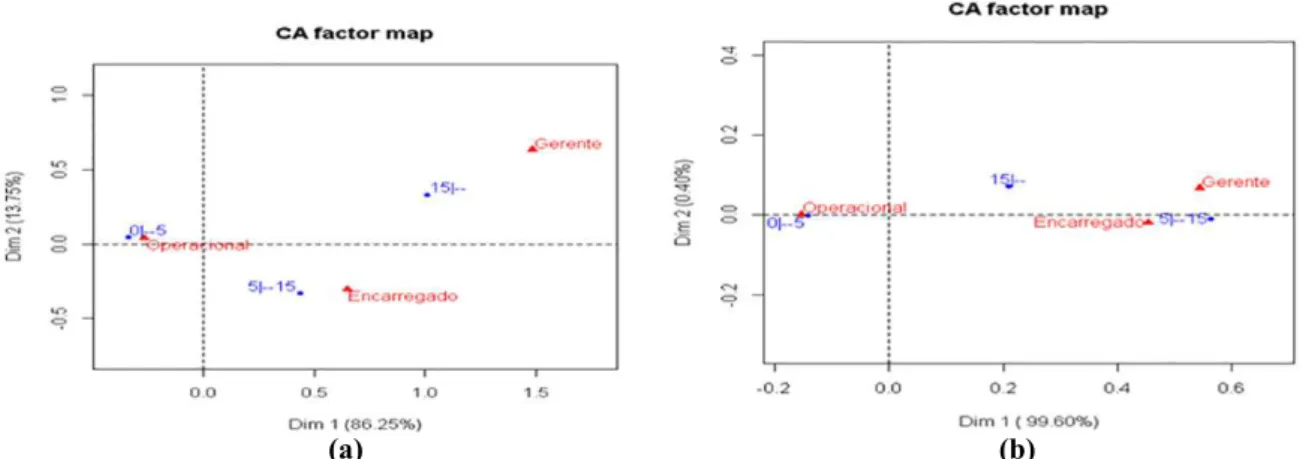
(a) (b)
SOURCE: research data, R software (2014).
Figure 4. Biplot graph for each PC pair - PC1; PC2; PC3 and PC4.
systems and remuneration policies, with the group represented by the set of questions referring to the performance evaluation.
Considering the groups shown in Figure 5, we state that there was little discrepancy between the scores, indicating that among these employees there is a great convergence to the acceptance of the factors of the explicit way in analysis.
SOURCE: research data, R software (2014).
Figure 5. Scatter plot of factor loadings the irst two factors of each question applying in the Factor Analysis the varimax rotation.
With the implementation of the PCA and FA and the factors of the explicit way, there were associations between pairs of principal component of the seven factors of the explicit way because with these the four PCs were formed, with factor being left without association, consecutively forming groups of two, three and six associated factors.
4.2. CHI-SQUARE TEST AND CORRESPONDENCE ANALYSIS
Variable Time Holding Position Time in the Company
Age <0.01 <0.01
Gender 0.342 0.732
Level of Education 0.002 < 0.01
Sector 0.248 0.041
Position 0.002 < 0.01
SOURCE: research data, R software (2014).
For the variables listed in Table 5, we applied the CA. The charts show the similarities, between the levels of each categorized variable with the levels that describe the time periods (Figures 6-9).
(a) (b)
SOURCE: research data, R software (2014).
Figure 6. Graph of Correspondence Analysis highlighting the similarity between the variable age with (a) time in the company and (b) time in the position held.
(a) (b)
SOURCE: research data, R software (2014).
(a) (b)
SOURCE: research data, R software (2014).
Figure 8. Graph of Correspondence Analysis highlighting the similarity between the variable position held in the company (a) time in the company and (b) time in the position held.
SOURCE: research data, R software (2014).
Figure 9. Graph of Correspondence Analysis highlighting the similarity between the variable sector one works in the company with time in the company.
The analysis of Figure (6-a) shows the association of the time in the company with age: time period less than 5 years, are employees younger than or 25 years old. Time period of 5 to approximately 15 years, are employees aged between 26 to 40 years. Time period of 15 years, are employees older than 41 years. Therefore, the older the age, the longer the time in the company is. In Figure (6-b), the analysis of the association of time in the position with age shows that: time period less than 5 years, are employees under the age of 40 years. Time period of 5 to 15 years, are employees ranging from 26 years to above 55 years. Time period longer than 15 years, Therefore, older employees tend to stay longer in the position.
(completed and incomplete) and incomplete higher education. Time period of 5 to approximately 15 years, are employees with post-graduation. Time period of 15 years or longer, are employees with completed higher education. Thus, the more years of service, the higher the level of education. The analysis of Figure (7-b) highlights the association of the position of time with the level of education: time period less than 5 years, are employees with elementary school; completed or incomplete high school and incomplete higher education. Time period of 0 to 15 years, are postgraduate employees. Time period of 5 to 15 years, are employees with completed higher education and post-graduation. And the time longer than 15 years has weak association with all the educational levels.
For Figure (8-a), the association of time in the company with the position held shows: time period less than 5 years, are employees who hold operational positions. Time period of 5 to 15 years, are employees who are in-charged of sectors. Time period of 15 years or longer, are usually employees holding management positions. The more years of service, the higher the position. Figure (8-b) presents the association with the time in the position held: time period less than 5 years holds operational position. Time period of 5 to 15 years hold in-charged of sector or hold management position. Time period longer than 15 years are in-charged of sector or hold management position. The management position is dissimilar from other positions.
Figure 9 shows the association of the time in the company with the sector: time period less than 5 years, mostly are employees in the industrial sector. Time period of 5 to 15 years, most often are employees in the administrative sector. Longer than 15 years, are the minority and it varies amongst the sectors: administrative, industrial and commercial.
4.3. CANONICAL CORRELATION ANALYSIS - CCA
With the Canonical Correlation of the three groups formed by the factors of the tacit way and the four groups formed by the factors of the explicit way, in relation to the variables time in the company and time in the position held, we came to the result of correlation between the PCs of the tacit way, with the coeicient value equal to 0.164; and for the explicit way, equals to 0.1675, and this led to the inding that both ways retain employees in the company. Diference of low expressivity. However, the coeicient value even with a small diference, is higher for the explicit way. We found that the explicit way has greater retention power for the employees of the surveyed company.
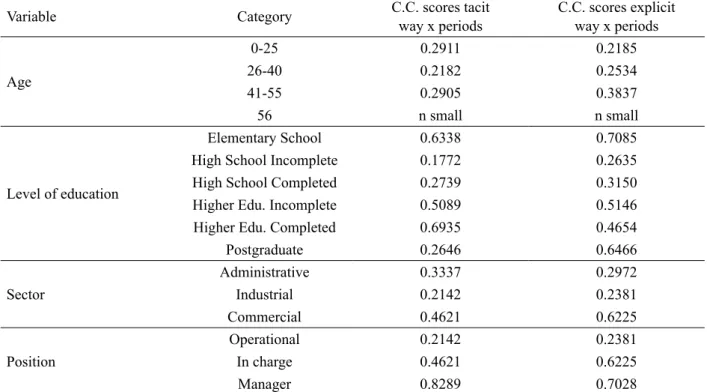
Table 6. Canonical Correlation (C.C.) of the group formed by the scores of PC’s, in each way, with the group being formed by time periods, in each category for age, level of schooling, sector and position held in the company.
Variable Category C.C. scores tacit way x periods
C.C. scores explicit way x periods
Age
0-25 0.2911 0.2185
26-40 0.2182 0.2534
41-55 0.2905 0.3837
56 n small n small
Level of education
Elementary School 0.6338 0.7085
High School Incomplete 0.1772 0.2635
High School Completed 0.2739 0.3150
Higher Edu. Incomplete 0.5089 0.5146
Higher Edu. Completed 0.6935 0.4654
Postgraduate 0.2646 0.6466
Sector
Administrative 0.3337 0.2972
Industrial 0.2142 0.2381
Commercial 0.4621 0.6225
Position
Operational 0.2142 0.2381
In charge 0.4621 0.6225
Manager 0.8289 0.7028
SOURCE: research data, R software (2014).
The results as shown in Table 6 were: (a) Age - weak association for both ways; (b) Level of education - moderate association for both ways; (c) Sector of work - moderate association in the commercial sector with the explicit way, leading employees of this area to be retained more by the explicit way than by the tacit way; however, there was retention for other areas (one by tacit way and another by the explicit way); (d) Position held - strong association in the position of manager for both ways; however, they are retained more by the tacit way. For the others, the retention occurs more over the explicit way than by the tacit way.
to the company. These are experiences in Brazil that are gradually being applied in companies, and it is not diferent with this company here researched.
5. FINAL CONSIDERATIONS
The literature discusses the diiculty of managing what is in people’s minds, which is the tacit knowledge, which seeks the conversion to explicit knowledge, which is able to categorize, store, retrieve and transform into something empirical. In this respect, collaboration, and knowledge of all are fundamental in the implementation of the factors of tacit and explicit way of the knowledge management process, which consists of systematic actions, based on policies and methodologies that vary according to the company’s culture. It is also related to the mobilization of people for continuous learning, the socialization and interactivity among peers in support of knowledge sharing.
The set of characteristics found in the researched company made visible to it where to direct its eforts to retain talent, since the company contributes to job creation and regional development its surroundings. The study showed that factors of knowledge management via tacit and explicit are crucial in retaining professionals for that company. Although the results cannot be generalized, for the company it generated the visibility on their future management action to retain talent, create and disseminate knowledge in a more assertive manner, seeking innovation which it aims for.
The results lead those responsible for the company to relect on the environments that provide knowledge management, the existing practices and the ones that can be implemented aimed at an integrated optimization between the tacit and explicit way. As both ways are responsible for employee retention, it is mandatory that all the factors of both ways are valued, presented in this research. But above all, the leadership can decide on which/what factor(s) they should invest more expressively.
Finally, in academic terms it is expected that this research will arouse in other researchers an interest for further studies related to the subject. Similarly, we expect that this work contributes to arouse in the researched company and also in other companies, the interest in knowledge management and the importance of aligning their policies to people management knowledge.
6. REFERENCES
AZIZ, P. Rotatividade de Talentos: como o RH deve se comportar? 2014. Disponível em www. rh.com.br. Acesso em: 23 de dez. 2014.
ARAÚJO, L. C. G de; GARCIA, A. A. Gestão de pessoas: estratégias e integração organizacional. 2. ed., São Paulo: Atlas, 2009.
DAVENPORT, T.; PRUSAK, L. Conhecimento empresarial: como as organizações gerenciam o seu capital intelectual. 8. ed., Trad. de Lenke Peres. Rio de Janeiro: Campus, 1998.
FRIGOTTO, G. (org.). Educação e crise do trabalho: perspectivas de inal de século. Petrópolis: Vozes, 1998.
GIL, A. C. Como elaborar projetos de pesquisa. 4. ed., São Paulo: Atlas, 2002.
KLEIN, D. A. A gestão estratégica do capital intelectual. Rio de Janeiro: Qualitymark, 1998. LAUDON, K.;LAUDON, J. P. Sistemas de informações gerenciais: administrando a empresa
digital. São Paulo: Prentice Hall, 2004.
MEYERS, L.; GAMST, G.; GUARINO, A. J. Applied Multivariate Research: Design and Interpretation. 2. ed., Sage Publications Inc. Thousand Oaks - London - New Delhi, 2013.
NAKASHIMA, C. Deloitte Banco de Talentos: Reter talentos, o maior desaio. JC Online. 02.03.2003. Artigo, disponível em: http://www2.uol.com.br/JC/sites/deloitte/artigos/a3.htm. Acesso em: 13 de jul. 2014.
NONAKA, I.; TAKEUCHI, H. The Knowledge-creating company: How Japanese companies create the dynamics of innovation. New York: Oxford University Press, 1995.
NONAKA, I.; TAKEUCHI, H. Criação de conhecimento na empresa. Trad. de Ana Beatriz Rodrigues, Priscilla Martins Celeste. 19. ed., Rio de Janeiro: Elsevier, 1997.
POLANYI, M. Tacit Knowing: Its Bearing on Some Problems of Philosophy. Reviews of Modern Physics, 34 (4) oct. 1962, 601 - 616. The Competitiveness of Nations in a Global Knowledge - Based Economy. Apr. 2005. Disponível em: http://faculty.edu/rinnis/45.301%20ways%20 of%20knowing. Acesso em: 15 de jan. 2014.
POLANYI, M. The Tacit Dimension. Routledge and Kegan Paul. London: UK, 1966.
PROST, G.; RAUB, S.; ROMHARDT, K. Gestão do conhecimento: os elementos construtivos do sucesso. Porto Alegre: Artmed, 2007.
RIBEIRO, A. de L. Gestão de Pessoas. São Paulo: Saraiva, 2006.
RICHARDSON, R. J. et al. Pesquisa social: Métodos e Técnicas. 3. ed., São Paulo: Atlas, 1999. ROUQUAYROL, M.Z.; ALMEIDA FILHO, N. Epidemiologia e saúde. 6. ed., Rio de Janeiro:
Guanabara Koogan, 2006.
TEIXEIRA FILHO, J. Gerenciando conhecimento. Rio de Janeiro: SENAC, 2000.
TERRA, J.C.C. Gestão do conhecimento. O grande desaio empresarial: inclui o modelo das Sete Dimensões da gestão do conhecimento. Rio de Janeiro: Elsevier, 2005.
SANTOS, A. R. dos. (Org.). Gestão do Conhecimento: uma experiência para o sucesso empresarial. Curitiba. Ed. Universitária Champagnat. 2001. Disponível em: http://www1.serpro.gov.br/ publicacoes/gco_site/index.htm. Acesso em: 13 de jul. 2014.
SENGE, P. M. A quinta disciplina. Arte, teoria e prática da organização de aprendizagem. São Paulo: BestSeller, 1999.