Factors associated with
nutritional status in infants
attending public daycare centers
in the municipality of Recife, PE,
Brazil
Fatores associados ao estado
nutricional em crianças de creches
públicas do município de Recife, PE,
Brasil
Juliana Souza Oliveira
IPedro Israel Cabral de Lira
IIAntonio Geraldo Cidrão de Carvalho
IIIMaria de Fátima Alcântara Barros
IIIMarília de Carvalho Lima
IVI Nutrition Center, Vitória Academic Center, Federal University of Pernambuco.
II Department of Nutrition, Federal University of Pernambuco.
III Department of Physiotherapy, Federal University of Paraíba.
IV Department of Maternal and Child Care, Federal University of Pernambuco.
Conlicts of interest: nothing to declare
Funding: CNPq/MS (Ministry of Health/National Council for Scientiic and Technological Develo-pment) process No. 403195/2004-7 and FACEPE/CNPq/PPP (State of Pernambuco Research and Technology Support Foundation/First Project Program) process No. 006/2003.
Corresponding author: Juliana Souza Oliveira. Av. Boa Viagem, 6836 – Bloco18 – apto.32, Boa Via-gem, 51130-000 Recife, PE, Brazil. E-mail: [email protected]
Abstract
Objective: To evaluate the nutritional status of infants attending daycare centers in the Municipality of Recife and to verify its asso-ciation with potential determinant factors.
Methods: This is a cross sectional study con-ducted with 321 infants in the age group of 6 to 30 months from August to October 2004. The nutritional status was assessed through length-for-age, age, weight-for--length and body mass index-for-age using as reference pattern that of the World Health Organization. Multivariable linear regres-sion analysis assessed the effect of maternal socioeconomic and demographical indica-tors, and child related variables on infant
length-for-age. Results: The percentages
of malnutrition (Z score < -2) were found in 13.4%, 2.8%, 0.6% and 0.6% for length--for-age, weightlength--for-age, weight-for-length and body mass index-for-age, respectively. The final model of the linear multivariable regression analysis showed that the socioe-conomic (type of roof and water supply) and child biological conditions (birthweight, age and hemoglobin concentration) were the variables that significantly influenced the variation of length-for-age, explaining
3.8% and 12.8%, respectively. Conclusion:
Among the studied variables, child biolo-gical factors had a higher influence in the variation of length-for-age than the socio-economic ones.
Resumo
Objetivo: Avaliar o perfil nutricional de crianças frequentadoras de creches do município de Recife e identificar potenciais
fatores determinantes. Métodos: Trata-se
de um estudo transversal conduzido com 321 crianças de 6 a 30 meses no período de agosto a outubro de 2004. A classificação do estado nutricional foi realizada a partir dos índices comprimento/idade, peso/idade, peso/comprimento e de massa corpórea/ idade, utilizando o padrão de referência da Organização Mundial da Saúde. A análise de regressão linear multivariada avaliou o efeito das condições socioeconômicas e demográficas maternas e relacionadas às crianças sobre o índice comprimento/
idade. Resultados: O percentual de
desnu-trição (< -2 escores Z) foi de 13,4%, 2,8%, 0,6% e 0,6% para os índices comprimento/ idade, peso/idade, peso/comprimento e de massa corpórea/idade, respectivamente. O modelo final da análise de regressão linear multivariada mostrou que as condições socioeconômicas (tipo de teto e abaste-cimento de água) e biológicas da criança (peso ao nascer, idade e concentração de hemoglobina) foram as variáveis que sig-nificantemente influenciaram a variação do índice comprimento/idade, explicando
3,8% e 12,8%, respectivamente. Conclusão:
Entre as variáveis estudadas, os fatores bio-lógicos da criança tiveram uma influência maior na variação do índice comprimento/ idade do que as socioeconômicas.
Palavras-chave: Criança. Estado nutricio-nal. Antropometria. Índice comprimento/ idade. Creches. Estudos transversais. Fatores epidemiológicos.
Introduction
The nutritional status of a population, especially children, is an excellent indicator of quality of life, reflecting the pattern of
development of a certain society1. To follow
the nutritional status of infants is a key ins-trument to assess their health conditions, bringing the unique opportunity to obtain objective measures of evolution of the
he-alth conditions of a population2.
An increasing number of children with a lower socioeconomic level, living in the urban centers of Brazil, have been served by public daycare centers. There is great demand for these services, which tends to increase due to the fact that mothers have been working to contribute to the family
in-come3,4. Programs based on full-time quality
child care, aimed at infants from the first months of life, can play a preventive role as they protect these infants from nutritional
disorders, especially chronic malnutrition3,5.
Although daycare centers are a possi-ble protective factor of nutritional status, as they provide an adequate diet and are responsible for 2/3 of the total nutritio-nal intake of children, their exposure to precarious housing and basic sanitation conditions predisposes them to recurrent infectious processes with resulting damage to their nutritional status, especially those
aged less than 24 months6-9. Additionally, as
observed by Monteiro10, the height deficit
of children at the age of seven years would have been established at 24 months of life. As height is a body measure that evolves slowly and progressively, its dimension reflects the history of socioeconomic and
nutritional status of a population11. Thus,
the present study aimed to assess the nu-tritional status of infants aged from six to 30 months, who were enrolled in public daycare centers of the city of Recife, and to verify potential factors associated with the length-for-age index.
Methods
public daycare centers situated in five of the six Health Districts of the city of Recife, state of Pernambuco, Northeastern Brazil. The centers were selected by simple random sampling from a total of 20 daycare centers that met the inclusion criteria (age and wi-thout oral iron supplementation). Infants enrolled in these centers had similar socio-economic conditions and received the same support for the educational curriculum, diet and health care from the city’s Department
of Education12.
The study had a cross-sectional design and was conducted with infants aged be-tween six and 30 months, enrolled in these daycare centers, including a total of 321 participants. Data collection was performed from August to October 2004.
Socioeconomic and demographic fac-tors were assessed for per capita family income, maternal level of education and age, housing and basic sanitation condi-tions, and ownership of household goods. The child-related variables were as follows: sex, birth weight, age, profile of maternal breastfeeding, and hemoglobin concentra-tion. This information was collected from the children’s mothers or legal guardians at the daycare centers through an interview conducted by two research assistants, using a pre-coded questionnaire.
Venous blood samples were collected for hemoglobin count, electronically determi-ned with the ABX Pentra, ABX 120 VEP 0027 model. Values < 9.5 g/dL were considered as moderate to severe anemia; 9.5 – 10.9 g/dL
as mild anemia; and ≥ 11.0 g/dL as normal13.
The anthropometric assessment was made by measuring weight and length, follo-wing the recommendations of the World
Health Organization14. Weight was obtained
with a Marte digital scale with a maximum capacity of 160kg (MS 160 model, Goiânia, Brazil) and accuracy of 50g. Length was measured with an anthropometer (Raven Equipment, England) with a maximum amplitude of 100cm and subdivisions of 0.1cm. Infants were measured two times and the difference between measurements should not exceed 0.5cm to guarantee their
accuracy; when this limit was exceeded, another measurement was taken, the two closest values were recorded, and the mean of these values was used.
The nutritional status assessment used
the Anthro software – 200715 and infants
were categorized according to the weight--for-age, lengthweight--for-age, weight-for-length and BMI-for-age indices expressed in Z scores. The child growth pattern used as reference to classify weight and length me-asurements was that of the World Health
Organization (WHO)16. With regard to the
nutritional status assessment, the following cut-off points were used: < -2 Z scores = malnutrition, -2 to < -1 Z score = risk of
malnutrition, and ≥ -1 Z score = eutrophy
for the length-for-age index; and < -2 Z scores = malnutrition, -2 to < -1 Z score =
risk of malnutrition, ≥ -1 to < 2 Z scores =
eutrophy, and ≥ 2 Z scores = overweight for
the weight-for-age, weight-for-length and BMI-for-age indices. Maternal breastfee-ding was defined as infants who had recei-ved or were receiving maternal milk directly or collected from breasts, regardless of any foods or liquids being provided, including
non-human milk17.
The Epi Info software, version 6.04 (CDC, Atlanta, USA), was used to perform double data entry, aiming to check for consistency and validity of typing.
The length-for-age index, selected as a dependent variable to investigate associated factors, was analyzed as a continuous varia-ble. The associations were made according to this index as it shows a higher prevalence of nutritional deficit and as it is currently the most frequent and representative type of anthropometric deviation. Student’s t test and variance analysis (ANOVA) were used to compare the differences between means in the bivariate analyses,
consi-dering a p-value ≤ 0.05 to have statistical
significance. The correlation matrix did not identify multicollinearity among variables, as Pearson correlation coefficients were lower than 0.52.
Package for the Social Sciences (SPSS) software, version 12.0.1, when assessing the impact of independent variables on the length-for-age index. Among the inde-pendent variables, birth weight, age and hemoglobin concentration were treated as continuous variables. All variables with a p-value < 0.20 in the bivariate analyses were selected to be included in the regression models, using the stepwise method. The
model adopted by Lima et al.18 was used
to analyze the associated factors. Initially, the regression of the 11 socioeconomic and maternal variables was performed (housing type; occupancy status; type of wall, floor and ceiling; water supply; sewage system; ownership of television, fridge and landline telephone in the household; and maternal education). Next, the child-related variables were included in the model (birth weight, age and hemoglobin concentration). This research project was approved by the Human Research Ethics Committee of the Health Sciences Center of the Federal
University of Pernambuco, under protocol 299/2003. The mothers of participating infants were informed about the research objectives and procedures and signed an informed consent form to be included in the study.
Results
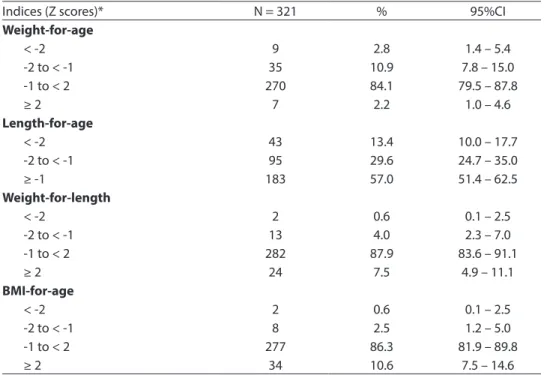
According to Table 1, the percentage of malnutrition observed (< - 2 Z scores) was 2.8% and 13.4% for the weight-for-age and length-for-age indices, respectively, and 0.6% for the weight-for-length and BMI-for-age indices. Overweight was 7.5% and 10.6% for the weight-for-length and BMI-for-age, respectively.
With regard to socioeconomic variables (Table 2), 53.3% of families received a per capita family income lower than 1/4 of a mi-nimum wage, the majority of them (71.3%) lived in a house or apartment with brick or hollow tile walls (82.9%), piped water supply (81%) and flushing toilet (42.7%). In terms of
Table 1 – Nutritional status of children from 6 to 30 months attending daycare centers in Recife, Pernambuco, 2004.
Tabela 1 – Estado nutricional de crianças de 6 a 30 meses matriculadas em creches públicas do
município de Recife, Pernambuco, 2004.
Indices (Z scores)* N = 321 % 95%CI
Weight-for-age
< -2 9 2.8 1.4 – 5.4
-2 to < -1 35 10.9 7.8 – 15.0
-1 to < 2 270 84.1 79.5 – 87.8
≥ 2 7 2.2 1.0 – 4.6
Length-for-age
< -2 43 13.4 10.0 – 17.7
-2 to < -1 95 29.6 24.7 – 35.0
≥ -1 183 57.0 51.4 – 62.5
Weight-for-length
< -2 2 0.6 0.1 – 2.5
-2 to < -1 13 4.0 2.3 – 7.0
-1 to < 2 282 87.9 83.6 – 91.1
≥ 2 24 7.5 4.9 – 11.1
BMI-for-age
< -2 2 0.6 0.1 – 2.5
-2 to < -1 8 2.5 1.2 – 5.0
-1 to < 2 277 86.3 81.9 – 89.8
≥ 2 34 10.6 7.5 – 14.6
household goods available, 2/3 of families or more had a television and refrigerator.
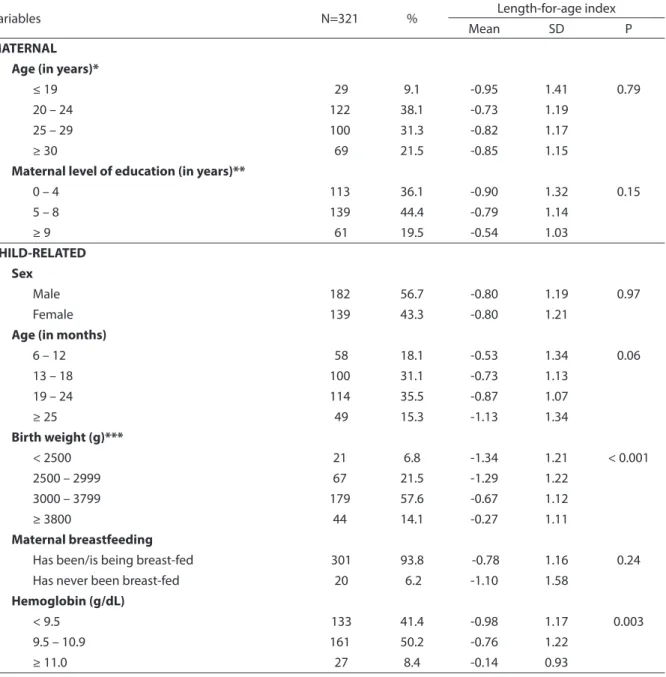
With regard to maternal variables (Table 3), 9.1% of mothers were adolescents and the majority of them (69.4%) were aged
between 20 and 29 years. Concerning the level of education, 44.4% had completed from five to eight years of education. Low birth weight (< 2,500g) had a frequency of 6.8%, while that of insufficient weight
Table 2 – Mean and standard deviation of length-for-age index (Z score) according to the socioeconomic characteristics of children from 6 to 30 monthsattending daycare centers in Recife, Pernambuco, 2004.
Tabela 2 - Média e desvio padrão do índice comprimento/idade (escore z) segundo as características socioeconômicas de
crianças de 6 a 30 meses matriculadas em creches públicas do município de Recife, Pernambuco, 2004.
Variables N=321 % Length-for-age index
Mean SD P
Per capita income (MW)*
<0.25 160 53.3 -0.87 1.17 0.27
0.25-0.49 104 34.7 -0.87 1.28
≥0.50 36 12.0 -0.53 0.96
Housing type
House or apartment 229 71.3 -0.69 1.17 0.007
Room or others 92 28.7 -1.08 1.21
Occupancy status
Owned 184 57.3 -0.89 1.18 0.05
Rented 75 23.4 -0.51 1.24
Ceded/invaded/others 62 19.3 -0.90 1.15
Type of wall
Hollow tiles/bricks 266 82.9 -0.72 1.19 0.01
Rammed earth/wooden boards/cardboard/brass/others 55 17.1 -1.18 1.14
Floor
Ceramic 45 14.0 -0.58 1.28 0.18
Cement/granite 233 72.6 -0.80 1.15
Earth/wooden boards/others 43 13.4 -1.06 1.29
Ceiling
Cinder blocks/clay tiles 172 53.6 -0.60 1.14 0.001
Asbestos tiles/others 149 46.4 -1.03 1.22
Water supply
With indoor plumbing 260 81.0 -0.71 1.19 0.003
Without indoor plumbing 61 19.0 -1.21 1.15
Toilet
Flushing toilet 137 42.7 -0.72 1.28 0.02
Non-lushing toilet 144 44.9 -0.74 1.12
Absent 40 12.4 -1.30 1.08
Household goods Color television
Yes 255 79.4 -0.75 1.20 0.12
No 66 20.6 -1.00 1.16
Refrigerator
Yes 213 66.4 -0.70 1.17 0.03
No 108 33.6 -1.00 1.23
Landline telephone
Yes 54 16.8 -0.59 1.14 0.15
No 267 83.2 -0.85 1.20
Cases without information: * 21 (6,5%); MW: Minimum Wages
(2,500 – 2,999g) was 21.5%. A total of 41.4% of infants had moderate to severe anemia and 50.2% had mild anemia. With regard to maternal breastfeeding, 93.8% of infants had been or were still being breast-fed at the moment of the interview, whereas 6.2% had never been breast-fed.
Tables 2 and 3 show the association between the explanatory variables and the length-for-age index. Variables with a p-value < 0.20 were selected for the multi-variate linear regression analysis.
This analysis showed that the socioe-conomic condition, represented by type
Table 3 - Mean and standard deviation of length-for-age index (Z score) according to the maternal and infant characteristics of children from 6 to 30 months attending daycare centers in Recife, Pernambuco, 2004.
Tabela 3 - Média e desvio padrão do índice comprimento/idade (escore z) segundo as características maternas e relacionadas
às crianças de 6 a 30 meses matriculadas em creches públicas do município de Recife, Pernambuco, 2004.
Variables N=321 % Length-for-age index
Mean SD P
MATERNAL Age (in years)*
≤ 19 29 9.1 -0.95 1.41 0.79
20 – 24 122 38.1 -0.73 1.19
25 – 29 100 31.3 -0.82 1.17
≥ 30 69 21.5 -0.85 1.15
Maternal level of education (in years)**
0 – 4 113 36.1 -0.90 1.32 0.15
5 – 8 139 44.4 -0.79 1.14
≥ 9 61 19.5 -0.54 1.03
CHILD-RELATED Sex
Male 182 56.7 -0.80 1.19 0.97
Female 139 43.3 -0.80 1.21
Age (in months)
6 – 12 58 18.1 -0.53 1.34 0.06
13 – 18 100 31.1 -0.73 1.13
19 – 24 114 35.5 -0.87 1.07
≥ 25 49 15.3 -1.13 1.34
Birth weight (g)***
< 2500 21 6.8 -1.34 1.21 < 0.001
2500 – 2999 67 21.5 -1.29 1.22
3000 – 3799 179 57.6 -0.67 1.12
≥ 3800 44 14.1 -0.27 1.11
Maternal breastfeeding
Has been/is being breast-fed 301 93.8 -0.78 1.16 0.24
Has never been breast-fed 20 6.2 -1.10 1.58
Hemoglobin (g/dL)
< 9.5 133 41.4 -0.98 1.17 0.003
9.5 – 10.9 161 50.2 -0.76 1.22
≥ 11.0 27 8.4 -0.14 0.93
Cases without information: *01 (0,3%); ** 08 (2,5%); *** 10 (3,1%)
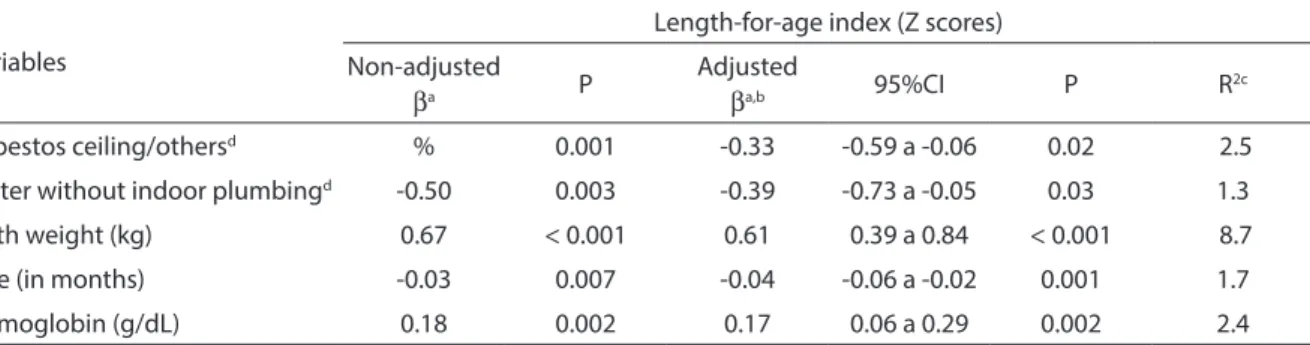
of ceiling and water supply, had a signifi-cant influence and contributed to 3.8% of the variation in the length-for-age index. Child-related variables, represented by birth weight, age and hemoglobin concentration, were those with a greater impact on the variation in the length-for-age index, jointly contributing 12.8%. When considered toge-ther, these variables explained 16.6% of this index (Table 4).
Discussion
The results of the present study corrobo-rate the statement that height deficit is the most frequent and representative form of anthropometric deviation of malnutrition. Consequently, daycare centers can be an important choice of care, as they enable infants to have access to a qualitatively adequate diet, which has the potential of reducing nutritional risks, among which is
chronic malnutrition19,20.
In the present study, the number of infants with a deficit in the length-for--age index (13.4%) was higher than that
expected for the reference values of 2.3%14
and similar to that found in Brazil by the
Pesquisa Nacional de Demografia e Saúde
(PNDS – National Demographic and Health
Survey)21 for children aged between 12 and
23 months (12.3%) and to that found by
Oliveira et al.22 in a study conducted with
children in the state of Bahia (12.4%). In daycare centers of the cities of São Paulo
and Belo Horizonte, Zöllner and Fisberg3
and Rocha et al.23 observed that lower
pre-valences of height deficit of 5.2% and 4.2%, respectively, indicate better socioeconomic conditions, reflecting regional inequalities and probably better care and infrastructure conditions of daycare centers.
The literature shows that the rela-tionship between height growth and the environmental conditions to which children
are exposed has been well documented22,24.
The same can be observed with regard to so-cioeconomic conditions, such as family in-come, where the significant association with
nutritional status2,22,,25 is frequently found.
Reporting one’s family income involves different aspects that hinder data reliability, so that the “type of ceiling” and “water sup-ply” variables became more representative of family socioeconomic conditions in this study and their significance remained in the multivariate regression analysis.
Additionally, the child-related variables such as birth weight, age and hemoglobin concentration had a significant impact on
Tabela 4 - Regressão linear multivariada dos fatores associados ao índice comprimento/idade (escore Z) de crianças de 6 a 30 meses matriculadas em creches públicas do município de Recife, Pernambuco, 2004.
Table 4 - Multivariate linear regression analysis of factors associated to length-for-age index (Z score) of children from 6 to 30
months attending daycare centers in Recife, Pernambuco, 2004.
Variables
Length-for-age index (Z scores)
Non-adjusted
βa P
Adjusted
βa,b 95%CI P R
2c
Asbestos ceiling/othersd % 0.001 -0.33 -0.59 a -0.06 0.02 2.5
Water without indoor plumbingd -0.50 0.003 -0.39 -0.73 a -0.05 0.03 1.3
Birth weight (kg) 0.67 < 0.001 0.61 0.39 a 0.84 < 0.001 8.7
Age (in months) -0.03 0.007 -0.04 -0.06 a -0.02 0.001 1.7
Hemoglobin (g/dL) 0.18 0.002 0.17 0.06 a 0.29 0.002 2.4
a Regression coefficient /a Coeficiente de regressão
b Adjusted for: type of housing, occupation regime, type of wall, floor, water closet, maternal education, ownership of TV, refrigerator and telephone /b
Ajusta-do por: tipo de habitação, regime de ocupação, tipo de parede, piso, esgotamento sanitário, escolaridade materna, posse de TV, geladeira e telefone fixo.
c Adjusted determination coefficient /c Coeficiente de determinação ajustado.
dReference categories for categorical variables: ceiling slab of concrete/clay tiles, water and indoor plumbing. / d Categorias de referência para as variáveis
the variation in the length-for-age index. Birth weight has been frequently assessed
for the nutritional status of children2 and
its interference with child growth and de-velopment has been continually shown in the literature22,25-28.
The impact that low weight and insu-fficient weight have on the height deficit was evident, as they contributed to 8.7% of the variation in the length-for-age index. It should be emphasized that approximately 1/3 of the population experienced this con-dition, which could reveal precarious pre-natal care. As a result, birth weight among live births is directly associated with child quality of life, growth, development and
mortality.29 Thus, the importance of birth
weight as a key indicator of interest for nu-tritional surveillance becomes evident. The importance of this indicator would be even more relevant in statistical terms if studies on the prevalence of malnutrition were not significantly affected by survival bias, re-sulting from the fact that deaths associated
with low birth weight stop being included30.
Several factors are involved with the occurrence of low birth weight, among which is the manifestation of inadequate health and nutritional conditions of the mother-fetus pair, reflecting the pregnancy conditions and, ultimately, the socioecono-mic conditions in which the mother finds herself. Consequently, the birth weight can, on the one hand, reflect what has previously occurred, while, on the other hand, it can act as a predictive factor of possible post--natal complications in the short and long term, especially if the environmental and socioeconomic conditions interfering with
birth weight persist6,,22,26.
With regard to the hemoglobin level or iron deficiency that characterize anemia, when iron deficiency is found in the first two years of life, there is evidence of delayed psychomotor development and behavioral, cognitive and language changes, with im-portant repercussions for the physical and
mental development31.
Iron-deficiency anemia is highly pre-valent in Brazilian children aged less than
two years and it begins very early during
childhood1,18,32. In the present study, the
prevalence of anemia was 91.6%, of which 41.4% was moderate/severe. This had been
recorded in a previously published article12
and significantly contributed to the varia-tion in the length-for-age index of infants. While studying the determining factors of hemoglobin level in infants at 12 months of age in the narrow coastal plain of the state of Pernambuco, Northeastern Brazil,
Lima et al.18 observed a significant
associa-tion with the length-for-age index, where the prevalence of anemia was 73.2%. The same occurred in the studies conducted by
Brunken et al.27 on anemia among children
(63.1%) who were enrolled in full-time
pu-blic daycare centers and by Rocha et al.23
on the nutritional status and prevalence of anemia in children living in the city of Belo Horizonte (70.4% in those aged less than 24 months). However, these data do not corroborate the findings of Miranda
et al.32, when analyzing the association
be-tween iron-deficiency anemia (63.2%) and the nutritional status of children aged from 12 to 60 months in the city of Viçosa, and
those of Stefanini et al.31, when analyzing
the association between anemia (51%) and malnutrition among schoolchildren in the city of Osasco.
With regard to the age group, there was a significant inverse association between child age and the length-for-age index. These findings probably result from the dietary pattern of infants younger than 24 months and from the low coverage and qua-lity of public health actions provided to the population. This could justify the adoption of measures in the field of diet and nutri-tion, aimed at fighting against such health problem affecting infants in this age group. These findings are in agreement with those
observed by Oliveira et al.33, while studying
food insecurity and the nutritional status of children in an area of high socioeconomic vulnerability; however, they diverge from
the results found by Zöllner and Fisberg3,
managed by the City Hall in São Paulo, and
those obtained by Oliveira et al.22, when
analyzing the determinants of weight and linear growth deficits among children in the state of Bahia.
Although this study did not find a statis-tical association between breastfeeding and the length-for-age index, the importance of maternal breastfeeding is well known, espe-cially in the age group analyzed, as maternal milk contains factors that protect against infections and also represents an important source of nutrients. The literature has shown that quantitatively and qualitatively inade-quate post-weaning diets promote the onset of nutritional deficits with repercussions
for height growth1,6. Although not being
the object of the present study, overweight totaled 10.6%, surpassing the 2.3% expected for a reference population. In the age group in question, one should be cautious when analyzing overweight with cross-sectional data, considering the specific dietary pat-tern and growth process characteristics.
In this context, studies on child eating habits have become more relevant as a stra-tegy to fight malnutrition and it is essential to understand them in the communities studied. It should be emphasized that the height deficit is invariably established during the first 24 months of life. Thus, all efforts must be directed towards providing younger children access to health care and
housing infrastructure conditions and, to the extent possible, providing guidance to mothers, aiming to increase the period of maternal breastfeeding, apart from gui-dance and capacity-building on prenatal
and child care5. Moreover, it is necessary to
establish special care for infants born with low weight, due to its repercussions in the long term, in addition to using risk criteria (birth weight, age group, hemoglobin con-centration and housing conditions) as part of the normative principles for nutritional surveillance.
Acknowledgements
Authors would like to thank the daycare center workers, research assistants, mo-thers and children for their cooperation;
the Conselho Nacional de Desenvolvimento
Cientifico e Tecnológico (CNPq – National
Council for Research and Technological Development) for funding the present re-search project and granting rere-search scho-larships to Pedro Lira and Marília Lima and a doctoral scholarship to Juliana Oliveira;
and the Coordenação de Aperfeiçoamento
de Pessoal de Nível Superior (CAPES –
References
1. Brasil. Ministério da Saúde. Guia alimentar para
crianças menores de dois anos. Secretaria de Políticas de
Saúde, Organização Pan Americana da Saúde. Brasília: Ministério da Saúde, 2002a; 152 p.
2. Monteiro CA, Benício MHD’A, Iunes RF, Gouveia NC, Cardoso MAA. Evolução da desnutrição infantil. In:
Monteiro CA (ed.). Velhos e novos males da saúde no
Brasil: a evolução do país e de suas doenças. São Paulo:
HUCITEC/NUPENS/USP; 1995. pp. 93-114.
3. Zöllner CC, Fisberg RM. Estado nutricional e sua relação com fatores biológicos, sociais e demográficos de crianças assistidas em creches da Prefeitura do
Município de São Paulo. Rev. Bras. Saúde Matern Infant
2006; 6(3): 319-28.
4. Barros AJD, Gonçalves EV, Borba RSB, Lorenzatto CS, Motta DB, Silva VRL et al. Perfil das creches de uma cidade de porte médio do sul do Brasil: operação,
cuidados, estrutura física e segurança. Cad Saúde
Pública1999; 15(3): 597-604.
5. Silva MV, Ometto AMH, Furtuoso COM, Pipitone MAP, Sturion GL. Acesso a creches e estado nutricional das crianças brasileiras: diferenças regionais, por faixa etária
e classes de renda. Rev Nutr 2000; 13(3): 193-9.
6. Brasil. Ministério da Saúde. Secretaria de políticas
de saúde. Saúde da criança – Acompanhamento do
crescimento e desenvolvimento infantil. Série Cadernos
de Atenção Básica; n.11. Série A, Normas e Manuais Técnicos. Brasília, DF; 2002b; no. 173.
7. Biscegli TS, Polis LB, Santos LM, Vicentin M. Avaliação do estado nutricional e do desenvolvimento
neuropsicomotor em crianças frequentadoras de creche.
Rev Paul Pediatr 2007; 25(4): 337-42.
8. Bueno MB, Marchioni DML, Fisberg RM. Evolução nutricional de crianças atendidas em creches públicas
no Município de São Paulo, Brasil. Rev Panam Salud
Pública 2003; 14(3): 165-70.
9. Camillo CC, Amancio OMS, Vitalle MSS, Braga JAP, Juliano Y. Anemia ferropriva e estado nutricional de
crianças de Creches de Guaxupé. Rev Assoc Med Bras
2008; 54(2): 154-9.
10. Monteiro CA. Critérios antropométricos no diagnóstico da desnutrição em programas de assistência a crianças.
Rev Saúde Pública 1984; 18(3): 209-17.
11. Waterlow JC. Observations on the natural history of the
stunting. In: Waterlow, JC. Linear growth retardation
in less developed countries. New York, Nestlé Nutrition
Workshop series: Raven Press; 1988; 14: 1-16.
12. Carvalho AGC, Lira PIC, Barros MFA, Aléssio MLM, Lima MC, Carbonneau MA et al. Diagnosis of iron deficiency
anemia in children of Northeast Brazil. Rev Saúde
Pública 2010; 44(3): 513-9.
13. World Health Organization. Preventing and controlling
iron deficiency anemia through primary health care: a guide for health administrators and programme
managers. Geneva: WHO; 1989.
14. World Health Organization. Physical Status: The use and
interpretation of anthropometry. Technical Report Series
854: Geneva; 1995.
15. World Health Organization. Anthro for personal computers, version 2, 2007: Software for assessing growth and development of the world’s children. Geneva; 2007. [2007 Jan 23]. Disponível em: http://www. who.int/childgrowth/software/en/ (Acessado em 07 de dezembro de 2010).
16. World Health Organization. Multicentre Growth Reference Study Group. WHO child growth Standards
based on length/height, weight and age. Acta Paediatr
2006; (S450): 76-85.
17. World Health Organization. Indicators for assessing
breastfeeding practices. Geneva; 1992.
18. Lima ACVMS, Lira PIC, Romani SAM, Eickmann SH, Piscoya MD, Lima MC. Fatores determinantes dos níveis de hemoglobina em crianças aos 12 meses de vida na
Zona da Mata Meriodional de Pernambuco. Rev Bra.
Saúde Mater Infant 2004; 4: 35-43.
19. Laurentino GEC, Arruda IKG. Nanismo nutricional em
escolares no Brasil. Rev Bras Saúde Matern Infant 2003;
3(4): 377-8.
20. Konstantyner T, Taddei JAAC, Palma D. Fatores de risco de anemia em lactentes matriculados em creches
públicas ou filantrópicas de São Paulo. Rev Nutr 2007;
20(4): 349-59.
21. Brasil. Ministério da Saúde. Pesquisa Nacional de Demografia e Saúde da criança e da mulher: PNDS
2006: Dimensões do processo reprodutivo e da saúde da
criança. Brasília, DF; 2009.
22. Oliveira VA, Assis AMO, Pinheiro SMC, Barreto ML. Determinantes dos déficits ponderal e de crescimento
linear de crianças menores de dois anos. Rev Saúde
Pública 2006; 40(5): 874-82.
23. Rocha DS, Lamounier JA, Capanema FD, Franceschini SCC, Norton RC, Costa ABP et al. Estado nutricional e prevalência de anemia em crianças que frequentam
creches em Belo Horizonte, Minas Gerais. Rev Paul
Pediatr 2008; 26(1): 6-13.
24. Kac G. Tendência secular em estatura: uma revisão da
literatura. Cad Saúde Pública 1999; 15(3): 451-61.
25. Guimarães LV, Latorre MRDO, Barros MBA. Fatores de risco para a ocorrência de déficit estatural em
26. Eickmann SH, Lima MC, Motta MEFA, Romani SAM; Lira PIC. Crescimento de nascidos a termo com peso
baixo e adequado nos dois primeiros anos de vida. Rev
Saúde Pública 2006; 40(6): 1073-81.
27. Brunken GS, Guimarães LV, Fisberg M. Anemia em crianças menores de 3 anos que freqüentam creches
públicas em período integral. J Pediatr 2002; 78: 50-6.
28. Barroso GS, Sichieri R, Salles-Costa R. Fatores associados ao déficit nutricional em crianças residentes em uma área de prevalência elevada de insegurança alimentar.
Rev Bras Epidemiol 2008; 11(3): 484-94.
29. Soares NT, Guimarães ARP, Sampaio HAC, Almeida PC, Coelho RR. Estado nutricional de lactentes em áreas periféricas de Fortaleza. Rev. Nutr. 2000; 136(2): 99-106.
30. Oliveira O, Taddei JAAC. Efeito dos vieses de sobrevivência nas prevalências da desnutrição em
crianças no sexto ano de vida. Brasil – PNSN, 1989. Cad
Saúde Pública 1998; 14(3): 493-9.
31. Stefanini MLR, Colli C, Lerner BR, Lei DLM, Chaves SP, Di Pietro MS et al. Anemia e desnutrição em escolares da rede pública do Município de Osasco, São Paulo,
Brasil. Cad Saúde Pública 1995; 11(3): 439-47.
32. Miranda AS, Franceschini SCC, Priore SE, Euclydes MP, Araújo RMA, Ribeiro SMR et al. Anemia ferropriva e estado nutricional de crianças de 12 a 60 meses do
município de Viçosa, MG. Rev Nutr 2003; 16(2): 163-9.
33. Oliveira JS, Lira PIC, Maia SR, Sequeira LAS, Amorim RCA, Batista Filho M. Insegurança alimentar e estado nutricional de crianças de Gameleira, zona da mata do
Nordeste brasileiro. Rev Bras Saúde Matern Infant 2010;
10(2): 237-45.