Licence Creative Commom
CC
RBCDH
1 Universidade Federal do Rio Grande do Sul. Escola de Educação Física. Porto Alegre, RS. Brasil.
2 Centro Universitário Univates. Lajeado, RS. Brasil.
3 Faculdade Nossa Senhora de Fátima. Caxias do Sul, RS. Brasil
4 Universidade Regional Integrada do Alto Uruguai e das Missões. São Luiz Gonzaga, RS. Brasil
Received: 02 December 2013 Accepted: 25 May 2014
Validation of predictive equations for basal
metabolic rate in eutrophic and obese
subjects
Validação de equações de predição da taxa metabólica
basal em sujeitos eutróicos e obesos
Renata Lopes Krüger1
André Luiz Lopes1,2
Júlia da Silveira Gross1
Rodrigo Cauduro Oliveira Macedo1,3
Bruno Costa Teixeira1,4
Álvaro Reischak-Oliveira1
Abstract – Prediction equations for basal metabolic rate (BMR) continue to be the most common clinical tool for diet prescription; however, the values estimated may difer from those measured by indirect calorimetry (IC), especially in obese subjects. he objective of this study was to determine the BMRof obese and eutrophic subjects by IC, and to compare the results obtained with those estimated by prediction equations in order to identify whether diferences exist between predicted values and those measured by IC. Forty men aged 18 to 30 years were evaluated; of these, 20 were grade 1 obese and 20 were eutrophic. he agreement between the prediction equations and IC was evaluated using Bland-Altman (1986) plots. he results showed a variation between the prediction equations and IC of -19.6% to -91% in obese subjects and of 4.2% to 4.4% in eutrophic subjects. In both groups, the Milin-St. Jeor equation (1990) was the most accurate, with a diference of -9.1% compared to IC in obese subjects and of 0.9% in eutrophic subjects. his study indicates the Milin-St. Jeor equation to be the most adequate to estimate BMR. However, it is important to measure the BMR of obese subjects more accurately and safely in order to establish the best intervention based on physical exercise and healthy eating. Key words: Basal metabolism; Indirect calorimetry; Obesity.
Basal metabolic rate in eutrophic and obese subjects Krüger et al.
INTRODUCTION
Obesity has become a public health problem since it is strongly associated
with an increase in morbidity and mortality1. Obesity rates have increased
exponentially over the years, with grade 1 obesity (BMI: 30 to 35 kg/m2)
being the most frequent2.
An increase in body weight is generally the result of an energy imbal-ance caused by increased food intake and a concomitant reduction in
energy expenditure by physical activity3. hus, interventions designed
to establish an equilibrated energy balance, such as dietary restriction and physical exercise, are of the utmost importance for the prevention of
obesity4. In this respect, to balance energy intake, it is essential that the
consumption of dietary nutrients is based on the estimation of individual
energy requirements5. An inexpensive and practical method to obtain
estimates of energy intake is the calculation of total energy expenditure, which takes into consideration the basal metabolic rate (BMR), thermic
efect of food, and physical activity-related energy expenditure6. he BMR
refers to the amount of energy necessary to maintain vital functions of the
organism7, which can reach 50% of total energy expenditure in physically
active individuals and 70% in sedentary individuals8,9.
he BMR can be estimated by indirect calorimetry (IC) or by means of predictive equations. In the case of IC, the metabolic rate is determined
based on the consumption of oxygen (O2) and the production of carbon
dioxide (CO2). Assuming that all O2 consumed is used for the oxidation
of macronutrients and all CO2 produced is captured during the test, it
becomes possible to calculate the subject’s metabolic rate10. Although the
method is extremely valid, IC has a high cost, is time consuming and
requires specialized personnel for its execution11. For these reasons, diet
prescription is generally based on prediction equations12.
Diferent equations using anthropometric measures have been
devel-oped since the 19th century to estimate the BMR in diferent populations13.
Most of these equations are old and can oten not be applied to the current population in view of the exponential increase in physical inactivity and obesity, increasing the diversity in body composition and, consequently, in
energy utilization14. Prediction equations generally take into consideration
anthropometric variables such as body weight and height, as well as the age of the subjects. As a consequence, these equations do not seem to permit a valid estimation of BMR in subjects with high grades of obesity, normally
overestimating it15-18. In contrast, in subjects with grade 1 obesity, the values
estimated with these equations seem to be closer to those obtained by direct
assessment19, but few studies involving this population have been conducted.
Since grade 1 obesity is the most frequent grade and since it does not present a major discrepancy in body weight, the equations should predict BMR more accurately, contributing to diet prescription for weight loss.
results with those obtained with the equations of Harris and Benedict13,
Schoield20, FAO/WHO/UNU8, Henry and Rees21 and Milin-St. Jeor22 in
order to determine whether diferences exist in the predicted values and those measured by IC.
METHODOLOGICAL PROCEDURES
he sample consisted of 40 men aged 18 to 30 years who were divided
into two groups: 20 subjects with grade 1 obesity (30 to 35 kg/m2) and 20
eutrophic subjects (18.5 to 25 kg/m2). Altman’s nomogram (1982) was used
for the calculation of sample size, assuming a power of 80% and a 95% con-idence interval. he calculated sample size was 20 subjects per group, for a total of 40 volunteers. he participants were recruited by dissemination of the study at university centers in Porto Alegre, at the outpatient clinic of the University Hospital of Porto Alegre (Hospital de Clínicas de Porto Alegre - HCPA), and in the local media. All subjects agreed to participate in the study by signing the free informed consent form. he study was ap-proved by the Ethics Committee of HCPA (Protocol 110649).
Determination of the basal metabolic rate
he protocol consisted of 10 min of rest on a gurney in dorsal decubitus, followed by 30 min of collection of exhaled gases using a mask and a coupled collection device. A computerized gas analyzer (MedGraphics Cardiorespi-ratory Diagnostic Systems, model CPX-D) was used for the determination
of VO2 and VCO2. A breath-by-breath collection system was used.
For calibration of the equipment, the volume of the pneumotachograph was irst calibrated electronically by the system, followed by calibration of the collector plates using a known gas concentration. his process was
repeated for each test to standardize the measurement23.
he irst 10 min of gas collection were excluded from the analysis; thus,
VO2 and VCO2 (l/min) obtained during the inal 20 min of each
collec-tion (mean value of the period) were used for the calculacollec-tion of BMR. he equation proposed by Weir (1949) was used to obtain values in kcal/min, which does not require the use of protein metabolism by incorporating a
correction factor: [(3.9 x VO2) + (1.1 x VCO2)]. Finally, the result in kcal/
min was multiplied by 1,440 min to obtain the value for 24 hours. he subjects were asked not to perform any type of physical activity of mod-erate or high intensity during the 24 hours preceding the test, and not to consume alcohol, cafein or any type of medication during this period. Additionally, the subjects were instructed to fast for 12 hours prior to the
test, permitting the ad libitum intake of water, and to have a good night
Basal metabolic rate in eutrophic and obese subjects Krüger et al.
am in a temperature-controlled (20º to 25ºC) and sound-controlled room
under low luminosity19.
Equations used for BMR prediction
he BMR measured by IC was compared to the values obtained with the most commonly used prediction equations (kcal/day, in 24 hours). he
equations of Harris and Benedict13 and Milin-St. Jeor22 use body weight in
kg, height in cm, and age in years. In contrast, the equations of Schoield20,
FAO/WHO/UNU8 and Henry and Rees21 use only body weight in kg.
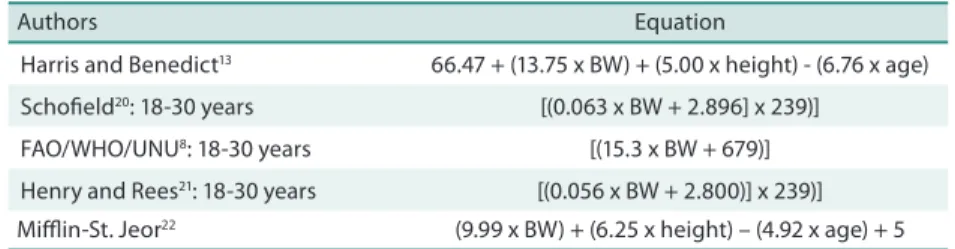
Table 1. Prediction equations for basal metabolic rate.
Authors Equation
Harris and Benedict13 66.47 + (13.75 x BW) + (5.00 x height) - (6.76 x age)
Schoield20: 18-30 years [(0.063 x BW + 2.896] x 239)]
FAO/WHO/UNU8: 18-30 years [(15.3 x BW + 679)]
Henry and Rees21: 18-30 years [(0.056 x BW + 2.800)] x 239)]
Milin-St. Jeor22 (9.99 x BW) + (6.25 x height) – (4.92 x age) + 5 BW: body weight.
Body composition
Skinfolds were measured with a skinfold caliper (Cescorf, Porto Alegre, Brazil). Bone diameters were determined with a caliper and anthropom-eter (Cescorf, Porto Alegre, Brazil). Circumferences were measured with an anthropometric metal tape measure (Sanny, São Bernardo do Campo, São Paulo, Brazil). Body weight and height were measured with a scale and stadiometer (model OS-180, Urano, Canoas, Rio Grande do Sul, Brazil). he marking of the anatomical sites and measurement technique of skinfolds followed the standards of the International Society for the Advancement
of Kinanthropometry (ISAK)24. Body composition was calculated using a
ive-component method24.
Statistical analysis
he data were analyzed using the SPSS 19.0 package. he Shapiro-Wilk test was used to determine whether the data showed a normal distribu-tion. Diferences between BMR measurements obtained by IC and with the
prediction equations were determined by the Student t-test for independent
samples. he results are reported as the mean ± standard deviation (SD).
A p value <0.05 was considered to be signiicant. he method suggested
he characteristics of the sample are shown in Table 2 and are reported as the mean ± standard deviation. here was a signiicant diference between groups for body weight (kg), fat mass (kg), muscle mass (kg), BMI (kg/m²) and all BMR prediction equations, with the observation of signiicantly higher values in obese subjects. No signiicant diference in the IC result was observed between groups. A signiicant diference between IC and
the equations of Harris and Benedict13, Schoield20, FAO/WHO/ONU8 and
Henry and Rees21 was only observed in obese subjects.
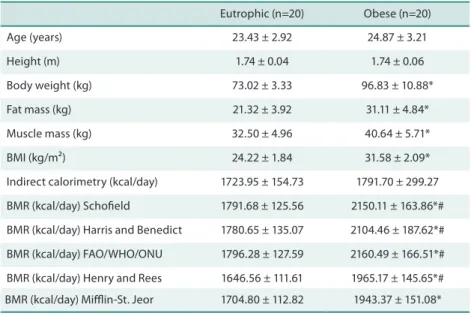
Table 2. Characteristics of the sample, measured basal metabolic rate (BMR), and BMR estimated with the prediction equations.
Eutrophic (n=20) Obese (n=20)
Age (years) 23.43 ± 2.92 24.87 ± 3.21
Height (m) 1.74 ± 0.04 1.74 ± 0.06
Body weight (kg) 73.02 ± 3.33 96.83 ± 10.88*
Fat mass (kg) 21.32 ± 3.92 31.11 ± 4.84*
Muscle mass (kg) 32.50 ± 4.96 40.64 ± 5.71*
BMI (kg/m²) 24.22 ± 1.84 31.58 ± 2.09*
Indirect calorimetry (kcal/day) 1723.95 ± 154.73 1791.70 ± 299.27 BMR (kcal/day) Schoield 1791.68 ± 125.56 2150.11 ± 163.86*# BMR (kcal/day) Harris and Benedict 1780.65 ± 135.07 2104.46 ± 187.62*# BMR (kcal/day) FAO/WHO/ONU 1796.28 ± 127.59 2160.49 ± 166.51*# BMR (kcal/day) Henry and Rees 1646.56 ± 111.61 1965.17 ± 145.65*# BMR (kcal/day) Milin-St. Jeor 1704.80 ± 112.82 1943.37 ± 151.08*
*p<0.05, signiicant diference between groups. #p<0.05, signiicant intragroup diference between indirect calorimetry and prediction equations.
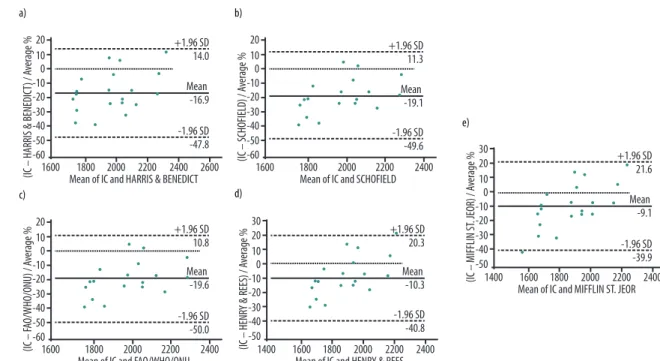
Figures 1 and 2 show the Bland-Altman plots comparing BMR mea-surements obtained by IC and with the prediction equations in obese and eutrophic subjects, respectively. In obese subjects, the FAO/WHO/
UNU8 equation was the equation that most overestimated BMR, with a
mean diference of -19.6% (-368.79 kcal/day). In contrast, the Milin-St.
Jeor22 equation was the most accurate compared to IC, with a diference of
-9.1% (-151.67 kcal/day), followed by the Henry and Rees equation21, with
a diference of -10.3% (-173.47 kcal/day). Similar values were obtained for
eutrophic subjects. In this group, the Milin-St. Jeor equation22 was also
the most accurate compared to IC, with a diference of 0.9% (19.15 kcal/ day), underestimating BMR. On the other hand, the equation of Henry and
Rees21 provided the least accurate value in these subjects, with a diference
Basal metabolic rate in eutrophic and obese subjects Krüger et al.
DISCUSSION
he main inding of this study was that, in obese subjects, BMR is overes-timated by the prediction equations used, except for the Milin-St. Jeor
equation22 , when compared to the value measured by IC. In contrast, in
eutrophic subjects all equations analyzed seem to be adequate for pre-dicting BMR. Comparison of eutrophic and obese subjects showed no
Figure 1. Bland-Altman plots comparing indirect calorimetry (IC) and the following prediction equations for basal metabolic rate in obese subjects: a) Harris and Benedict13, b) Schoield20, c) FAO/WHO/UNU8, d) Henry and Rees21, and e) Milin-St. Jeor22.
his diference might be explained by the fact that the equations consider total body mass. Body mass is generally regulated by the balance between
calorie intake and energy expenditure26. In obese subjects, the use of
pre-dictive equations increases the magnitude of error since changes in body composition do not occur in a uniform manner and the increase in body fat is greater than the increase in muscle mass. Since fat mass and muscle
mass difer metabolically, overestimation of BMR may occur27 .
Bland-Altman plots were used to express the level of agreement between BMR measurements obtained by IC and those predicted with
the equations. he Milin-St. Jeor equation22 showed the lowest error
diference in obese and eutrophic subjects. hese results agree with a
study conducted by the American Dietetic Association18. According to
that study, the Milin-St. Jeor equation22 seems to be more adequate for
predicting BMR in the general population, but might be limited when applied to special populations such as diferent ethnic groups and age groups. he signiicant diference observed between IC and the Henry and
Rees equation21 in obese subjects might be explained by the fact that these
authors collected BMR measurements from people living in the tropics and developed speciic equations for these populations. he Henry and Rees equation is therefore very speciic for a given population.
he Harris and Benedict equation13 showed the third largest error
diference in obese subjects, a inding that may be related to the fact that the predictive equations did not include obese individuals. Unlike today, the obese population was not signiicant at the time when this equation
was proposed (beginning of the 20th century), and several physiological,
morphological and environmental changes have occurred in the popula-tion over time. According to Frankenield et al. (2003), in the Harris and Benedict equation the magnitude of error increases with increasing BMI. his result is in agreement with the present study in which these values are overestimated.
he BMR estimated with the Schoield20 and FAO/WHO/UNU8
equations were closely similar, since both equations were derived from a
common database. Although the FAO/WHO/UNU8 equations have been
recommended for international use, evidence indicates that these equations are inadequate to estimate the BMR of subjects from diferent parts of the
world, especially the tropics18, 28,29 . his consequence may also be due to
the fact that the database used contained a disproportionate number of Italian subjects who exhibit a higher BMR than other European subjects,
North Americans and, apparently, Brazilian subjects28, 29. Furthermore,
possible diferences in the methods used should also be cited, since values
of non-fasted subjects were included in the FAO/WHO/UNU equation8.
Some speciic factors should be taken into consideration, such as the region, ethnicity and gender of the subjects, since they can limit the
Basal metabolic rate in eutrophic and obese subjects Krüger et al.
methods for the determination of body composition should be considered since fat mass and muscle mass are factors that inluence BMR. he mea-surement of BMR based on prediction equations can lead to errors in the values obtained for obese subjects, which may directly inluence the energy requirements to be used for diet prescription to reduce body fat mass.
CONCLUSIONS
he Milin-St. Jeor equation22 is the only equation that permits the
valid estimation of BMR in obese subjects. he equations of Harris and
Benedict13, Schoield20, FAO/WHO/UNU8, and Henry and Rees21 are not
recommended for the prediction of BMR in these individuals, since these equations may overestimate energy requirements. On the other hand, these equations are adequate to evaluate the BMR of eutrophic subjects.
his study suggests the use of the Milin-St. Jeor equation to estimate BMR, since this equation was the most accurate in both grade 1 obese and eutrophic subjects. However, it is important to measure the BMR of obese subjects more accurately and safely in order to establish the best non-medicamentous intervention based on physical exercise and nutritional re-education.
REFERENCES
1. Flegal KM, Carroll MD, Kit BK, Ogden CL. Prevalence of obesity and trends in the distribution of body mass index among US adults, 1999-2010. JAMA 2012;307(5):491-7.
2. Flegal KM, Kit BK, Orpana H, Graubard BI. Association of all-cause mortality with overweight and obesity using standard body mass index categories: a systematic review and meta-analysis. JAMA 2013;309(1):71-82.
3. Hill JO. Understanding and addressing the epidemic of obesity: an energy balance perspective. Endocr Rev 2006;27(7):750-61.
4. Hall KD, Sacks G, Chandramohan D, Chow CC, Wang YC, Gortmaker SL, et al. Quantiication of the efect of energy imbalance on bodyweight. Lancet 2011;378(9793):826-37.
5. Roza AM, Shizgal HM. he Harris Benedict equation reevaluated: resting energy requirements and the body cell mass. Am J Clin Nutr 1984;40(1):168-82.
6. Melo CM, Tirapegui J, Ribeiro SML. Gasto Energético Corporal: Conceitos, For-mas de Avaliação e sua Relação com a Obesidade. Arq Bras Endrocrinol Metab 2008;52(3):452-64.
7. Bursztein S, Elwyn DH, Askanazi J, Kinney JM. Evaluation of metabolic meas-urement equipment. In: Bursztein S, Elwyn DH, Askanazi J, Kinney JM editors. Energy metabolism, indirect calorimetry and nutrition. Baltimore: Ed Williams & Wilkins; 1989. p. 211-228.
8. FAO. Energy and protein requirements. Report of a joint FAO/WHO/UNU Expert Consultation. World Health Organization technical report series 1985;724:1-206. 9. Clark HD, Hofer LJ. Reappraisal of the resting metabolic rate of normal young
men. Am J Clin Nutr 1991;53(1):21-6.
10. Ferrannini E. he theoretical bases of indirect calorimetry: a review. Metab 1988;37(3):287-301.
Corresponding author
Renata Lopes Krüger
Rua Felizardo, 750 – Bairro: Jardim Botânico – Lapex
CEP: 90690-200 - Porto Alegre, RS. Brasil.
E-mail: [email protected]
Nutr 2003;57:1530-5.
13. Harris JA, Benedict FG. A biometric study of basal metabolism in man. Proc Natl Acad Sci 1919;4(12):370-3.
14. Frankenield DC, Rowe WA, Smith JS, Cooney RN. Validation of several established equations for resting metabolic rate in obese and nonobese people. J Am Diet As-soc 2003;103(12):1152-9.
15. Dobratz JR, Sibley SD, Beckman TR, Valentine B J, Kellogg TA, Ikramuddin S, et al. Predicting energy expenditure in extremely obese women. J Parenter Enteral Nutr 2007;31(3):217-27.
16. Cesar MC, Oliveira Jr AV, Rasera Jr I, Shiraga EC, Montesano FT, Wajsberg M, et al. Avaliação da taxa metabólica basal de mulheres com obesidade mórbida residentes no interior do Estado de São Paulo, Brasil. Rev Bras Ativ Fis Saúde 2003;8(1):38-44. 17. Horie LM, Gonzalez MC, Torrinhas RS, Cecconello I, Waitzberg DL. New speciic
equation to estimate resting energy expenditure in severely obese patients. Obesity 2011;19(5):1090-4.
18. Frankenield D, Roth-Yousey L, Compher C. Comparison of predictive equations for resting metabolic rate in healthy nonobese and obese adults: a systematic review. J Am Diet Assoc 2005;105(5):775-89.
19. Lopes AL, Cunha G, Silva DP, Zacca R, Castro FAZ, Oliveira AR. Validação de equações de predição da taxa metabólica basal por meio de calorimetria indireta em indivíduos obesos. Rev Bras Ativ Fis Saúde 2010;15(4):234-8.
20. Schoield WN. Predicting basal metabolic rate, new standards and review of previ-ous work. Am J Clin Nutr 1985;39(Suppl 1):5-41.
21. Henry CJ, Rees DG. New predictive equations for the estimation of basal metabolic rate in tropical peoples. Eur J Clin Nutr 1991;45(4):177-85.
22. Milin MD, St Jeor ST, Hill LA, Scott BJ, Daugherty SA, Koh YO. A new predictive equation for resting energy expenditure in healthy individuals. Am J Clin Nutr 1990;51(2):241-7.
23. Cunha G, Célia F, Ribeiro J, Oliveira A. Efects of the biological maturation on maximal oxygen uptake and ventilatory breakpoint of Brazilian soccer players. Gazz Med Ital - Arch Sci Med 2008;167(2):43-9.
24. Ross WD, Kerr DA. Fraccionament de la massa corporal: um nou mètode per utilizar en nutrició clínica i medicina esportiva. Apunts 1991;XVIII:175-87.
25. Marfell-Jones M, Olds T, Stewart A, Carter L. International standards for an-thropometric assessment. he manual for teaching materials for accreditation. Potchefstroom (South Africa): ISAK; 2006.
26. Leibel RL, Rosenbaum M, Hirsch J. Changes in energy expenditure resulting from altered body weight. N Engl J Med 1995;332(10):621-8.
27. Frankenield DC, Muth ER, Rowe WA. he Harris-Benedict studies of human basal metabolism: history and limitations. J Am Diet Assoc 1998;98(4):439-45. 28. Wahrlich V, Anjos LA. Validação de equações de predição da taxa metabólica
basal em mulheres residentes em Porto Alegre, RS, Brasil. Rev Saúde Pública 2001;35(1):39-45.
29. Hayter JE, Henry CJ. Basal metabolic rate in human subjects migrating between tropical and temperate regions: a longitudinal study and review of previous work. Eur J Clin Nutr 1993;47(10):724-34.