Abstract—This paper presents the conceptual neighborhood graphs with the transitions between the topological spatial relations that can exist between a circular spatially extended point and a line. The final objective of this work is the use of the transitions in the prediction of a mobile user position in a road network. The conceptual neighborhood graphs were identified using the snapshot model and the smooth-transition model. In the snapshot model, the identification of neighborhood relations is achieved looking at the topological distance existing between pairs of spatial relations. In the smooth-transition model, conceptual neighbors are identified analyzing the topological deformations that may change a topological spatial relation. The obtained graphs and the corresponding topological distances between spatial relations can be used as an alternative, or as a complement, to map-matching techniques usually used to predict the positions of mobile users.
Index Terms—Conceptual neighborhood graph, Qualitative
reasoning, Spatially Extended Point, Spatial Reasoning, Topological spatial relations.
I. INTRODUCTION
The relevance of the identification of the topological spatial relations is associated with the need to conceptualize the spatial relations that can exist among several objects in the geographical space. The work described in this paper is associated with the topological spatial relations existing between a Circular Spatially Extended Point and a Line [1, 2] and their use in the prediction of mobile users’ future positions in a context-aware mobile environment. With the topological spatial relations it is possible to identify the conceptual neighborhood graphs that state the possible transitions between spatial relations and, therefore, the possible movements that a mobile user can do in a road network. The selection of a Circular Spatially Extended Point is associated with the need to associate a certain degree of uncertainty to the position of a mobile user. A similar approach was followed by Wuersch and Caduff [3, 4] for pedestrian navigation using the topological spatial relations existing between two Circular Spatially Extended Points, one representing the user’s location and the other representing a waypoint that is used to define paths for pedestrians in a pedestrian guiding system.
In emerging applications areas, like context-aware mobile Manuscript received March 23, 2008.
M. Y. Santos is with the Information Systems Department, University of Minho, Campus de Azurém, 4800-058 Guimarães, Portugal (corresponding author, phone: +351-253-510308; fax: +351-253-510300; e-mail: maribel@ dsi.uminho.pt).
A. Moreira is with the Information Systems Department, University of Minho, Campus de Azurém, 4800-058 Guimarães, Portugal (e-mail: [email protected]).
environments, location-based services, ubiquitous computing, among others, the position of a mobile user constitutes the key for providing specific context-aware services. However, this position usually integrates a certain degree of uncertainty associated to the sensing technology. Although technologies like the Global Positioning System (GPS) provides quite accurate estimates, the positioning provided by other means like cellular networks positioning systems is typically much less precise. Having this limitation and the need to properly deal with it, the use of a Circular Spatially Extended Point allows the representation of such uncertainty and also the definition, in a specific application, of the maximum uncertainty value through the specification of the radius of the Circular Spatially Extended Point.
The identification of the topological spatial relations [1, 2] was motivated by a specific application domain – context-aware mobile environments – this paper presenting an example of how the topological spatial relations existing between a mobile user and a road network can be used to assign the user to a specific road segment. However, this research is of general use since the adopted principles were not adapted or strictly designed to a specific application.
This paper is organized as follows: Section 2 presents the identification of the conceptual neighborhood graph following the snapshot model and, section 3, using the smooth-transition model. In section 4 the two graphs are compared and the main differences between them are described and discussed. Section 5 presents an example of the use of the spatial relations and the conceptual neighborhood graphs to predict the position of mobile users, and section 6 concludes summarizing the work undertaken.
II. CONCEPTUAL NEIGHBORHOOD GRAPH WITH THE SNAPSHOT MODEL
Geographic objects and phenomena may gradually change their location, orientation, shape, and size over time. A qualitative change occurs when an object deformation affects its topological relation with respect to other object. Models for changes of topological relations are relevant to spatio-temporal reasoning in geographic space as they derive the most likely configurations and allow for predictions (based on inference) about significant changes [5]. The objects analyzed in this work are a Circular Spatially Extended Point (CSEP) and a Line (L). A CSEP P includes a pivot (P•), an interior (P°), a boundary (∂P) and an exterior (P-), while L integrates an interior (L°), a boundary (∂L) and an exterior (L-) (Fig. 1).
In a conceptual neighborhood graph, nodes represent spatial relations and edges are created to link similar
Conceptual Neighborhood Graphs for
Topological Spatial Relations
relations. Different definitions of similarity lead to different graphs involving the same set of relations. Usually, conceptual neighborhood graphs are built considering situations of continuous change, representing the possible transitions from one relation to other relations. Those graphs are useful for reducing the search space when looking for the next possible situations that might occur [6].
P
∂
P • P − P
L
∂
L
∂
− L L
Fig. 1 - Parts of a CSEP and a line
One of the approaches to identify a conceptual neighborhood graph is using the snapshot model. This model compares two different topological relations with no knowledge of the potential transformations that may have caused the change [7]. The comparison is made by considering the topological distance between two topological relations [5]. This distance determines the number of corresponding elements, empty (∅) and non-empty (¬∅), with different values in the corresponding intersection matrices. The intersection matrix is presented in Equation 1.
⎥ ⎥ ⎥ ⎥
⎦ ⎤
⎢ ⎢ ⎢ ⎢
⎣ ⎡
∂ ∂ ∂ ∂ ∂
∂ ∂
=
− − −
−
− − − • •
•
L P L P L P
L P L P L P
L P L P L P
L P L P L P
) , (
∩ ∩
∩
∩ ∩
∩
∩ ∩
∩
∩ ∩
∩
L P
R (1)
The definition of topological distance (τ) between two spatial relations (RA and RB) given by Egenhofer and Al-Taha
[5] is the sum of the absolute values of the differences between corresponding entries of the intersections verified in the corresponding matrices (MA and MB). The adoption of this
definition and its adaptation to the context of this work, 12-intersection matrices [1, 2], lead to the topological distance calculation as described by Equation 2.
[ ]
[ ]
∑∑
−• =
−
=
− =
i j
B A
R
RA, B M i,j M i,j
τ (2)
As an example, consider the topological spatial relations illustrated in Table I. Using relation 1 (R1) and relation 2 (R2)
[1, 2], and their corresponding matrices M1 and M2, the
calculated topological distance between these two topological spatial relations takes the value 2.
Table I – Topological distance: an example
⎥ ⎥ ⎥ ⎥
⎦ ⎤
⎢ ⎢ ⎢ ⎢
⎣ ⎡
− = −
0 1 0
0 1 0
0 0 0
0 0 0
2 1 M
M
⎥ ⎥ ⎥ ⎥
⎦ ⎤
⎢ ⎢ ⎢ ⎢
⎣ ⎡ =
1 1 1
1 0 0
1 0 0
1 0 0
1
M
⎥ ⎥ ⎥ ⎥
⎦ ⎤
⎢ ⎢ ⎢ ⎢
⎣ ⎡ =
1 0 1
1 1 0
1 0 0
1 0 0
2
M 2
2 1,R =
R τ
The calculation of the topological distances, Equation 2, showed that for the majority of the topological relations the minimum distance to their neighborhoods is 1. The minimum topological distance (Table II) between one relation and its
neighborhoods is 2 only in the case of relation 21 (R21).
Table II – Topological distance (snapshot model)
R1R2R3R4R5R6R7R8R9R10R11R12R13R14R15R16R17R18R19R20R21R22R23R24R25R26R27R28R29R30R31R32R33R34R35R36R37R38
R10 2 1 1 4 3 2 4 2 5 4 3 4 5 5 4 3 6 5 6 4 7 6 6 7 6 6 4 7 6 5 6 7 7 6 5 8 7
R22 0 1 3 2 1 2 2 4 3 2 3 4 3 5 4 5 4 3 4 6 5 4 6 7 6 4 6 5 4 5 6 5 7 6 7 6 5
R31 1 0 2 3 2 1 3 3 4 3 2 5 4 6 5 4 5 4 5 5 6 5 7 8 7 5 5 6 5 4 7 6 8 7 6 7 6
R41 3 2 0 3 2 1 5 1 4 3 2 5 6 4 3 2 5 4 7 3 6 5 7 6 5 7 3 6 5 4 7 8 6 5 4 7 6
R54 2 3 3 0 1 2 2 4 1 2 3 4 3 3 4 5 2 3 4 6 3 4 6 5 6 4 6 3 4 5 6 5 5 6 7 4 5
R63 1 2 2 1 0 1 3 3 2 1 2 5 4 4 3 4 3 2 5 5 4 3 7 6 5 5 5 4 3 4 7 6 6 5 6 5 4
R72 2 1 1 2 1 0 4 2 3 2 1 6 5 5 4 3 4 3 6 4 5 4 8 7 6 6 4 5 4 3 8 7 7 6 5 6 5
R84 2 3 5 2 3 4 0 4 1 2 3 2 1 3 4 5 2 3 2 6 3 4 4 5 6 2 6 3 4 5 4 3 5 6 7 4 5
R92 4 3 1 4 3 2 4 0 3 2 1 4 5 3 2 1 4 3 6 2 5 4 6 5 4 6 2 5 4 3 6 7 5 4 3 6 5
R105 3 4 4 1 2 3 1 3 0 1 2 3 2 2 3 4 1 2 3 5 2 3 5 4 5 3 5 2 3 4 5 4 4 5 6 3 4
R114 2 3 3 2 1 2 2 2 1 0 1 4 3 3 2 3 2 1 4 4 3 2 6 5 4 4 4 3 2 3 6 5 5 4 5 4 3
R123 3 2 2 3 2 1 3 1 2 1 0 5 4 4 3 2 3 2 5 3 4 3 7 6 5 5 3 4 3 2 7 6 6 5 4 5 4
R134 4 5 5 4 5 6 2 4 3 4 5 0 1 1 2 3 2 3 4 6 5 6 2 3 4 4 6 5 6 7 2 3 3 4 5 4 5
R145 3 4 6 3 4 5 1 5 2 3 4 1 0 2 3 4 1 2 3 7 4 5 3 4 5 3 7 4 5 6 3 2 4 5 6 3 4
R155 5 6 4 3 4 5 3 3 2 3 4 1 2 0 1 2 1 2 5 5 4 5 3 2 3 5 5 4 5 6 3 4 2 3 4 3 4
R164 4 5 3 4 3 4 4 2 3 2 3 2 3 1 0 1 2 1 6 4 5 4 4 3 2 6 4 5 4 5 4 5 3 2 3 4 3
R173 5 4 2 5 4 3 5 1 4 3 2 3 4 2 1 0 3 2 7 3 6 5 5 4 3 7 3 6 5 4 5 6 4 3 2 5 4
R186 4 5 5 2 3 4 2 4 1 2 3 2 1 1 2 3 0 1 4 6 3 4 4 3 4 4 6 3 4 5 4 3 3 4 5 2 3
R195 3 4 4 3 2 3 3 3 2 1 2 3 2 2 1 2 1 0 5 5 4 3 5 4 3 5 5 4 3 4 5 4 4 3 4 3 2
R206 4 5 7 4 5 6 2 6 3 4 5 4 3 5 6 7 4 5 0 4 1 2 2 3 4 2 6 3 4 5 4 3 5 6 7 4 5
R214 6 5 3 6 5 4 6 2 5 4 3 6 7 5 4 3 6 5 4 0 3 2 4 3 2 6 2 5 4 3 6 7 5 4 3 6 5
R227 5 6 6 3 4 5 3 5 2 3 4 5 4 4 5 6 3 4 1 3 0 1 3 2 3 3 5 2 3 4 5 4 4 5 6 3 4
R236 4 5 5 4 3 4 4 4 3 2 3 6 5 5 4 5 4 3 2 2 1 0 4 3 2 4 4 3 2 3 6 5 5 4 5 4 3
R246 6 7 7 6 7 8 4 6 5 6 7 2 3 3 4 5 4 5 2 4 3 4 0 1 2 4 6 5 6 7 2 3 3 4 5 4 5
R257 7 8 6 5 6 7 5 5 4 5 6 3 4 2 3 4 3 4 3 3 2 3 1 0 1 5 5 4 5 6 3 4 2 3 4 3 4
R266 6 7 5 6 5 6 6 4 5 4 5 4 5 3 2 3 4 3 4 2 3 2 2 1 0 6 4 5 4 5 4 5 3 2 3 4 3
R276 4 5 7 4 5 6 2 6 3 4 5 4 3 5 6 7 4 5 2 6 3 4 4 5 6 0 4 1 2 3 2 1 3 4 5 2 3
R284 6 5 3 6 5 4 6 2 5 4 3 6 7 5 4 3 6 5 6 2 5 4 6 5 4 4 0 3 2 1 4 5 3 2 1 4 3
R297 5 6 6 3 4 5 3 5 2 3 4 5 4 4 5 6 3 4 3 5 2 3 5 4 5 1 3 0 1 2 3 2 2 3 4 1 2
R306 4 5 5 4 3 4 4 4 3 2 3 6 5 5 4 5 4 3 4 4 3 2 6 5 4 2 2 1 0 1 4 3 3 2 3 2 1
R315 5 4 4 5 4 3 5 3 4 3 2 7 6 6 5 4 5 4 5 3 4 3 7 6 5 3 1 2 1 0 5 4 4 3 2 3 2
R326 6 7 7 6 7 8 4 6 5 6 7 2 3 3 4 5 4 5 4 6 5 6 2 3 4 2 4 3 4 5 0 1 1 2 3 2 3
R337 5 6 8 5 6 7 3 7 4 5 6 3 2 4 5 6 3 4 3 7 4 5 3 4 5 1 5 2 3 4 1 0 2 3 4 1 2
R347 7 8 6 5 6 7 5 5 4 5 6 3 4 2 3 4 3 4 5 5 4 5 3 2 3 3 3 2 3 4 1 2 0 1 2 1 2
R356 6 7 5 6 5 6 6 4 5 4 5 4 5 3 2 3 4 3 6 4 5 4 4 3 2 4 2 3 2 3 2 3 1 0 1 2 1
R365 7 6 4 7 6 5 7 3 6 5 4 5 6 4 3 2 5 4 7 3 6 5 5 4 3 5 1 4 3 2 3 4 2 1 0 3 2
R378 6 7 7 4 5 6 4 6 3 4 5 4 3 3 4 5 2 3 4 6 3 4 4 3 4 2 4 1 2 3 2 1 1 2 3 0 1
R387 5 6 6 5 4 5 5 5 4 3 4 5 4 4 3 4 3 2 5 5 4 3 5 4 3 3 3 2 1 2 3 2 2 1 2 1 0
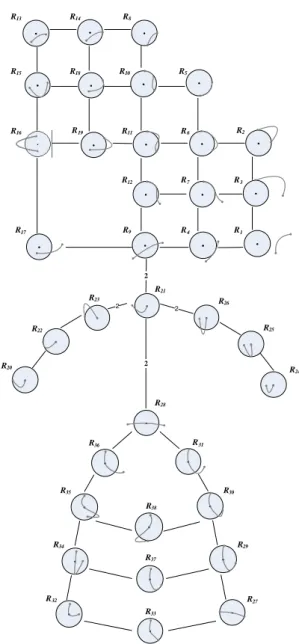
Based on the calculated topological distances, a conceptual neighborhood graph was identified. Fig. 2 presents the obtained graph, where the closest relations of each topological relation are connected.
2
2
2 2
R21
R13 R14 R8
R15 R18 R10 R5
R16 R19 R11 R6 R2
R3
R7
R12
R9 R4 R1
R17
R20
R22
R23
R24
R25
R26
R28
R27
R33
R32
R34
R37
R29
R38
R35 R30
R36 R31
The graph is virtually divided in three parts. In the upper part, the 19 topological relations do not verify any intersection between the pivot of the CSEP and the line. If the pivot of the spatially extended point is ignored, making a CSEP equal to a region, these 19 topological spatial relations correspond to the 19 topological spatial relations identified in [7] for line-region relations. The middle of the graph contains the relations in which one of the boundaries of the line intersects the pivot of the CSEP. The lower part of the graph contains the topological relations in which the pivot of the CSEP is intersected by the interior of the line. These three parts are linked by relation 21 (R21) that presents edges to
relations 9, 23, 26 and 28 (R9, R23, R26 and R28) with the
minimum topological distance of 2. All the other edges, and as previously mentioned, link spatial relations with topological distance equal to 1.
III. CONCEPTUAL NEIGHBORHOOD GRAPH WITH THE SMOOTH-TRANSITION MODEL
The smooth-transition model states that two relations are conceptual neighbors if there is a smooth-transition from one relation to the other. Egenhofer and Mark [7] define a smooth- -transition as an infinitesimally small deformation that changes the topological relation. Attending to the adopted 12-intersection matrix, the existence of a smooth- -transition means that an intersection or its adjacent intersection changes from empty to non-empty or reverse. The concept of adjacency between the several parts (interior, boundary and exterior) of a region (R) is formalized as [7]:
Adjacent (R°) = ∂R Adjacent (∂R) = R° and R -Adjacent (R-) = ∂R
In the context of this work, the notion of adjacency needs to be adapted to the several parts of a CSEP. For a CSEP (P) we have:
Adjacent (P•) = P° Adjacent (P°) = P• and ∂P Adjacent (∂P) = P° and P -Adjacent (P-) = ∂P
Following the work of Egenhofer and Mark [7], the changes that can occur in the smooth-transition model between a line and a region are associated with moving the boundary of the line to an adjacent part of the region or pushing the interior of the line to an adjacent part of the region. In this work this principles are adopted and adapted in order to change the parts of a region to the parts of a CSEP.
For the definition of the conditions that allow the identification of the conceptual neighbors the notion of extent was introduced [7]. It represents the number of non-empty intersections existing between the line and the four parts of the CSEP. If the interior of the line is completely located in the exterior of the CSEP then the extent of this relation is 1 (Extent(P, L°)=1). This is the case of R1. If the interior of the
line intersects the four parts of the CSEP then the extent of the relation is 4 (Extent(P, L°)=4) and this is verified in relations like R28 or R30.
Using the Adjacent and Extent concepts, the smooth- -transitions that can occur between a CSEP (P) and a line (L) can be formalized as follows.
Condition I. If the two boundaries of L intersect the same part of P then the intersection must be extended to the adjacent parts of P (Equation 3).
[ ]
(
)
[
]
(
φ)
φ ¬ = ∂ ¬ = ∂ ∀ ⇒ = ∂ ∈ • ∂ − : ), ( : , 1 ) , ( } , , , { L i Adjacent M L i M L P Extent Neighbor P P P P
i (3)
Condition II. If the two boundaries of L intersect different parts of P then the intersection must be extended to the adjacent parts of P (Equation 4).
[ ]
(
)
[ ]
(
φ)
(
[
]
φ)
φ ¬ = ∂ ∧ = ∂ ¬ = ∂ ∀ ⇒ = ∂ ∈ • ∂ − : ), ( : , : , 2 ) , ( } , , , { L i Adjacent M L i M L i M L P Extent Neighbor Neighbor P P P P
i (4)
Condition III. The intersection of L’s interior must be moved to an adjacent part of P (Equation 5).
[ ]
(
)
[
]
(
φ)
φ ¬ = ¬ = ∀∈ • ∂ − : ), ( : , } , , , { L i Adjacent M L i M Neighbor P P P P
i (5)
Condition IV. The intersection of L’s interior with the parts of P must be reduced (Equations 6, 7 and 8).
[ ]
(
)
[ ]
(
φ)
φ = ¬ = ∀ ⇒ = ∈ • ∂ − : , : , 2 ) , ( } , , , { L i M L i M L P Extent Neighbor P P P P
i (6)
[ ]
(
)
[ ]
(
φ)
φ = ¬ = ∀ ⇒ = ∈ • ∂ − : , : , 3 ) , ( } , , , { L i M L i M L P Extent Neighbor P P P P
i (7)
[ ]
(
)
[ ]
(
φ)
φ = ¬ = ∀ ⇒ = ∈ • − : , : , 4 ) , ( } , , { L i M L i M L P Extent Neighbor P P P
i (8)
The established conditions to the smooth-transitions may generate impossible patterns (in terms of the topological spatial relations that can actually exist). This impossible patterns need to be identified and eliminated from the set of valid ones (possible conceptual neighbors). One simple validation can be done by checking if the identified conceptual neighbor does match with one of the intersections matrices that are the possible topological spatial relations [1, 2]. If not, certainly that represents an impossible pattern. Although this simple validation, Egenhofer and Mark [7] defined two consistency constraints that are here adopted and extended in order to consider the specific case of the topological spatial relations that can exist between a CSEP (P) and a line (L). These constraints limit the possible transitions that can occur following conditions I to IV in order to guarantee that the identified patterns are valid. In that sense, these constraints are equivalent to some of the conditions used in the identification of the topological spatial relations that can exist between a CSEP and line [1, 2].
Constraint I. If L’s interior intersects with P’s interior and exterior, then it must also intersect P’s boundary (Equation 9).
[
]
=¬φ∧[
−]
=¬φ⇒[
∂]
=¬φ: , ,
,L M P L M P L
P
M (9)
[
P,∂L]
=¬φ⇒M[
P,L]
:=¬φM (10)
[
− ∂]
=¬φ⇒[
−]
=¬φ: ,
, L M P L
P
M (11)
Constraint III. P’s pivot can only intersect with a single part of L (Equations 12, 13 and 14).
[
•]
=¬φ⇒[
• ∂]
=φ∧[
• −]
=φ: , :
,
,L M P L M P L
P
M (12)
[
P•,∂L]
=¬φ⇒M[
P•,L]
:=φ∧M[
P•,L−]
:=φM (13)
[
P•,L−]
=¬φ⇒M[
P•,L]
:=φ∧M[
P•,∂L]
:=φM (14)
In order to exemplify the use of these conditions to identify the conceptual neighborhood graph using the smooth-transition model, let us consider Condition I and the corresponding Equation 3. Taking R1 and its corresponding
M1, Table III shows the neighbors identification process. For
the initial relation R1 and after the application of Equation 3 a
matrix is identified with a valid pattern that corresponds to R3
meaning that an edge linking these two relations in the conceptual neighborhood graph is needed. Another example, using the same Equation 3, is also presented in Table III. For the initial relation R13, and as P’s interior has two the adjacent
parts, P’s pivot and P’s boundary, two matrices are identified, each one of them corresponding to a valid pattern R14 and R24.
In this case, two of the neighbors of R13 are R14 and R24.
Table III – Smooth-transition model: an example R1 M1 ⎥ ⎥ ⎥ ⎥ ⎦ ⎤ ⎢ ⎢ ⎢ ⎢ ⎣ ⎡ 1 1 1 1 0 0 1 0 0 1 0 0
[
]
[ ] ⎥ ⎥ ⎥ ⎥ ⎦ ⎤ ⎢ ⎢ ⎢ ⎢ ⎣ ⎡ ⇔ = ∂ ∂ ⇔ = ∂ ⇒ = ∂ − 1 1 1 1 1 0 1 0 0 1 0 0 1 : , 1 : ), ( 1 ) , ( L P M L P Adjacent M L P Extent Neighbor Neighbor R3 M3 ⎥ ⎥ ⎥ ⎥ ⎦ ⎤ ⎢ ⎢ ⎢ ⎢ ⎣ ⎡ 1 1 1 1 1 0 1 0 0 1 0 0 R13 M13 ⎥ ⎥ ⎥ ⎥ ⎦ ⎤ ⎢ ⎢ ⎢ ⎢ ⎣ ⎡ 1 0 0 1 0 0 1 1 1 1 0 0[
]
[
]
⎥ ⎥ ⎥ ⎥ ⎦ ⎤ ⎢ ⎢ ⎢ ⎢ ⎣ ⎡ ⇔ = ∂ ⇔ = ∂ ⇒ = ∂ • 1 0 0 1 0 0 1 1 1 0 1 0 1 : , 1 : ), ( 1 ) , ( º L P M L P Adjacent M L P Extent Neighbor Neighbor[
]
[ ] ⎥ ⎥ ⎥ ⎥ ⎦ ⎤ ⎢ ⎢ ⎢ ⎢ ⎣ ⎡ ⇔ = ∂ ∂ ⇔ = ∂ ⇒ = ∂ 1 0 0 1 1 0 1 1 1 1 0 0 1 : , 1 : ), ( 1 ) , ( º L P M L P Adjacent M L P Extent Neighbor Neighbor R24 M24 ⎥ ⎥ ⎥ ⎥ ⎦ ⎤ ⎢ ⎢ ⎢ ⎢ ⎣ ⎡ 1 0 0 1 0 0 1 1 1 0 1 0 R14 M14 ⎥ ⎥ ⎥ ⎥ ⎦ ⎤ ⎢ ⎢ ⎢ ⎢ ⎣ ⎡ 1 0 0 1 1 0 1 1 1 1 0 0Applying Condition I to Condition IV, Constraint I to Constraint III, and their respective equations (3 to 14), the
several links between relations in the conceptual neighborhood graph were identified. The corresponding graph has 83 edges linking 38 topological spatial relations, and is showed in Fig. 3. The complexity of the graph results from the fact that 11 relations have 5 conceptual neighbors, and 6 relations have 6 conceptual neighbors. By comparison, in the graph obtained through the snapshot model each relation has a maximum of 4 neighbors, resulting in a total of 51 edges.
Fig. 3 – Conceptual neighborhood graph: smooth-transition IV. COMPARISON OF THE TWO CONCEPTUAL
NEIGHBORHOOD GRAPHS
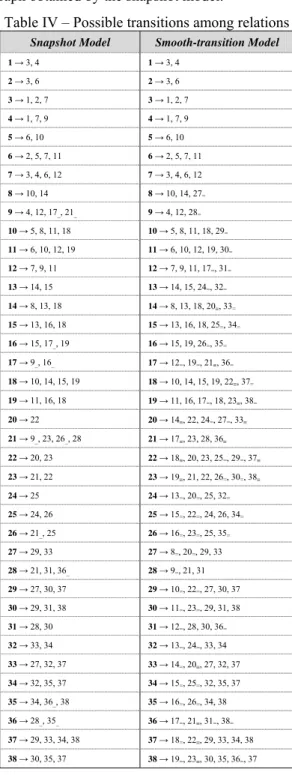
highlighted the main differences between them. It also allowed the validation of the two graphs, as the transitions between spatial relations were analyzed to see whether they are possible or not. These verifications ensure that the graphs accomplish the principles that guided their identification. One of the main differences between the two graphs, as shown in Table IV, is the list of the possible transitions between the 38 topological spatial relations. The notation used in this table is as follows:
• n, for common transitions among relations in the two graphs;
• n-, for transitions allowed in the graph obtained by the
snapshot model and not possible in the graph obtained by the smooth-transition model;
• n= and n≡, for transitions allowed in the graph obtained by the smooth-transition model and not possible in the graph obtained by the snapshot model.
Table IV – Possible transitions among relations
Snapshot Model Smooth-transition Model
1→ 3, 4 1 → 3, 4
2→ 3, 6 2→ 3, 6
3→ 1, 2, 7 3→ 1, 2, 7
4 → 1, 7, 9 4→ 1, 7, 9
5→ 6, 10 5→ 6, 10
6 → 2, 5, 7, 11 6 → 2, 5, 7, 11
7 → 3, 4, 6, 12 7 → 3, 4, 6, 12
8→ 10, 14 8 → 10, 14, 27=
9→ 4, 12, 17_, 21_ 9 → 4, 12, 28=
10→ 5, 8, 11, 18 10→ 5, 8, 11, 18, 29=
11 → 6, 10, 12, 19 11 → 6, 10, 12, 19, 30=
12 → 7, 9, 11 12 → 7, 9, 11, 17=, 31=
13 → 14, 15 13 → 14, 15, 24=, 32=
14 → 8, 13, 18 14→ 8, 13, 18, 20≡, 33=
15 → 13, 16, 18 15→ 13, 16, 18, 25=, 34=
16 → 15, 17_, 19 16→ 15, 19, 26=, 35=
17 → 9_, 16_ 17→ 12=, 19=, 21≡, 36=
18 → 10, 14, 15, 19 18→ 10, 14, 15, 19, 22≡, 37=
19→ 11, 16, 18 19→ 11, 16, 17=, 18, 23≡, 38=
20→ 22 20→ 14≡, 22, 24=, 27=, 33≡
21→ 9_, 23, 26_, 28 21→ 17≡, 23, 28, 36≡
22→ 20, 23 22→ 18≡, 20, 23, 25=, 29=, 37≡
23→ 21, 22 23→ 19≡, 21, 22, 26=, 30=, 38≡
24→ 25 24→ 13=, 20=, 25, 32=
25→ 24, 26 25→ 15=, 22=, 24, 26, 34=
26→ 21_, 25 26→ 16=, 23=, 25, 35=
27→ 29, 33 27→ 8=, 20=, 29, 33
28→ 21, 31, 36_ 28→ 9=, 21, 31
29→ 27, 30, 37 29→ 10=, 22=, 27, 30, 37
30→ 29, 31, 38 30→ 11=, 23=, 29, 31, 38
31→ 28, 30 31→ 12=, 28, 30, 36=
32→ 33, 34 32→ 13=, 24=, 33, 34
33→ 27, 32, 37 33 → 14=, 20≡, 27, 32, 37
34→ 32, 35, 37 34→ 15=, 25=, 32, 35, 37
35→ 34, 36_, 38 35→ 16=, 26=, 34, 38
36→ 28_, 35_ 36→ 17=, 21≡, 31=, 38=
37→ 29, 33, 34, 38 37→ 18=, 22≡, 29, 33, 34, 38
38→ 30, 35, 37 38→ 19=, 23≡, 30, 35, 36=, 37
From the analysis of Table IV one can see that the graph obtained following the smooth-transition model integrates almost all the edges (transitions) identified by the snapshot model. Two exceptions are verified: one is associated with relation 17 (R17) and the other with relation 36 (R36). In all
other cases the graph obtained by the smooth-transition model allows more transitions since it looks for small deformations that change the topological relations. In what concerns R17 and R36, the snapshot model includes transitions
from those relations to other relations with topological distance 1. Although this is the minimum value for the topological distance it does not correspond to the smallest amount of changes that can affect the objects. Looking at R17,
this relation has transitions to relation 9 (R9) and relation 16
(R16). In the smooth-transition model these transitions are not
possible since R17 has one of the line’s boundaries
intersecting the interior of the CSEP and the other boundary intersecting the exterior of the CSEP. Any small deformation in R17 includes the movement of one of the line’s boundaries
to an Adjacent part of the intersected component of the CSEP. Following this, the intersection between one line’s boundary and the CSEP’s interior is moved to the Adjacent parts of CSEP’s interior (its pivot and its boundary), allowing the transitions to relation 12 (R12) and relation 21 (R21), or the
intersection between the other line’s boundary and the CSEP’s exterior is moved to the Adjacent part of CSEP’s exterior (its boundary), allowing the transition to relation 19 (R19). The other possible transition for R17 allowed in the
smooth-transition model is obtained moving the line’s interior to an Adjacent part of CSEP’s interior (its pivot in this specific case since the boundary already has an intersection in this relation) leading to relation 36 (R36).
Looking at the possible transitions for R36 in the snapshot
model, which are different from the allowed ones in the smooth–transition model, one can see that the differences are due to the movement of the line’s boundaries, as explained above for R17.
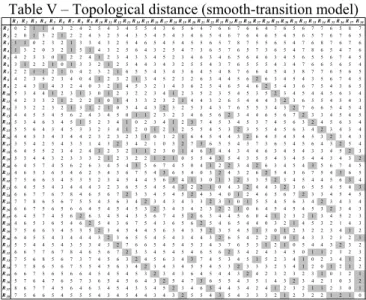
Table V – Topological distance (smooth-transition model)
R1R2R3R4R5R6R7R8R9R10R11R12R13R14R15R16R17R18R19R20R21R22R23R24R25R26R27R28R29R30R31R32R33R34R35R36R37R38
R10 2 1 1 4 3 2 4 2 5 4 3 4 5 5 4 3 6 5 6 4 7 6 6 7 6 6 4 7 6 5 6 7 7 6 5 8 7 R22 0 1 3 2 1 2 2 4 3 2 3 4 3 5 4 5 4 3 4 6 5 4 6 7 6 4 6 5 4 5 6 5 7 6 7 6 5 R31 1 0 2 3 2 1 3 3 4 3 2 5 4 6 5 4 5 4 5 5 6 5 7 8 7 5 5 6 5 4 7 6 8 7 6 7 6 R41 3 2 0 3 2 1 5 1 4 3 2 5 6 4 3 2 5 4 7 3 6 5 7 6 5 7 3 6 5 4 7 8 6 5 4 7 6 R54 2 3 3 0 1 2 2 4 1 2 3 4 3 3 4 5 2 3 4 6 3 4 6 5 6 4 6 3 4 5 6 5 5 6 7 4 5 R63 1 2 2 1 0 1 3 3 2 1 2 5 4 4 3 4 3 2 5 5 4 3 7 6 5 5 5 4 3 4 7 6 6 5 6 5 4 R72 2 1 1 2 1 0 4 2 3 2 1 6 5 5 4 3 4 3 6 4 5 4 8 7 6 6 4 5 4 3 8 7 7 6 5 6 5 R84 2 3 5 2 3 4 0 4 1 2 3 2 1 3 4 5 2 3 2 6 3 4 4 5 6 2 6 3 4 5 4 3 5 6 7 4 5 R92 4 3 1 4 3 2 4 0 3 2 1 4 5 3 2 1 4 3 6 2 5 4 6 5 4 6 2 5 4 3 6 7 5 4 3 6 5 R105 3 4 4 1 2 3 1 3 0 1 2 3 2 2 3 4 1 2 3 5 2 3 5 4 5 3 5 2 3 4 5 4 4 5 6 3 4 R114 2 3 3 2 1 2 2 2 1 0 1 4 3 3 2 3 2 1 4 4 3 2 6 5 4 4 4 3 2 3 6 5 5 4 5 4 3 R123 3 2 2 3 2 1 3 1 2 1 0 5 4 4 3 2 3 2 5 3 4 3 7 6 5 5 3 4 3 2 7 6 6 5 4 5 4
R134 4 5 5 4 5 6 2 4 3 4 5 0 1 1 2 3 2 3 4 6 5 6 2 3 4 4 6 5 6 7 2 3 3 4 5 4 5 R145 3 4 6 3 4 5 1 5 2 3 4 1 0 2 3 4 1 2 3 7 4 5 3 4 5 3 7 4 5 6 3 2 4 5 6 3 4 R155 5 6 4 3 4 5 3 3 2 3 4 1 2 0 1 2 1 2 5 5 4 5 3 2 3 5 5 4 5 6 3 4 2 3 4 3 4 R164 4 5 3 4 3 4 4 2 3 2 3 2 3 1 0 1 2 1 6 4 5 4 4 3 2 6 4 5 4 5 4 5 3 2 3 4 3 R173 5 4 2 5 4 3 5 1 4 3 2 3 4 2 1 0 3 2 7 3 6 5 5 4 3 7 3 6 5 4 5 6 4 3 2 5 4 R186 4 5 5 2 3 4 2 4 1 2 3 2 1 1 2 3 0 1 4 6 3 4 4 3 4 4 6 3 4 5 4 3 3 4 5 2 3 R195 3 4 4 3 2 3 3 3 2 1 2 3 2 2 1 2 1 0 5 5 4 3 5 4 3 5 5 4 3 4 5 4 4 3 4 3 2 R206 4 5 7 4 5 6 2 6 3 4 5 4 3 5 6 7 4 5 0 4 1 2 2 3 4 2 6 3 4 5 4 3 5 6 7 4 5 R214 6 5 3 6 5 4 6 2 5 4 3 6 7 5 4 3 6 5 4 0 3 2 4 3 2 6 2 5 4 3 6 7 5 4 3 6 5 R227 5 6 6 3 4 5 3 5 2 3 4 5 4 4 5 6 3 4 1 3 0 1 3 2 3 3 5 2 3 4 5 4 4 5 6 3 4 R236 4 5 5 4 3 4 4 4 3 2 3 6 5 5 4 5 4 3 2 2 1 0 4 3 2 4 4 3 2 3 6 5 5 4 5 4 3 R246 6 7 7 6 7 8 4 6 5 6 7 2 3 3 4 5 4 5 2 4 3 4 0 1 2 4 6 5 6 7 2 3 3 4 5 4 5 R257 7 8 6 5 6 7 5 5 4 5 6 3 4 2 3 4 3 4 3 3 2 3 1 0 1 5 5 4 5 6 3 4 2 3 4 3 4 R266 6 7 5 6 5 6 6 4 5 4 5 4 5 3 2 3 4 3 4 2 3 2 2 1 0 6 4 5 4 5 4 5 3 2 3 4 3 R276 4 5 7 4 5 6 2 6 3 4 5 4 3 5 6 7 4 5 2 6 3 4 4 5 6 0 4 1 2 3 2 1 3 4 5 2 3 R284 6 5 3 6 5 4 6 2 5 4 3 6 7 5 4 3 6 5 6 2 5 4 6 5 4 4 0 3 2 1 4 5 3 2 1 4 3 R297 5 6 6 3 4 5 3 5 2 3 4 5 4 4 5 6 3 4 3 5 2 3 5 4 5 1 3 0 1 2 3 2 2 3 4 1 2 R306 4 5 5 4 3 4 4 4 3 2 3 6 5 5 4 5 4 3 4 4 3 2 6 5 4 2 2 1 0 1 4 3 3 2 3 2 1 R315 5 4 4 5 4 3 5 3 4 3 2 7 6 6 5 4 5 4 5 3 4 3 7 6 5 3 1 2 1 0 5 4 4 3 2 3 2 R326 6 7 7 6 7 8 4 6 5 6 7 2 3 3 4 5 4 5 4 6 5 6 2 3 4 2 4 3 4 5 0 1 1 2 3 2 3 R337 5 6 8 5 6 7 3 7 4 5 6 3 2 4 5 6 3 4 3 7 4 5 3 4 5 1 5 2 3 4 1 0 2 3 4 1 2 R347 7 8 6 5 6 7 5 5 4 5 6 3 4 2 3 4 3 4 5 5 4 5 3 2 3 3 3 2 3 4 1 2 0 1 2 1 2 R356 6 7 5 6 5 6 6 4 5 4 5 4 5 3 2 3 4 3 6 4 5 4 4 3 2 4 2 3 2 3 2 3 1 0 1 2 1 R365 7 6 4 7 6 5 7 3 6 5 4 5 6 4 3 2 5 4 7 3 6 5 5 4 3 5 1 4 3 2 3 4 2 1 0 3 2 R378 6 7 7 4 5 6 4 6 3 4 5 4 3 3 4 5 2 3 4 6 3 4 4 3 4 2 4 1 2 3 2 1 1 2 3 0 1 R387 5 6 6 5 4 5 5 5 4 3 4 5 4 4 3 4 3 2 5 5 4 3 5 4 3 3 3 2 1 2 3 2 2 1 2 1 0
To conclude this analysis we refer that in what concerns relations 1 to 7 (R1 to R7), the transitions allowed in the two
graphs are exactly the same (Table IV) since these relations are associated with lines that do not intersect the CSEP’s interior avoiding the Adjacent parts of this interior, which would be the pivot and the boundary of the CSEP and would increase the number of possible transitions.
V. TOPOLOGICAL DISTANCE IN PREDICTING MOVEMENT IN SPACE
As already stated in this paper, several models for topological relations have been developed. These models provide a computational basis for spatial reasoning relating the formal ground needed by an information system and the human perception of the geographic space [8].
Spatial relations between geographic objects are time-dependent and can change due to various phenomena. Models of changes are relevant to spatio-temporal reasoning as they allow for predictions related with the objects in analysis [5]. The objects involved are expected not to make discontinuous changes such as jumps, nor may the deformations destroy the topology of a single object, for example, tearing it into pieces.
For Galton [9], the phenomenon of movement arises whenever the same object occupies different positions in space at different moments. The given definition suggest that a theory of movement must include a theory of time, a theory of space, a theory of objects and a theory of position. Time can be treated as instants or as intervals, and an ordering relation need to be established, representing temporal sequences. Space integrates elements as points, lines or regions as fundamental entities. Objects present specific characteristics being capable of motion (or different types of motion), or not. Position integrates the theory of objects with the theory of space, with each object occupying a certain part of space at a specific time.
Looking at position, this work takes into account the topological constraints present in the space in which the user is moving, whilst trying to predict his/her future positions. The first step of this prediction process is concerned with the assignment of the user to a specific road segment in the road network. For this task, the topological distance can be used instead of the geometrical distance. The second step is
associated with the movement of the user along the road network, after his/her assignment to a road segment.
A user that moves from one point to another in a road network generates a trajectory. A user’s trajectory can be defined as a sequence of connected road segments or as a sequence of connected vertices between two locations [10]. Knowing a start point, the initial position, and an end point, the target destination, trajectories can be generated for the user.
If the destination of the user is unknown, the anticipation of his/her next position can be achieved following the transitions allowed in one of the conceptual neighborhood graphs identified in the previous sections. As an example, let us consider the road network represented in Fig. 4. In this example, the position of the user (in gray), obtained through a GPS receiver, does not overlap a specific road segment.
Fig. 4 – A user and a part of a road network
Analyzing the example, and being the user in an imprecise point in terms of the road network, how can the user be assigned to a specific road segment? The answer can be using the minimum topological distance that allows the intersection of the CSEP’s pivot and the road segments. Using the area of uncertainty associated with the user’s position, Fig. 5 presents the actual scenario, now with each road segment identified by a specific label.
1
s
2
s
3
s
4s
5
s
Fig. 5 – A user represented by a CSEP
Analyzing the topological spatial relations that exist between the CSEP and the neighbors’ road segments – s2, s3
and s4 – it is possible to verify that the spatial relations are R9,
R12 and R3, respectively. Following the conceptual
neighborhood graphs obtained through the snapshot model and the smooth-transition model, the closest spatial relations in which an intersection with the CSEP’s pivot is possible is R21 (for s2, s3 and s4), in the case of the snapshot model, and
R28 (for s2) and R31 (for s3 and s4), in the case of the
smooth-transition model. Tables II and V give us the topological distances among those relations:
• Snapshot model: i) topological distance of 2 between R9
and R21; ii) topological distance of 3 between R12 and
R21; iii) topological distance of 5 between R3 and R21.
• Smooth-transition model: i) topological distance of 2 between R9 and R28; ii) topological distance of 2 between
R12 and R31; iii) topological distance of 4 between R3 and
Following the snapshot model, the user would be assigned to s2 since this road segment presents the minimum
topological distance. Looking at the smooth-transition model, as it allows small deformations that change the topological relation, the user could be assigned to s2 or to s3
since both alternatives present the same topological distance. The question that can now be posted is: ignoring the topological spatial relations that can exist between the objects in analysis and the conceptual neighborhood graphs with the possible transitions, is it possible to predict the user’s position?
Map matching methods are used to locate a mobile user on a road network map. A simple way of performing map matching is to assign the position of the mobile user to the nearest road segment [11]. Although this method is simple to implement it can ignore alternative paths as only the nearest distance is considered and it can be difficult to implement in dense urban road networks. In order to improve the location capabilities, other methods have been proposed and developed. They usually consider historical information about the user’s motion (his/her past locations).
The prediction system that is envisaged in this work does not consider any previous knowledge about the user’s motion, for privacy reasons, and opens new possibilities in the exploration of the paths that can be followed by a mobile user, as several road segments can be associated to the user through the use of a CSEP.
If the geometrical representation of the user is done recurring to a single point that locates the user in a particular location, the prediction of the user’s next position depends upon the map matching location strategy used. Following the example presented in Fig. 4, Fig. 6 shows the assignment of the user to the nearest road segment present in the road network in analysis. As the user is not geometrically represented by a CSEP that topologically relates he/she to the other line segments, the user is located on segment s2, without
considering the s3 and s4 ways.
1
s
2
s
3
s
4
s
5
s
Fig. 6 – Assignment of the user to the nearest road segment The first step of the prediction process can consider the topological distance as an alternative or as a complement of the geometric distance (since a combination of both metrics can be considered). In the second step, the transitions allowed in the conceptual neighborhood graphs can be used to predict user’s future movements. In this case, graph paths can be generated considering the several alternatives present in the road network and the probability of following such alternatives (considering for instance the traffic load associated to each road segment).
VI. CONCLUSION
This paper presented the conceptual neighborhood graphs that represent the transitions that can occur between the
topological spatial relations that exit between a CSEP and a line. Two graphs were obtained. One using the principles associated with the snapshot model, which looks for the topological distances between relations, and the other using the principles associated with the smooth-transition model, which verifies any small deformation that changes the topological relations.
The two graphs were analyzed in order to verify if the identified transitions were possible or not, and also compared in order to identify the main differences between them. The graph obtained through the smooth-transition model presents a more complex structure integrating more edges. This means that more transitions are allowed.
This work constitutes a basis for dealing with spatial objects that can be represented geometrically by a CSEP and a line, and is suitable for reasoning about gradual changes in topology. These changes can be associated with objects’ motion and/or deformations over time [8].
ACKNOWLEDGMENT
We thank Professor Filomena Louro for her revision of the English writing of this paper.
REFERENCES
[1] Santos, M.Y. and A. Moreira, Topological Spatial Relations between a Spatially Extended Point and a Line for Predicting Movement in Space. In Proceedings of the 10th AGILE Conference on Geographic
Information Science. 2007. Aalborg, Denmark.
[2] Santos, M.Y. and A. Moreira, How a Circular Spatially Extended Point is topological related with a Line? The 2009 International Conference of Computational Intelligence and Intelligent Systems. July, 2009. London, England.
[3] Wuersch, M. and D. Caduff, Refined Route Instructions Using Topological Stages of Closeness. In 5th International Workshop on
Web and Wireless Geographical Information Systems. 2005. Lausanne, Switzerland: Springer-Verlag.
[4] Wuersch, M. and D. Caduff, Region-based Pedestrian Navigation: Route Instructions based on Topological Stages of Closeness.In 4th
International Conference on Geographic Information Science - GIScience'2006. 2006. Munique, Germany.
[5] Egenhofer, M.J. and K.K. Al-Taha, "Reasoning about Gradual Changes of Topological Relations", In Theory and Methods of Spatio-Temporal Reasoning in Geographic Space, A. Frank, I. Campari, and U. Formentini, Editors. 1992, Lectures Notes on Computer Science 639, p. 196-219.
[6] Reis, R., M. Egenhofer, and J. Matos, Topological relations using two models of uncertainty for lines. In 7th International Symposium on Spatial Data Accuracy Assessment in Natural Resources and Environment Sciences. 2006. Lisbon, Portugal.
[7] Egenhofer, M.J. and D.M. Mark, "Modeling Conceptual Neighborhoods of Topological Line-Region Relations". International Journal of Geographical Information Systems, 1995. 9(5): p. 555-565. [8] Clementini, E. and P.D. Felice, "Approximate Topological Relations". International Journal of Approximate Reasoning, 1997(16): p. 173-204.
[9] Galton, A., Towards a Qualitative Theory of Movement. In Spatial Information Theory: A Theoretical Basis for GIS - International Conference COSIT'95. 1995: Lectures Notes on Computer Science 988.
[10] Karimi, H.A. and X. Liu, A Predictive Location Model for Location-Based Services. In Proceedings of the 11th. ACM International Symposium on Advances in Geographic Information Systems. 2003. New Orleans, USA.