Human Electroretinal Responses to Grating
Patterns and Defocus Changes by Global
Flash Multifocal Electroretinogram
Man Pan Chin☯☯, Patrick H. W. Chu☯☯, Allen M. Y. Cheong, Henry H. L. Chan *
Laboratory of Experimental Optometry (Neuroscience), School of Optometry, Hong Kong Polytechnic University, Hong Kong SAR, China
☯These authors contributed equally to this work. *[email protected]
Abstract
The electrical response of the retina was examined as a function of retinal region, using sti-muli of various spatial frequencies in the first experiment. In the second experiment, the re-gional response of the retina to defocus at high and low spatial frequencies was
investigated. Twenty three subjects were recruited for global flash multifocal electroretino-gram (mfERG) in experiment 1. Black and white gratings (printed on plastic transparent sheets) of four spatial frequencies (SF), 0.24, 1.2, 2.4 and 4.8 cycle per degree were pre-sented in front of the mfERG stimulation. The amplitudes and implicit times of the direct (DC) and induced (IC) components of mfERG responses were pooled into six concentric rings for analysis. There was low amplitude DC at low SF, which increased with increasing SF, and which decreased with increasing eccentricity. The IC was high in amplitude at all SF and reduced in amplitude with increasing eccentricity. Our findings suggested that outer and inner retina had different characteristics in processing spatial details. In experiment 2, Twenty-three young adults were recruited for mfERG measurement. The retinal electrical responses for low (0.24cpd) and high (4.8cpd) SF under fully corrected conditions of short-term negative defocus (-2D) and short short-term positive defocus (+2D) conditions were mea-sured. There was a sign-dependent response to defocus in the DC response, mainly in pe-ripheral regions. The sign dependent response at low SF was more obvious than that at high SF, and was located more peripherally. The IC response showed no clear trends for ei-ther defocus condition. The human retina seems to have a decoding system for optical defo-cus, which was tuned for low spatial frequency, and was located in the retinal near
periphery.
Introduction
With the exceedingly fast growing population of myopia (short-sightedness) in the world, my-opia becomes an important global public health problem [1–3]. In the past few decades, many
OPEN ACCESS
Citation:Chin MP, Chu PHW, Cheong AMY, Chan
HHL (2015) Human Electroretinal Responses to Grating Patterns and Defocus Changes by Global Flash Multifocal Electroretinogram. PLoS ONE 10(4): e0123480. doi:10.1371/journal.pone.0123480
Academic Editor:Alfred S Lewin, University of Florida, UNITED STATES
Received:October 29, 2014
Accepted:February 19, 2015
Published:April 13, 2015
Copyright:© 2015 Chin et al. This is an open access article distributed under the terms of the
Creative Commons Attribution License, which permits unrestricted use, distribution, and reproduction in any medium, provided the original author and source are credited.
Data Availability Statement:All relevant data are within the paper and its Supporting Information files.
Funding:This study was supported by the General Research Fund (PolyU 5605/13M) from The Research Grants Committee of the Hong Kong SAR and the associated fund (Research Postgraduate) from The Hong Kong Polytechnic University. The funders had no role in study design, data collection and analysis, decision to publish, or preparation of the manuscript.
Competing Interests:The authors have declared
studies have improved our understanding on myopia development, in particular the factors af-fecting the eye growth and refractive errors. The retina, as the first site of the visual pathway to receive visual signal, has been shown to be the locally controlled of eye growth [4–6], which is tightly influenced by visual experience. Partial/full deprivation of vision results in uncon-strained elongation of the eyeball, which corresponds to the myopia development, in animals (e.g. chicks[7,8], fish[9], guinea pig[10], mice[11], marmoset[12], rhesus macaque[13], tree shrew[14,15]) and human[16,17], reflecting the importance of visual stimulus for the regulat-ing eye growth. However, what types of visual stimulus are required for regulatregulat-ing the emme-tropization (i.e. free from refractive errors)? Visual stimulus projected onto the retina
comprises a wide range of spatial frequencies, which plausibly tune the emmetropization [18– 22]: Schmid and Wildsoet [21] found that exposure to spatial frequency within the range of 0.086 and 4.3 cycle per degree could inhibit form-deprived myopia in chick [21]. Although spa-tial frequency dependency of emmetropization appears to be tuned to middle spaspa-tial frequen-cies in animals [18,19,21,22], it is unclear whether similar spatial-frequency dependence occurs in human. Imposing defocuses or form deprivation at a local retinal area promotes re-gional eye growth [4–6], suggesting the predominance of local compensatory activity with feed-back mechanism in regulating the eye growth. Compelling evidences have demonstrated the significant role of retina in eye growth regulation (refer to Wallman [23] for a review). First, al-though the eye growth, as shown in the animal models, can be regulated by the imposed defo-cuses [24,25], it remains unclear how the retina decodes the sign and magnitude of defocuses. It is hypothesized that the retinal processing of eye growth-modulating visual stimuli relates to the activity of the amacrine cells [26,27]. Second, several biochemical messengers regulating the eye growth have been identified within the retinal level. The relationship between sign-de-pendent changes in the messengers’concentration and different signs of defocus (dopamine [28,29], retinoic acid [30,31] and glucagon [32,33]) further supports that the retina responds to the signs of defocus. This compensatory activity manipulates the eye growth to achieve the clear retinal image. It is a kind of local self-regulation for the adaptation to the environmental influence. More understanding on it will help to find out how self-regulation works in the reti-na. Since there is limited study for human, studying the retinal physiological interaction be-tween the visual stimulus and optical defocus in human eye allows better understanding of the underlying mechanism in eye growth.
The multifocal electroretinogram (mfERG) measures electrical activity of multiple retinal loci in response to light stimuli [34] and would be helpful in investigating how retina response to visual stimulus and defocus in various retinal regions. Ho and co-workers [35] measured the global flash (MOFO) multifocal electroretinogram (mfERG) in humans and noticed different physiological characteristics were obtained under hyperopic and myopic defocus conditions. In addition, peripheral retina showed a more vigorous change than central retina in response to optical defocus. In this study, we applied this methodology to examine the changes in retinal activities responding to specific spatial frequencies under different defocus conditions.
children. According to Hoet al. [35], the children at the age with myopia progression would
have physiological changes in retina, especially at the fovea, which would influence the investi-gation on the interaction between visual stimulus and optical defocus [37].
Methods
Experiment Setup
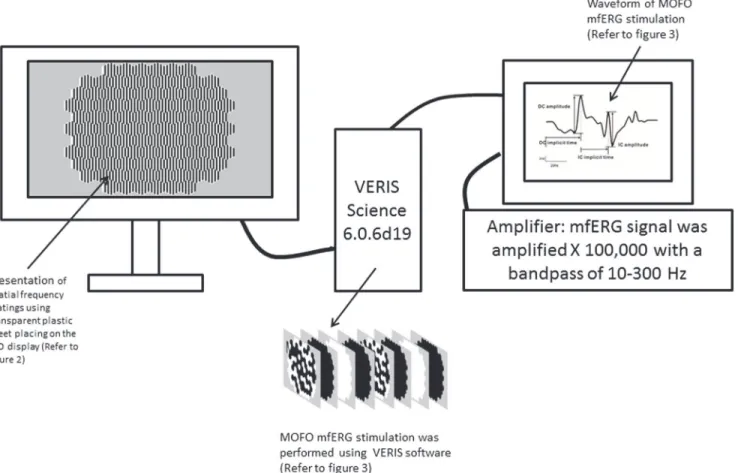
The schematic diagram of mfERG setup for experiment 1 and 2 is shown inFig 1. The spatial frequency (SFs) gratings (refer to“Presentation of grating stimuli”session) were presented on a 22-inch colour liquid crystal display monitor (Model: VX2260wm, ViewSonic, Hong Kong, China) during the mfERG stimulation. The mfERG stimulation (Refer to“Global flash mfERG stimulation”session) was performed using the Visual Evoked Response Imaging System soft-ware (VERIS Science 6.0.6d19; Electro-Diagnostic Imaging Inc., San Mateo, CA, USA). The stimulus array consisted of 103 non-scaled hexagons and the stimulus pattern subtended 33.7° vertically and 38.4° horizontally at a viewing distance of 40 cm. Non-scaled hexagons were used in this study to maintain the same SFs at different eccentricities.
Presentation of grating stimuli
The gratings were drawn precisely using Adobe Illustrator CS4. The outline of 103 hexagons was incorporated into the software. The gratings were precisely drawn and printed on
Fig 1. The schematic diagram of mfERG setup for experiment 1 and 2.The spatial frequency (SFs) gratings were presented on a 22-inch LCD display. The global flash mfERG stimulation was driven by VERIS Science 6.0.6d19. The mfERG signal was amplified X 100,000 with a bandpass of 10–300 Hz.
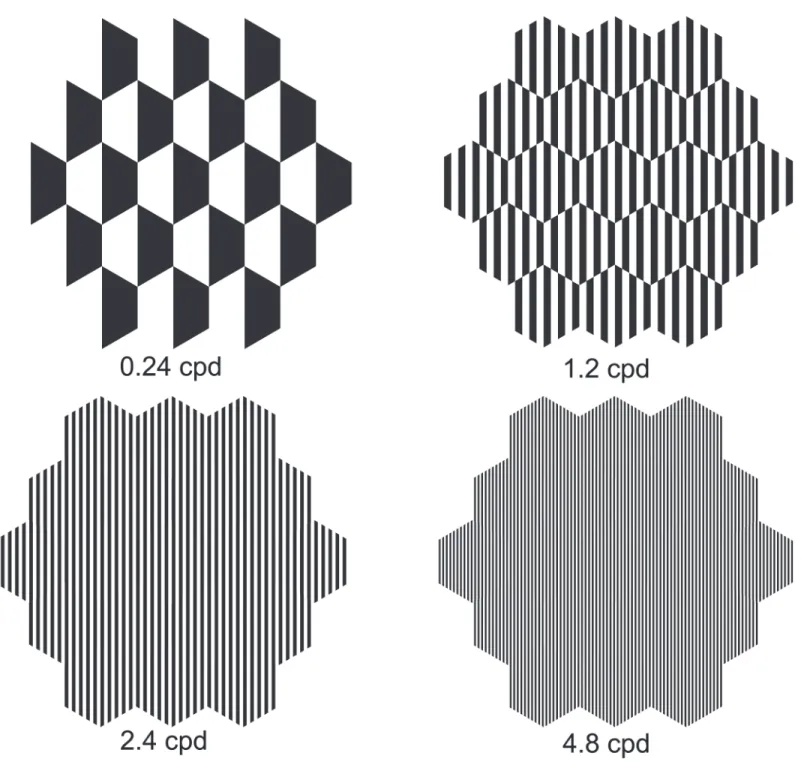
transparent film as alternating black and transparent stripes within each hexagon. The widths of the gratings were 14.4, 2.88, 1.44 and 0.72 mm, corresponding to spatial frequencies of 0.24, 1.2, 2.4 and 4.8 cycle per degree (cpd) at 40 cm (Fig 2). The spatial frequencies selected in this experiment is below nyquist limit of photoreceptors and ganglions[38], so 4.8cpd can still be
“resolved”by both outer and inner retina at peripheral 20. The luminance variations for differ-ent size of gratings in each hexagon during mfERG flash were minimized by presdiffer-enting equal areas of black stripes in all gratings. The luminance of individual hexagon overlaying the
Fig 2. Spatial frequency stimuli presented to subjects 1 for mfERG.Spatial frequencies of 0.24, 1.2, 2.4 and 4.8 cycle per cpd was presented. Only ring 1 to 3 were shown in the figure.
gratings was measured using a spectro-radiometer (Model: SR3, Topcon, Japan). The lumi-nance of whole individual hexagon was tried to measure by orientating size field of spectro-ra-diometer just within the individual hexagon. The luminance was found approximately the same whenever gratings were used.
Global flash mfERG stimulation
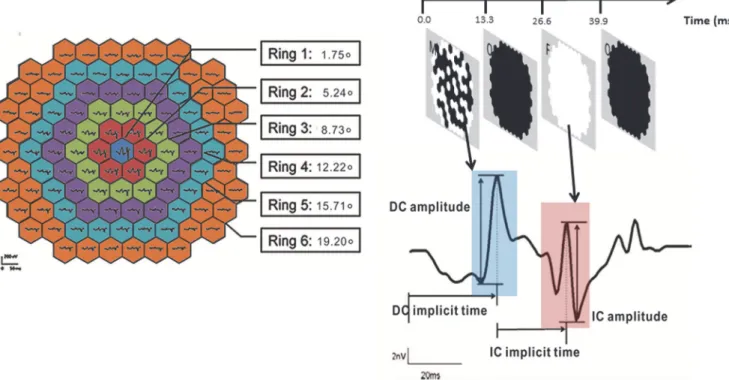
High contrast (96% contrast; bright phase, 180 cd/m2; dark phase, 4 cd/m2) global flash (MOFO) mfERG was selected to measure the retinal activity. In each cycle of MOFO mfERG stimulation, consisted of a pseudo-random focal flash (M), followed by a full-screen dark frame (O), a full-screen global flash (F), and another full-screen dark frame (O) (Fig 3). This can enhance the activity from inner retinal neurons, in order to obtain separate outer and inner retinal responses [35,39–44]. In this study, as grating patterns were presented on the dis-play during the measurement of each MOFO cycle, gratings were seen during the bright frames, thus M frame and F frame, while it became dark in the dark frames. And half the area of each hexagon was covered by dark strips of the gratings, the luminance of was reduced to half during M frame and F frame. All the grating patterns had the same number of black and white strips within each mfERG hexagonal stimulus and hence the measured luminance of dif-ferent grating patterns was the same. The ratio of global flash to focal flash was maintained at 1:1 in this study to obtain both optimal DC and IC responses [45]. The MOFO mfERG results in a direct component (DC) and an induced component (IC) which can be separately measured to assess the outer and inner retinal responses. In addition, regional variations of the responses can be observed in the same measurement period.
Fig 3. Schematic diagram for grouping the mfERG responses and the waveform of MOFO mfERG.Left: Both DC and IC responses were pooled into concentric rings with eccentricity from ring 1 (0°) to ring 6 (19.20°)Right: Schematic diagram for DC amplitude and implicit time, IC amplitude and implicit time of global flash mfERG.
Recordings
The mfERG responses were recorded using a Dawson–Trick–Litzkow (DTL) thread electrode, which was positioned on the inferior cornea along the lower lid margin. Gold-cup reference and ground surface electrodes were placed at the outer canthus of the tested eye and at the fore-head respectively. The pupil of the tested eye was dilated (>7mm) using 0.5% Tropicamide
(Alcon, Australia) and the tested eye was fully corrected for the viewing distance of 40cm dur-ing the mfERG recorddur-ing. The mfERG signal was amplified X 100,000 with a bandpass of 10–
300 Hz (Model: 15A54, Physiodata Amplifier system, Grass Technologies, Astro-Med, Inc., West Warwick, RI, USA). With the 212binary m-sequence used, the recording time for each condition was about 7 min and 17 sec. The recording was divided into 32 slightly overlapping segments, and subjects were permitted to rest between segments. Subjects were instructed to fixate the red-cross target in the middle of the central hexagon of the stimulus display. The electrical signals were monitored by the examiner using the real-time display provided by the VERIS system and any segments contaminated with blinks or other artifacts were discarded and re-recorded.
Subject recruitment
The criteria for recruiting subjects were the same in both experiment 1 and 2. Young adults were recruited from The Hong Kong Polytechnic University. The range of refractive errors was from +1.50D to -4.00D and astigmatism was not more than -1.25D; it is known that high myo-pia may affect mfERG findings [40]. Detailed eye examination was conducted before the exper-iment. Intraocular pressure and depth of anterior chamber angles were assessed to ensure suitability for dilated fundus examination and mfERG measurement. Subjects with colour vi-sion deficiency, retinal ocular diseases, abnormal ocular media, history of general diseases that have potential ocular effects, or a history of photosensitive epilepsy were excluded from partici-pation. The tested eye was randomly chosen. Tested eyes had best corrected logMAR visual acuity of 0.00 (Snellen acuity of 6/6) or better. After detailed explanation of the study, written informed consent was obtained from each subject; the study and the consent form was re-viewed and approved by the Human Ethics Committee of The Hong Kong Polytechnic Univer-sity (HSEARS No. 20110905002) and adhered to the tenets of the Declaration of Helsinki. Subject information was anonymized and de-identified prior to analysis.
Experiment 1: Effect of grating stimulus on global flash mfERG at different retinal regions. Twenty three young adults aged from 21 to 27 years (mean = 22.5 ± 1.6 years) participated in the study. The refractive errors (spherical-equivalent) of the subjects ranged from +1.13 to -3.25D (mean = -1.02 ± 1.13D) and astigmatism ranged from 0.00D to -1.25D (mean = -0.44 ± 0.44D). The tested eye of the subjects was fully corrected for the 40 cm viewing distance using 35mm diameter trial lenses. The retinal image size among the subjects was kept essentially constant by placing the corrective lenses at the anterior focal plane of the tested eye.
example if a subject possessed 0.5D residual accommodation, a -2.5D lens was used to impose -2D defocus. All subjects were reminded to report if they could manage to fixate the red-cross fixation before and during recording. Since Wang and colleagues [46] showed the peripheral resolution was limited by neural sampling density, but not by several diopter of defocus, we supposed the gratings could be resolved by retina with +/- 2D of defocus at all regions.
Evaluating the cycloplegic effect and residual accommodation. In Experiment 2, the cycloplegic effect and the residual accommodation were assessed to ensure that they were con-stant throughout the experiment, as in the study of Hoet al. [35] The push-up method was
em-ployed to measure the residual accommodation of the tested eye of all subjects. In the residual accommodation measurement, the subjects’refractive errors were corrected by adding +2D for near. A line of letters at their best acuity was gradually moved from a working distance of 50 cm toward the subject. The end point was reached when the line of letters was reported to blur. The residual accommodation was calculated by subtracting 2D (the near addition power given) from the amplitude of accommodation measured. This procedure was carried out three times 20 min after the instillation of the eye drops, and immediately before and after the mfERG measurements by a masked examiner. The mfERG recordings were continued only if the dif-ference in residual accommodation for three consecutive measurements, each separated by about 1 minute, was not more than 0.25D.
Data Analysis
First order kernel response of direct (DC) and induced (IC) components of mfERG responses were extracted and pooled into six concentric rings for analysis (Fig 3, left panel). For the cen-tral ring (1), the radius angle subtended 1.75°and the most peripheral ring (6), the radius angle subtended 19.20°. The amplitude of the DC was defined as the difference from the first negative trough to the first positive peak while the IC amplitude was defined as the difference from the second positive peak to the second negative trough [35,41,43,47]. The implicit time of the DC was defined as the time to reach the first positive peak and the implicit time of the IC was mea-sured from the presentation of the global flash to the second positive peak (Fig 3, right panel).
Predictive Analytics SoftWare (PASW19.0, SPSS Inc., Chicago, IL, USA) was used for data analysis. Repeated measures analysis of variance (ANOVA) was applied to study the effect of spatial frequencies on mfERG responses (Experiment 1) and the effect of spatial frequencies with optical defocus on mfERG response (Experiment 2) for different retinal regions. Post hoc tests with Bonferroni adjustment were applied to correct the level of significance due to multi-ple comparisons of different retinal regions. The level of significance was set at 0.05.
Results
Experiment 1. Effect of grating stimulus on global flash mfERG at
different retinal regions
The typical waveforms of the global flash mfERG for the four grating patterns are shown in
Fig 4A.
The first and second peaks of the waveforms are the DC and IC respectively.
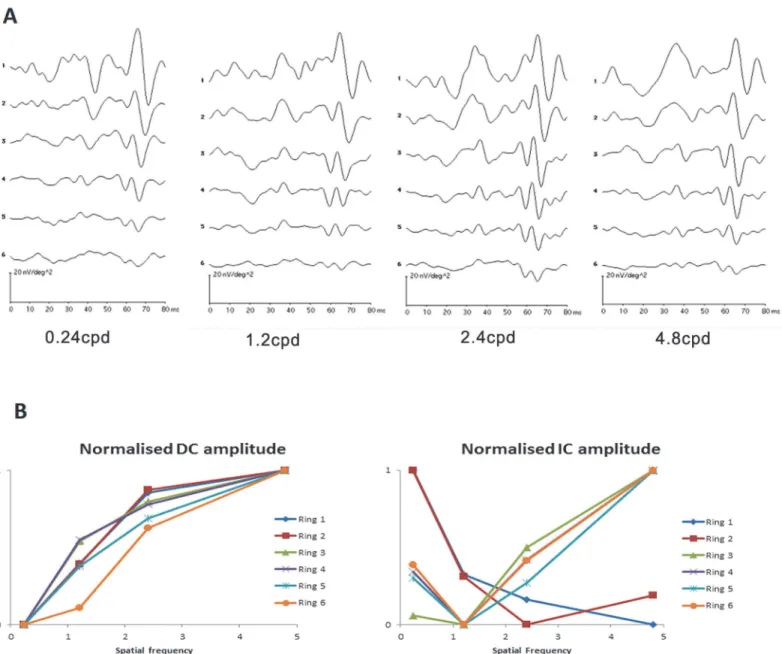
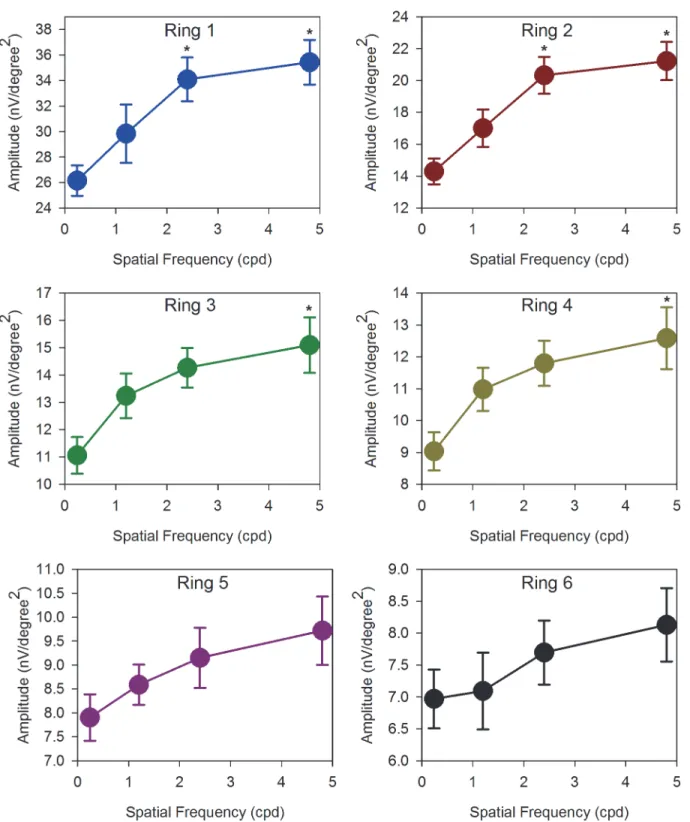
There is low amplitude DC with low SF grating (0.24cpd), the DC amplitude increases with increasing number of gratings, and the DC amplitude decreases with increasing eccentricity at all eccentricities.
response to spatial frequency was illustrated by the summary normalizing DC and IC ampli-tude (Fig 4B). For DC, the responses to spatial frequency in central and peripheral regions were similar. While for IC, the central retinal response to spatial frequency was different from peripheral retinal response.
When measurements are made across the 23 subjects in the group, these initial impressions are confirmed (Figs5and6). The DC amplitudes are significantly different with both SF of gratings (2-way repeated measures ANOVA: (F = 14.36, p<0.001)) and eccentricity
(F = 351.67, p<0.001).Fig 5shows the relationship between DC amplitude and stimulus
spa-tial frequency. For the central and paracentral retina (rings 1 and 2), DC amplitude increases
Fig 4. The global flash mfERG response to spatial frequency.(A) The typical global flash mfERG waveform measured from one subject with 4 spatial frequencies grating for six different retinal regions. (B) Normalized amplitudes of DC and IC response to spatial frequency of all subjects. The normalized amplitudes of DC and IC were achieved by dividing the amplitudes by the maximum value in each ring.
significantly as spatial frequency is increased (Repeated measures ANOVA: ring 1: (F = 10.70, p<0.001); ring 2: (F = 13.66, p<0.001), In addition, the responses to 2.4 and 4.8 cpd stimuli
are comparable. In the peripheral retina (rings 5 and 6), the relationship between DC
Fig 5. DC amplitudes.Absolute amplitudes of DC (mean±SEM) with SF of 0.24cpd to 4.8cpd of ring 1 to 6. The DC responses were generally increased with SF in all regions. Those marked with an asterisk‘‘*”are statistically different from the 0.24cpd.
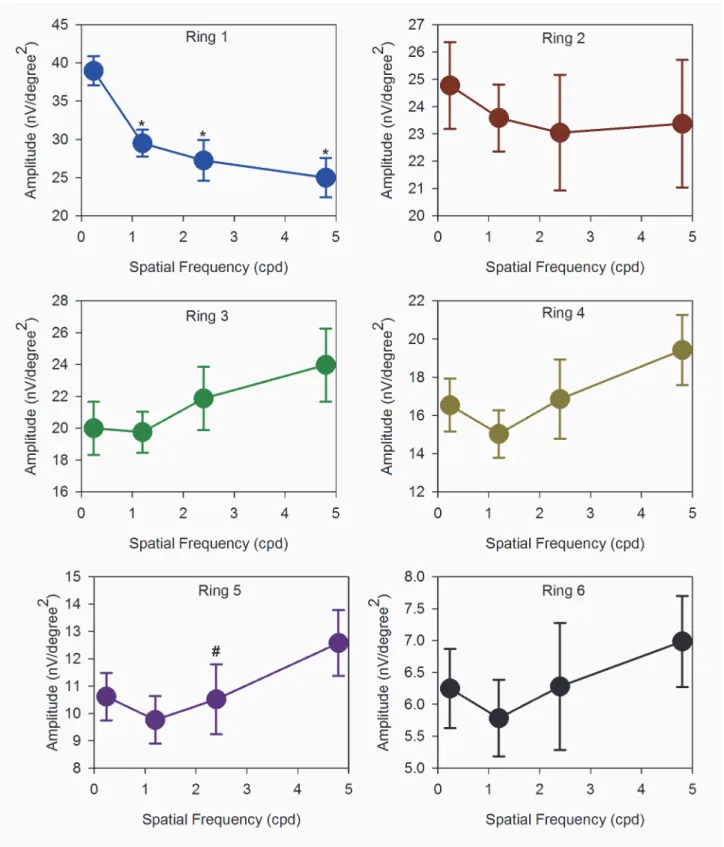
Fig 6. IC amplitudes.Absolute amplitudes of IC (mean±SEM) with SF of 0.24cpd to 4.8cpd of ring 1 to 6. In ring 1 and 2, the IC responses were similar. While from ring 3 to 6, the IC responses behaved differently from the central retina. Those marked with an asterisk‘‘*”are statistically different from the 0.24cpd while with an asterisk“#”are statistically different between 4.8cpd and 2.4cpd.
amplitude and stimulus spatial frequency is essentially linear. Rings 3 and 4 appear to have a characteristic which is‘transitional’between the central and peripheral responses. In contrast, the IC amplitudes show two different characteristics with increasing SF (Fig 6). For the central retina (ring 1), IC amplitude is high with thick grating and decreases with increasing number of gratings. (Repeated measures ANOVA: (F = 16.65, p<0.001)). A similar trend is observed
in the paracentral (ring 2) region. For rings 3–6, amplitudes are low at low SF, and increase as SF increases. There is a significant main effect of eccentricity (2-way repeated measures ANOVA: (F = 105.15, p<0.001)) in these data, while SF alone is not a statistically significant
factor (F = 1.75, p = 0.18). However there is a significant interaction between SF and eccentrici-ty (F = 13.11, p<0.001), indicating significantly different response amplitude profiles at
different eccentricities.
DC implicit time reduced with increasing eccentricity, and repeated measures two-way ANOVA showed a significant main effect of eccentricity (F = 4.01, p = 0.017), but post-hoc analysis revealed few consistent effects between measurement points.
IC implicit time reduced with increasing eccentricity, and increased with increasing SF. Two-way repeated measures ANOVA showed significant main effects for eccentricity (F = 119.56, p<0.001) and SF (F = 6.14, p = 0.001). For all SF, post hoc analysis revealed the
implicit time was significantly increased from ring 1 to ring 4 (all p<0.001). For ring 3, the
im-plicit time for 1.2cpd was significantly longer than that for 0.24cpd (p<0.001). For ring 4, the
implicit times for 1.2cpd were significantly longer than those for 0.24cpd (adjusted p<0.008)
and 2.4cpd (p<0.001).
Experiment 2. Global flash mfERG response to grating under defocus
conditions for different retinal regions
The waveforms of MOFO mfERG DC and IC responses under defocus conditions for 0.24cpd and 4.8cpd are shown inFig 7. At low SF (0.24cpd), defocus with -2D lenses broadens the DC response at all eccentricities, and reduces the amplitude of the response, especially in the retinal periphery. The IC response is diminished at all eccentricities (Fig 7A). Defocus with +2D lenses increases the DC response and decreases the IC response (Fig 7C). At high SF (4.8 cpd), defo-cus with -2D lenses decreases both DC and IC response, while defodefo-cus with +2D lenses appears to have much smaller effects on either DC or IC responses at any eccentricity (Fig 7lower panels).
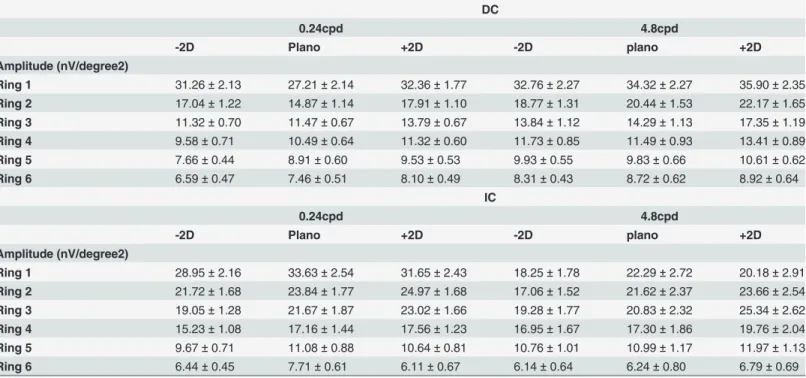
Table 1shows the average DC and IC amplitudes (mean ± SEM) of ring regions when 0.24cpd and 4.8cpd stimuli are presented under different defocus conditions. The amplitude of both DC and IC decreases with increasing retinal eccentricity (from ring 1 to 6).
Changes for defocus with SF interaction are more complex, and are best seen as differences from the‘in focus’condition. The individual percentage changes of DC and IC, with positive or negative optical defocus comparing to plano condition for high and low SF, have been calcu-lated and are shown inFig 8A and 8Brespectively. Although the eyes had mixed responses to defocus, the majority follows the pattern inFig 8.
For DC (Fig 8A), the trend of amplitude change with +2D defocus is significantly different from that for -2D defocus (3-way repeated measures ANOVA: (F = 17.99, p<0.001)), while
Fig 7. The typical global flash mfERG waveform from one subject for high and low spatial frequency under defocus.Upper panel: (A), (B) and (C) are responses from 0.24cpd under defocus 2D, plano and +2D respectively. Lower panel: (D), (E) and (F) are response from 4.8cpd under under defocus of-2D, plano and +2D respectively.
the region and SF interaction by 2-way repeated measure ANOVA revealed a significant region and SF interaction when imposing -2D defocus(F = 4.83, p = 0.005).
Imposing +2/-2D theoretically would produce the same magnitude of blur, and the retinal re-sponse would be the same if the retina responds only to blur and not to the sign of defocus. The result in this study demonstrates that imposing same magnitude of defocus with different sign produces different retinal responses. At low SF (0.24cpd), +2D defocus produces 20–30% in-crease in response at all eccentricities (Fig 8A, left panel). In contrast to this, -2D defocus gives increased amplitudes only centrally, but gives reduced amplitudes from the mid-periphery to the far periphery. Under 0.24cpd (Fig 8Aleft panel), both +/-2D can trigger significant increase in DC amplitudes at ring 1 and 2 compared to the plano condition (one sample T test, +2D: p = 0.01; -2D: p = 0.03) but the sign of defocus is not differentiable. From ring 3 to 6, +/-2D trig-ger increase/decrease according to sign of defocus. This characteristic is reduced at higher SF (4.8cpd). At 4.8cpd, the +2D defocus produces an increased DC amplitude in the near and mid-periphery, while the -2D defocus has essentially no effect on amplitude of response (Fig 8B, right panel).
The IC response appears to be more variable, but the +2D defocus at low SF shows increased response over the majority of the retina (excluding the far periphery), with strongest response in the mid-periphery. The -2D defocus shows a consistent decrease in amplitude of response across the peripheral retina (Fig 8B, left panel). Three-way repeated measures ANOVA of IC percentage change showed significant main effects of defocus (F = 7.60, p = 0.01), while region (F = 0.51, p = 0.65) and SF (F = 2.80, p = 0.11) did not show a main effect. There was a signifi-cant interaction between region and SF (F = 4.07, p = 0.01). There was no signifisignifi-cant 3-way in-teraction (Region x SF x Defocus: F = 1.45, p = 0.24). At higher SF, the +2D defocus produced a consistent increase in IC amplitude across the peripheral retina, and smaller increases were seen with -2D defocus from ring 3 and beyond (Fig 8B, right panel).
Table 1. Summary of amplitude (mean±SEM) of DC and IC under different defocus conditions with 0.24cpd or 4.8cpd from ring 1 to 6. DC
0.24cpd 4.8cpd
-2D Plano +2D -2D plano +2D
Amplitude (nV/degree2)
Ring 1 31.26±2.13 27.21±2.14 32.36±1.77 32.76±2.27 34.32±2.27 35.90±2.35
Ring 2 17.04±1.22 14.87±1.14 17.91±1.10 18.77±1.31 20.44±1.53 22.17±1.65
Ring 3 11.32±0.70 11.47±0.67 13.79±0.67 13.84±1.12 14.29±1.13 17.35±1.19
Ring 4 9.58±0.71 10.49±0.64 11.32±0.60 11.73±0.85 11.49±0.93 13.41±0.89
Ring 5 7.66±0.44 8.91±0.60 9.53±0.53 9.93±0.55 9.83±0.66 10.61±0.62
Ring 6 6.59±0.47 7.46±0.51 8.10±0.49 8.31±0.43 8.72±0.62 8.92±0.64
IC
0.24cpd 4.8cpd
-2D Plano +2D -2D plano +2D
Amplitude (nV/degree2)
Ring 1 28.95±2.16 33.63±2.54 31.65±2.43 18.25±1.78 22.29±2.72 20.18±2.91
Ring 2 21.72±1.68 23.84±1.77 24.97±1.68 17.06±1.52 21.62±2.37 23.66±2.54
Ring 3 19.05±1.28 21.67±1.87 23.02±1.66 19.28±1.77 20.83±2.32 25.34±2.62
Ring 4 15.23±1.08 17.16±1.44 17.56±1.23 16.95±1.67 17.30±1.86 19.76±2.04
Ring 5 9.67±0.71 11.08±0.88 10.64±0.81 10.76±1.01 10.99±1.17 11.97±1.13
Ring 6 6.44±0.45 7.71±0.61 6.11±0.67 6.14±0.64 6.24±0.80 6.79±0.69
For the DC implicit time, both SF and region had significant main effects (SF: F = 5.55, p = 0.003; Region: F = 6.29, p = 0.003) and there was no significant 3-way interaction (Region x SF x Defocus: F = 1.56, p = 0.19). For IC implicit time, both defocus and region had significant
Fig 8. Percentage change of DC and IC with imposing defocus under 0.24cpd or 4.8cpd.(A) Percentage change of DC amplitudes (mean±SEM) with imposing defocus under 0.24cpd or 4.8cpd across the region. (B) Percentage change of IC amplitudes (mean±SEM) with imposing defocus under 0.24cpd or 4.8cpd across the region. Left panel is 0.24cpd and right panel is 4.8cd. Those marked with an asterisk‘‘*”are statistically different between +2D and -2D defocus.
main effects (Defocus: F = 4.66, p = 0.03; Region: F = 72.28,<0.0001) but there was no
signifi-cant 3-way interaction (F = 0.74, p = 0.48).
Discussion
Spatial frequency effect across the retina
In experiment 1, our findings demonstrated that the components of global flash mfERG re-sponded differently from low to high spatial frequency. In addition, the response amplitude of DC and IC were not linear with width of the gratings. The DC amplitude increased rapidly from 0.24cpd to 2.4cpd and then slowed from 2.4cpd to 4.8cpd across the retinal eccentricity (Fig 5). However, the trend of IC amplitude was different. The IC amplitude was the highest at 0.24cpd and decreased with increasing SF at central (i.e. ring 1 and 2) (Fig 6). At the mid pe-ripheral retina (from ring 3 to 6), the trends were opposite and the IC amplitude increased with SF. In the global flash mfERG, the DC response is the average response to a focal flash generat-ed by m-sequences of the multifocal stimulus [41,43,47]. The amplitude mainly represents the activity from outer retinal composed of contributions from photoreceptors, and ON- and OFF-bipolar cells [39,41,43,47,48]. The global flash after the focal flash in the m-sequence stimulation produces the IC response, which represents the retinal adaptive response, and re-flects activity from inner retina including amacrine cells and retinal ganglion cells [43,44,47,
49]. In this study, the luminance of the focal flash and the global flash was approximately con-stant while varying the SF and the ratio of global flash to focal flash was not changed. And the mean luminance of the stimuli at the different spatial frequencies was similar, the changes in DC and IC with SFs are not due to the difference of luminance of different SFs. The grating acuity is closely correlated to the receptive field size of RGC which is increased with eccentrici-ty. However, the trends of DC and IC amplitude response to spatial frequency are not totally followed the variation of the RGC field size. Hence, the changes of mfERG responses may be only explained by the receptive field size partly. The different trends of DC and IC with increas-ing SF indicate that outer and inner retina may decode and process SF in different ways. The mfERG response pattern for central (rings 1 and 2) are very different to peripheral regions. We believe that the variations of the waveform with eccentricity may reflect different adaptive mechanisms across the retina. This regional change in responsiveness may be caused by varia-tion in the rod/cone mix with eccentricity, change in the ways in which receptors and receptive fields are connected [41,50].
Previous studies have used various ERG techniques to investigate the SF effect on retinal re-sponse [51–54]. Yamada and colleagues [54] applied focal macular ERG and found that the os-cillatory potentials, which reflect the inner retina activity, decreased with increasing SF, and our findings are consistent with theirs. It has long been suggested that the retina has different channels which are selectively sensitive (tuned) to particular ranges of SF [55–58]. Our mfERG findings may support the idea of both outer [59–61] and inner [62–64] retina possessing spatial sensitivity to SF. In addition, our findings suggested outer and inner retina respond differently to SF in the central region, while this characteristic is reduced in peripheral regions.
Since refractive errors may affect the mfERG response, we recruited 12 age-matched sub-jects with spherical equivalent of -6.54±1.63D, going through the same procedure with experi-ment 1. The general trend of DC and IC amplitudes against spatial frequency for the high myope group were similar to those from low myope group (S1 Fig).
Regional sensitivity to defocus
with positive or negative defocus. In peripheral regions (ring 3 to 6), the DC responses were different with positive or negative defocus, suggesting that the peripheral region may be the site for the decoding of optical defocus. A similar hypothesis has been suggested in animal studies, that the retina may be able to decode defocus and the eye grows according to the sign of defo-cus [65,66]. Subsequent studies have shown that peripheral defocus can influence overall re-fractive error development in chicks [67] or in monkeys [4,68], highlighting the dominant role of peripheral retina in the regulation of ocular growth. In addition, myopic progression has been slowed by wearing orthokeratology lenses in clinical studies, and it has been speculated that the presence of myopic defocus on the peripheral retina may be the critical factor in slow-ing myopia development [69,70]. In this study, IC percentage change in differentiating optical defocus in the peripheral retina can also be noticed in the 0.24cpd condition, but is not ob-served in the 4.8 cpd condition. This shows that sign-dependent responses to defocus are main-ly from peripheral regions instead of central retina. Hoet al. [35] used MOFO mfERG in
human eyes and showed that DC and IC demonstrated different trends of changes with various levels of defocus from -4D to +4D. The peripheral retinal response to defocus was more vigor-ous than that in the central retina, a finding in agreement with the present study. Furthermore, the subjects in this cohort and those in the study of Hoet al. [35] are mainly low stable myopes;
the sign-dependent retinal characteristic is still present when myopia is stable. It has previously been noted that inner retinal function is different between stable myopes and progressing my-opes [71]. It would be of interest to determine whether progressing myopes have similar re-gional retinal response characteristics to defocus and SF as those we have reported here.
In our findings, the +2D defocus stimulus generally triggered higher mfERG response than -2D defocus, suggesting that the retina responds more vigorously to myopic defocus. Previous animal studies have demonstrated that eye growth is more responsive to myopic defocus than to hyperopic defocus [72–74]. In addition, Zhonget al. [26] have shown that different
condi-tions of optical focus can affect the activity of ON-bipolar as well as GABAergic amacrine cells in primate retina. They used immunocytochemical markers to illustrate cellular activity which increased when images were in focus or had positive defocus; the response decreased for im-ages with negative defocus. These findings match our findings, that the mfERG responses, in both DC and IC amplitudes, are higher with +2D defocus than with -2D defocus over the re-gions under stimulation.
Spatial frequencies and Defocus
Spatial frequency is a significant factor in our findings, even with the same amount of defocus in the same region. Our findings showed sign dependent characteristic was observed in the pe-ripheral regions for both SF, and the DC reacted more vigorously under 0.24cpd (low SF) at ring 1 and 2 than those under 4.8cpd (high SF). Note that the low and high SF in this study is relative to each other, rather than resolution threshold of the retina. The vertical grating resolu-tion limit of retina is about 5cpd at 20°[75,76]. All of our subjects were able to detect the grat-ings when presented under focus and defocus conditions both centrally and in the
peripheral retina.
beyond 20°of the visual field, but we assume the retina is experiencing roughly the same amount of defocus from ring 1 (0°) to ring 6 (19.2°) in our study.
The sign-dependent retinal activity was observed for the 0.24cpd stimulus in the peripheral regions but was not as obvious for the 4.8cpd stimulus. If the retina possesses a mechanism to differentiate the sign of defocus, there must be some clues for the retina to extract the sign of defocus. Our results suggest that the retina is more effective in extracting defocus under low SF than under high SF in peripheral regions rather than in the central region. Anatomically, the receptive field size increases with eccentricity, and the peripheral retina cannot resolve spatial details with very high SF. It is reasonable that the defocus decoding mechanism can respond to spatial stimuli with low SF rather than high SF. However, from our findings, we cannot be sure how the various defocus levels interact with the spatial details. That is, the defocus decoding mechanism may have preference for different SF under different optical defocus conditions. In terms of IC response to defocus, the trend was not as obvious as that of DC for the two SFs. A general trend of increased amplitude with +2D defocus and reduced amplitude with -2D defo-cus was observed for the 0.24cpd condition for rings 2 to 5.
Imposing defocus reduces the contrast of the retinal image and reduction in image contrast may potentially decrease the amplitude of the mfERG response. Previous study has shown im-posing myopic defocus could reduce contrast sensitivity, especially at high SF [78]. In addition, the mfERG amplitude is decreased with a decrease of stimulus contrast without imposed opti-cal defocus [41,79]. Brown and Yap [79] showed that reductions of amplitudes are linear with little deviation in both foveal and peripheral regions. Yet our results showed some regions have increase in amplitudes after imposition of defocus. Both DC and IC amplitudes of MOFO mfERG were shown to be decreased with reducing contrast in previous studies [41,47,48]. Therefore, contrast reduction of the image after imposing defocus cannot fully account for the trend of mfERG amplitude response in low and high SF with +2/-2D defocus which should produce the same contrast reduction in terms of optical properties. Furthermore, the DC and IC amplitude responses of low SF across the retinal regions are comparable with the findings of
Ho et al. [35]. Our data confirms their low SF data (regarding each hexagon as stimulus with
very low SF) and extends their findings to high SF data, which in this study behaves differently to low SF stimuli.
Does retinal image at different spatial frequency and retinal defocus
affect myopia?
Conclusion
In this study, mfERG measures showed that outer and inner retina have different characteris-tics in processing spatial details. The peripheral retina can differentiate positive and negative defocus more effectively for low spatial frequencies than can the central retina. The human reti-na seems to have a decoding system for optical defocus, which is tuned for low spatial frequen-cy, and is located in the retinal near periphery.
Supporting Information
S1 Fig. Global flash mfERG response for spatial frequency in high myope subjects.DC am-plitude and IC amam-plitude of 12 age-matched subjects with spherical equivalent of -6.54±1.63D, was shown. The general trend of DC and IC amplitudes against spatial frequency for the high myope group were similar to those from low myope group.
(TIF)
S1 Dataset. Raw data for experiment 1 and 2.
(XLSX)
Acknowledgments
The authors thank Prof. Brian Brown for his assistance in the preparation of manuscript.
Author Contributions
Conceived and designed the experiments: MC HC. Performed the experiments: MC. Analyzed the data: MC PC HC. Contributed reagents/materials/analysis tools: AC HC. Wrote the paper: MC HC.
References
1. Pan CW, Ramamurthy D, Saw SM. Worldwide prevalence and risk factors for myopia. Ophthalmic Phy-siol Opt. 2012 Jan; 32(1):3–16. doi:10.1111/j.1475-1313.2011.00884.xPMID:22150586
2. Grosvenor T. Why is there an epidemic of myopia? Clinical and Experimental Optometry. 2003; 86 (5):273–5. PMID:14558848
3. Saw S, Gazzard G, Shih‐Yen EC, Chua W. Myopia and associated pathological complications. Oph-thalmic and Physiological Optics. 2005; 25(5):381–91. PMID:16101943
4. Smith EL, Hung L, Huang J, Blasdel TL, Humbird TL, Bockhorst KH. Effects of optical defocus on re-fractive development in monkeys: Evidence for local, regionally selective mechanisms. Invest Ophthal-mol Vis Sci. 2010; 51(8):3864–73. doi:10.1167/iovs.09-4969PMID:20220051
5. Diether S, Schaeffel F. Local changes in eye growth induced by imposed local refractive error despite active accommodation. Vision Res. 1997; 37(6):659–68. PMID:9156210
6. Wallman J, Gottlieb MD, Rajaram V, Fugate-Wentzek LA. Local retinal regions control local eye growth and myopia. Science. 1987 Jul 3; 237(4810):73–7. PMID:3603011
7. Hodos W, Kuenzel WJ. Retinal-image degradation produces ocular enlargement in chicks. Invest Ophthalmol Vis Sci. 1984 Jun; 25(6):652–9. PMID:6724835
8. Walker L, ZuRhein G, Hodach A, Chou S. Extreme myopia produced by modest change in early visual experience. Science. 1978; 201:29. PMID:17777738
9. Shen W, Vijayan M, Sivak JG. Inducing form-deprivation myopia in fish. Invest Ophthalmol Vis Sci. 2005 May; 46(5):1797–803. PMID:15851585
10. Howlett MH, McFadden SA. Form-deprivation myopia in the guinea pig (<i>cavia porcellus). Vision
Res. 2006; 46(1):267–83.
11. Schaeffel F, Burkhardt E, Howland HC, Williams RW. Measurement of refractive state and deprivation myopia in two strains of mice. Optometry & Vision Science. 2004; 81(2):99–110.
12. Troilo D, Judge SJ. Ocular development and visual deprivation myopia in the common marmoset (<i>
13. SMITH EL III, Bradley DV, Fernandes A, Boothe RG. Form deprivation myopia in adolescent monkeys. Optometry & Vision Science. 1999; 76(6):428–32. PMID:10416938
14. Shaikh AW, Siegwart JT Jr, Norton TT. Effect of interrupted lens wear on compensation for a minus lens in tree shrews. Optometry & Vision Science. 1999; 76(5):308–15. PMID:10375247
15. Norton TT, Essinger JA, McBRIEN NA. Lid-suture myopia in tree shrews with retinal ganglion cell block-ade. Vis Neurosci. 1994; 11(1):143–53. PMID:8011577
16. von Noorden GK, Lewis RA. Ocular axial length in unilateral congenital cataracts and blepharoptosis. Invest Ophthalmol Vis Sci. 1987; 28(4):750–2. PMID:3557880
17. Zhang Z, Li S. The visual deprivation and increase in axial length in patients with cataracts. Yan Ke Xue Bao. 1996 Sep; 12(3):135–7. PMID:9639838
18. Tran N, Chiu S, Tian Y, Wildsoet CF. The significance of retinal image contrast and spatial frequency composition for eye growth modulation in young chicks. Vision Res. 2008 Jul; 48(15):1655–62. doi:10. 1016/j.visres.2008.03.022PMID:18533221
19. Hess RF, Schmid KL, Dumoulin SO, Field DJ, Brinkworth DR. What image properties regulate eye growth? Curr Biol. 2006 Apr 4; 16(7):687–91. PMID:16581514
20. Zhi Z, Pan M, Xie R, Xiong S, Zhou X, Qu J. The effect of temporal and spatial stimuli on the refractive status of guinea pigs following natural emmetropization. Invest Ophthalmol Vis Sci. 2013 Jan 30; 54 (1):890–7. doi:10.1167/iovs.11-8064PMID:23307951
21. Schmid KL, Wildsoet CF. Contrast and spatial-frequency requirements for emmetropization in chicks. Vision Res. 1997 Aug; 37(15):2011–21. PMID:9327048
22. Diether S, Wildsoet CF. Stimulus requirements for the decoding of myopic and hyperopic defocus under single and competing defocus conditions in the chicken. Invest Ophthalmol Vis Sci. 2005 Jul; 46 (7):2242–52. PMID:15980207
23. Wallman J, Winawer J. Homeostasis of eye growth and the question of myopia. Neuron. 2004; 43 (4):447–68. PMID:15312645
24. Smith EL III, Hung L. The role of optical defocus in regulating refractive development in infant monkeys. Vision Res. 1999; 39(8):1415–35. PMID:10343811
25. SMITH EL III. Spectacle lenses and emmetropization: The role of optical defocus in regulating ocular development. Optometry & Vision Science. 1998; 75(6):388–98.
26. Zhong X, Ge J, Smith EL, Stell WK. Image defocus modulates activity of bipolar and amacrine cells in macaque retina. Invest Ophthalmol Vis Sci. 2004; 45(7):2065–74. PMID:15223778
27. Fischer AJ, McGuire JJ, Schaeffel F, Stell WK. Light-and focus-dependent expression of the transcrip-tion factor ZENK in the chick retina. Nat Neurosci. 1999; 2(8):706–12. PMID:10412059
28. Guo S, Sivak J, Callender M, Diehl-Jones B. Retinal dopamine and lens-induced refractive errors in chicks. Curr Eye Res. 1995; 14(5):385–9. PMID:7648864
29. Feldkaemper M, Schaeffel F. An updated view on the role of dopamine in myopia. Exp Eye Res. 2013 Sep; 114:106–19. doi:10.1016/j.exer.2013.02.007PMID:23434455
30. MERTZ JR, WALLMAN J. Choroidal retinoic acid synthesis: A possible mediator between refractive error and compensatory eye growth. Exp Eye Res. 2000; 70(4):519–27. PMID:10866000
31. McFadden SA, Howlett MH, Mertz JR. Retinoic acid signals the direction of ocular elongation in the guinea pig eye. Vision Res. 2004; 44(7):643–53. PMID:14751549
32. Buck C, Schaeffel F, Simon P, Feldkaemper M. Effects of positive and negative lens treatment on reti-nal and choroidal glucagon and glucagon receptor mRNA levels in the chicken. Invest Ophthalmol Vis Sci. 2004 Feb; 45(2):402–9. PMID:14744878
33. Feldkaemper MP, Schaeffel F. Evidence for a potential role of glucagon during eye growth regulation in chicks. Vis Neurosci. 2002; 19(06):755–66.
34. Sutter EE, Tran D. The field topography of ERG components in man—I. the photopic luminance re-sponse. Vision Res. 1992; 32(3):433–46. PMID:1604830
35. Ho WC, Wong OY, Chan YC, Wong SW, Kee CS, Chan HH. Sign-dependent changes in retinal electri-cal activity with positive and negative defocus in the human eye. Vision Res. 2012 Jan 1; 52(1):47–53. doi:10.1016/j.visres.2011.10.017PMID:22100834
36. Read SA, Collins MJ, Sander BP. Human optical axial length and defocus. Invest Ophthalmol Vis Sci. 2010 Dec; 51(12):6262–9. doi:10.1167/iovs.10-5457PMID:20592235
38. Anderson SJ, Mullen KT, Hess RF. Human peripheral spatial resolution for achromatic and chromatic stimuli: Limits imposed by optical and retinal factors. J Physiol. 1991 Oct; 442:47–64. PMID:1798037
39. Shimada Y, Li Y, Bearse MA Jr, Sutter EE, Fung W. Assessment of early retinal changes in diabetes using a new multifocal ERG protocol. Br J Ophthalmol. 2001 Apr; 85(4):414–9. PMID:11264129
40. Ho WC, Ng YF, Chu PH, Fong YY, Yip KS, Kee CS, Chan HH. Impairment of retinal adaptive circuitry in the myopic eye. Vision Res. 2011 Feb 9; 51(3):367–75. doi:10.1016/j.visres.2010.12.001PMID: 21146555
41. Chu PH, Chan HH, Brown B. Glaucoma detection is facilitated by luminance modulation of the global flash multifocal electroretinogram. Invest Ophthalmol Vis Sci. 2006 Mar; 47(3):929–37. PMID: 16505026
42. Chen JC, Brown B, Schmid KL. Retinal adaptation responses revealed by global flash multifocal elec-troretinogram are dependent on the degree of myopic refractive error. Vision Res. 2006 Oct; 46 (20):3413–21. PMID:16647734
43. Shimada Y, Bearse MA,Jr, Sutter EE. Multifocal electroretinograms combined with periodic flashes: Di-rect responses and induced components. Graefes Arch Clin Exp Ophthalmol. 2005 Feb; 243(2):132–
41. PMID:15742211
44. Sutter EE, Shimada Y, Bearse MA. Mapping inner retinal function through enhancement of adaptive components in the M-ERG. In: Vision science and its applications, OSA Technical Digest Series, Vol. 1. Washington, DC: Optical Society of America; 1999:52–55.
45. Lung JC, Chan HH. Effects of luminance combinations on the characteristics of the global flash multifo-cal electroretinogram (mfERG). Graefe's Archive for Clinimultifo-cal and Experimental Ophthalmology. 2010; 248(8):1117–25. doi:10.1007/s00417-010-1346-5PMID:20306071
46. Wang YZ, Thibos LN, Bradley A. Effects of refractive error on detection acuity and resolution acuity in peripheral vision. Invest Ophthalmol Vis Sci. 1997 Sep; 38(10):2134–43. PMID:9331277
47. Chu PH, Chan HH, Ng YF, Brown B, Siu AW, Beale BA, Gilger BC, Wong F. Porcine global flash multi-focal electroretinogram: Possible mechanisms for the glaucomatous changes in contrast response function. Vision Res. 2008 Jul; 48(16):1726–34. doi:10.1016/j.visres.2008.05.006PMID:18573515
48. Chu PH, Chan HH, Brown B. Luminance-modulated adaptation of global flash mfERG: Fellow eye losses in asymmetric glaucoma. Invest Ophthalmol Vis Sci. 2007 Jun; 48(6):2626–33. PMID: 17525193
49. Fortune B, Bearse MA,Jr, Cioffi GA, Johnson CA. Selective loss of an oscillatory component from tem-poral retinal multifocal ERG responses in glaucoma. Invest Ophthalmol Vis Sci. 2002 Aug; 43(8):2638–
47. PMID:12147597
50. Chu PH, Ng Y, Chan HH. Forward and backward adaptive effects in global flash multifocal electroreti-nogram stimulation. Clinical and Experimental Optometry. 2011; 94(3):259–67. doi: 10.1111/j.1444-0938.2011.00583.xPMID:21535137
51. Arden G. Effect of pattern luminance profile on the pattern ERG in man and pigeon. Vision Res. 1987; 27(6):883–92. PMID:3660650
52. Berninger T, Schuurmans RP. Spatial tuning of the pattern ERG across temporal frequency. Doc Ophthalmol. 1985 Oct 30; 61(1):17–25. PMID:4064886
53. Falsini B, Porciatti V, Bolzani R, Marchionni A. Spatial-frequency-dependent changes in the human pat-tern electroretinogram after acute acetyl-L-carnitine administration. Graefe's archive for clinical and ex-perimental ophthalmology. 1991; 229(3):262–6. PMID:1869064
54. Yamada K, Matsumoto CS, Nakatsuka K. Effect of spatial frequency of stimulus on focal macular ERGs in monkeys. Documenta ophthalmologica. 2006; 113(2):83–91. PMID:17028912
55. Enroth-Cugell C, Robson JG. The contrast sensitivity of retinal ganglion cells of the cat. J Physiol (Lond). 1966; 187(3):517–52. PMID:16783910
56. Campbell FW, Robson J. Application of fourier analysis to the visibility of gratings. J Physiol (Lond). 1968; 197(3):551. PMID:5666169
57. Shapley R, Lennie P. Spatial frequency analysis in the visual system. Annu Rev Neurosci. 1985; 8 (1):547–81.
58. Sachs MB, Nachmias J, Robson JG. Spatial-frequency channels in human vision. JOSA. 1971; 61 (9):1176–86. PMID:5121888
59. Werblin FS, Dowling JE. Organization of the retina of the mudpuppy, necturus maculsus II: Intracellular recording. J Neurophysiol. 1969; 32:339. PMID:4306897
61. Thibos LN, Werblin FS. The response properties of the steady antagonistic surround in the mudpuppy retina. J Physiol. 1978 May; 278:79–99. PMID:671342
62. Cook PB, McReynolds JS. Lateral inhibition in the inner retina is important for spatial tuning of ganglion cells. Nat Neurosci. 1998; 1(8):714–9. PMID:10196588
63. Flores-Herr N, Protti DA, Wassle H. Synaptic currents generating the inhibitory surround of ganglion cells in the mammalian retina. J Neurosci. 2001 Jul 1; 21(13):4852–63. PMID:11425912
64. Sinclair JR, Jacobs AL, Nirenberg S. Selective ablation of a class of amacrine cells alters spatial pro-cessing in the retina. J Neurosci. 2004 Feb 11; 24(6):1459–67. PMID:14960619
65. Park TW, Winawer J, Wallman J. Further evidence that chick eyes use the sign of blur in spectacle lens compensation. Vision Res. 2003 Jun; 43(14):1519–31. PMID:12782066
66. Schaeffel F, Diether S. The growing eye: An autofocus system that works on very poor images. Vision Res. 1999 May; 39(9):1585–9. PMID:10343852
67. Liu Y, Wildsoet C. The effective add inherent in 2-zone negative lenses inhibits eye growth in myopic young chicks. Invest Ophthalmol Vis Sci. 2012 Jul 31; 53(8):5085–93. doi:10.1167/iovs.12-9628 PMID:22761258
68. Smith EL III, Hung L, Huang J. Relative peripheral hyperopic defocus alters central refractive develop-ment in infant monkeys. Vision Res. 2009; 49(19):2386–92. doi:10.1016/j.visres.2009.07.011PMID: 19632261
69. Cho P, Cheung S. Retardation of myopia in orthokeratology (ROMIO) study: A 2-year randomized clini-cal trial. Invest Ophthalmol Vis Sci. 2012; 53(11):7077–85. doi:10.1167/iovs.12-10565PMID: 22969068
70. Mok AK, Chung CS. Seven-year retrospective analysis of the myopic control effect of orthokeratology in children: A pilot study. Clinical Optometry. 2011; 3:1–4.
71. Chen JC, Brown B, Schmid KL. Evaluation of inner retinal function in myopia using oscillatory potentials of the multifocal electroretinogram. Vision Res. 2006; 46(24):4096–103. PMID:17010409
72. Winawer J, Zhu X, Choi J, Wallman J. Ocular compensation for alternating myopic and hyperopic defo-cus. Vision Res. 2005; 45(13):1667–77. PMID:15792842
73. Zhu X, Winawer JA, Wallman J. Potency of myopic defocus in spectacle lens compensation. Invest Ophthalmol Vis Sci. 2003 Jul; 44(7):2818–27. PMID:12824218
74. Winawer J, Wallman J. Temporal constraints on lens compensation in chicks. Vision Res. 2002; 42 (24):2651–68. PMID:12445851
75. Atchison DA, Pritchard N, Schmid KL. Peripheral refraction along the horizontal and vertical visual fields in myopia. Vision Res. 2006; 46(8):1450–8. PMID:16356528
76. Rovamo J, Virsu V, Laurinen P, Hyvärinen L. Resolution of gratings oriented along and across meridi-ans in peripheral vision. Invest Ophthalmol Vis Sci. 1982; 23(5):666–70. PMID:7129811
77. Chen X, Sankaridurg P, Donovan L, Lin Z, Li L, Martinez A, Holden B, Ge J. Characteristics of peripher-al refractive errors of myopic and non-myopic chinese eyes. Vision Res. 2010; 50(1):31–5. doi:10. 1016/j.visres.2009.10.004PMID:19825388
78. Green D, Campbell F. Effect of focus on the visual response to a sinusoidally modulated spatial stimu-lus. JOSA. 1965; 55(9):1154–7.
79. Brown B, Yap MK. Contrast and luminance as parameters defining the output of the VERIS topographi-cal ERG. Ophthalmic and Physiologitopographi-cal Optics. 1996; 16(1):42–8. PMID:8729565