Data Article
Evening and morning alterations in Obstructive
Sleep Apnea red blood cell proteome
Amélia Feliciano
a,b,1, Fátima Vaz
b,c,1,
Cristina Valentim-Coelho
b, Vukosava M. Torres
b,c, Rita Silva
b,
Vesna Prosinecki
b, Bruno M. Alexandre
b, Andreia Almeida
b,
Catarina Almeida-Marques
b, Ana S. Carvalho
d,
Rune Matthiesen
d, Atul Malhotra
e, Paula Pinto
a,f,
Cristina Bárbara
a,f, Deborah Penque
b,c,naServiço de Pneumologia, Centro Hospitalar Lisboa Norte (CHLN), Lisboa, Portugal
bLaboratório de Proteómica, Departamento de Genética Humana, Instituto Nacional de Saúde Dr Ricardo Jorge,
Lisboa 1640-016, Portugal
cToxOmics- Centre of Toxicogenomics and Human Health, Universidade Nova de Lisboa, Portugal dDepartamento da Promoção da Saúde, Instituto Nacional de Saúde Dr Ricardo Jorge, Lisboa 1640-016,
Portugal
ePulmonary, Critical Care and Sleep Medicine Division, University of California San Diego, CA, USA fInstituto de Saúde Ambiental (ISAMB), Faculdade de Medicina, Universidade de Lisboa, Portugal
a r t i c l e
i n f o
Article history:
Received 15 November 2016 Received in revised form 3 January 2017 Accepted 5 January 2017 Available online 16 January 2017
Keywords:
Obstructive Sleep Apnea Red blood cells 2D-DIGE Biomarkers
a b s t r a c t
This article presents proteomics data referenced in [1] Using proteomics-based evaluation of red blood cells (RBCs), we have identified differentially abundant proteins associated with Obstructive Sleep Apnea Syndrome (OSA). RBCs were collected from peripheral blood of patients with moderate/severe OSA or snoring at pre- (evening) and post-night (morning) polysomnography, so that proteome variations between these time points could be assessed. RBC cytoplasmic fraction depleted of hemoglobin, using Hemovoid™ system, were analyzed by two-dimensional fl uores-cence difference gel electrophoresis (2D-DIGE), the 2D image software-based analyzed and relevant differentially abundant pro-teins identified by mass spectrometry (MS). MS identified 31 protein spots differentially abundant corresponding to 21 unique proteins Contents lists available atScienceDirect
journal homepage:www.elsevier.com/locate/dib
Data in Brief
http://dx.doi.org/10.1016/j.dib.2017.01.005
2352-3409/&2017 The Authors. Published by Elsevier Inc. This is an open access article under the CC BY license (http://creativecommons.org/licenses/by/4.0/).
DOI of original article:http://dx.doi.org/10.1016/j.bbadis.2016.11.019 n
Corresponding author at: Laboratório de Proteómica, Departamento de Genética Humana, Instituto Nacional de Saúde Dr Ricardo Jorge, Lisboa 1640-016, Portugal.
E-mail address:[email protected](D. Penque).
possibly due to the existence of post-translational modification regulations. Functional analysis by bioinformatics tools indicated that most proteins are associated with catalytic, oxidoreductase, peroxidase, hydrolase, ATPase and anti-oxidant activity. At morning a larger numbers of differential proteins including response to chemical stimulus, oxidation reduction, regulation of catalytic activity and response to stress were observed in OSA. The data might support further research in OSA biomarker discovery and validation.
&2017 The Authors. Published by Elsevier Inc. This is an open access article under the CC BY license (http://creativecommons.org/licenses/by/4.0/).
Specifications Table
Subject area Biology More specific
sub-ject area
Molecular Medicine; Clinical Proteomics
Type of data Figures, graphics and tables How data was
acquired
Two-dimensionalfluorescence difference gel electrophoresis (2D DIGE) -based proteomics followed by image analysis with Progenesis SameSpots, version 4.5 software (Nonlinear Dynamics, UK). Protein identification by mass spectrometry (MALDI/TOF/TOF). Pathway analysis by open source DAVID software[2].
Data format Filtered, analysed Experimental
factors
RBC samples were hemoglobin (Hb) depleted, using Hemovoid™system, before analysis.
Experimental features
Samples from OSA and Snorers (controls) patients biobank collected at evening and morning time (i.e, before and after night polysomnographic diagnosis) were enrolled.
Data source location
Lisbon, Portugal,
Data accessibility Data is with this article
Value of the data
For thefirst time (evening/morning) changes in OSA RBC proteome are shown probably induced by nocturnal intermittent hypoxia and sleep disruption experienced by these patients. The provided data set may help to get new insights into RBC homeostasis which dysregulation can be a source of oxidative-stress and/or inflammation causally linking OSA to cancer and cardiome-tabolic disorders. These data could be used in further verification/validation assays to selected candidates biomarker of OSA severity and/or treatment response.1. Data
between patients’groups and conditions were shown. Material and methods are provided in detail as much as possible to be reproduced elsewhere.
2. Experimental design, materials and methods
2.1. Sample collection and biochemical analysis
Patients with suspected OSA are hospitalized for an overnight polysomnography (PSG) study. For the proteomics study [1], blood samples were collected into EDTA-coated polypropylene tubes before and after PSG, i.e., between 8:00 pm and 09:30 pm (referred as ‘evening’) and between 7:30 am and 09:00 am (referred as‘morning’). Samples were kept no longer than 4 h at 4°C until fractionation by centrifugation. The obtained RBC pellets were aliquoted and stored at 80°C until analysis.
2.2. RBC sample preparation
RBC pellet samples were lysated by incubation with (1:20) 5 mM phosphate buffer pH 7,4 con-taining 1:100 cocktail of protease inhibitors (P8340, Sigma Aldrich) for 30 min at 4°C followed sonication 10 s/40 amplitude/pulse mode (Ultrasonic Processor, VibraCell, Sonics & Materials Inc, USA). After centrifugation at 25.000gfor 30 min at 4°C, the supernatant cytoplasm fractions were recovered for further hemoglobin (Hb) depletion using Hemovoid depletion columns (Biotech Sup-port Group, Monmouth JCT, USA), according to the manufacture's protocol. The obtained Hb depleted fractions were concentrated and buffer-exchanged with 25 mM NH4HCO3pH 8.4 by centrifugal fil-tration using 3-kD Molecular Weight Cut-Offs (MWCO) (Amicon Ultra 4, Millipore) spin con-centrators. The protein concentration was determined by a colorimetric assay (Pierce BCA Protein Assay Kit, Thermo Fisher) according to the manufacturer's protocol. The efficiency of Hb-depletion was confirmed by analysing samples (10μg/lane) on coomassie stained 4–12% SDS-PAGE mini gels (NuPAGE Novex Bis Tris, Invitrogen, USA) (data not shown). Samples were stored at 80°C until further analysis.
2.3. 2D-DIGE
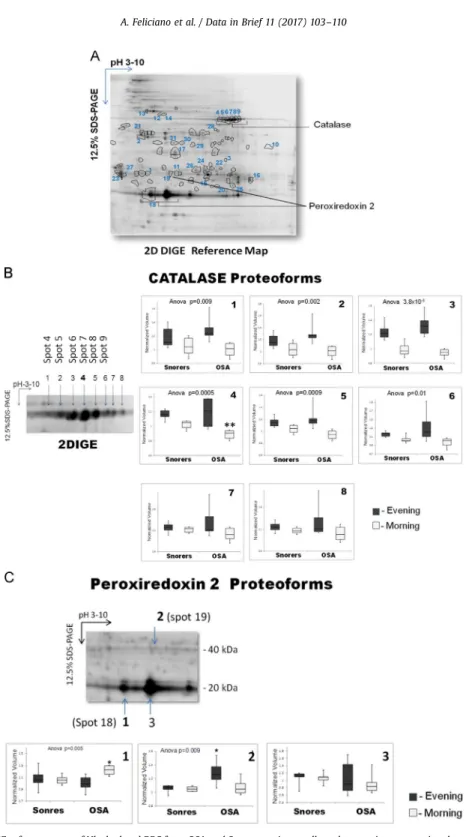
Fig. 1.2DIGE reference map of Hb-depleted RBC from OSA and Snorers patients collected at evening or morning day time. (A) The 31 protein spots exhibiting significant differences in abundance (fold changeZ1.2; Anovapo0.05) between OSA and Snorers at evening or morning times that were identified by MS, corresponding to 21 unique proteins in consequence of post-translational modification (PTM) regulations are indicated with circles on the 2D gel image. The identity of these proteins is fully described in the
Table 1. As an example, catalase proteoforms(B)and peroxiredoxin-2 proteoforms(C)are described in more detail.(B)About 8 proteoforms for catalase were identified. The most acidic ones (spot 4–9 or n°1–6) probably resulting from phosphorylation[4]
were shown significantly decreased in OSA morning samples.(C)At least three peroxiredoxin-2 protoforms were identified. The acidic monomeric forms (spot 18 or n°1) and dimeric forms (spot 19 or n°2) reported as oxi/overoxidized forms of peroxiredoxin-2
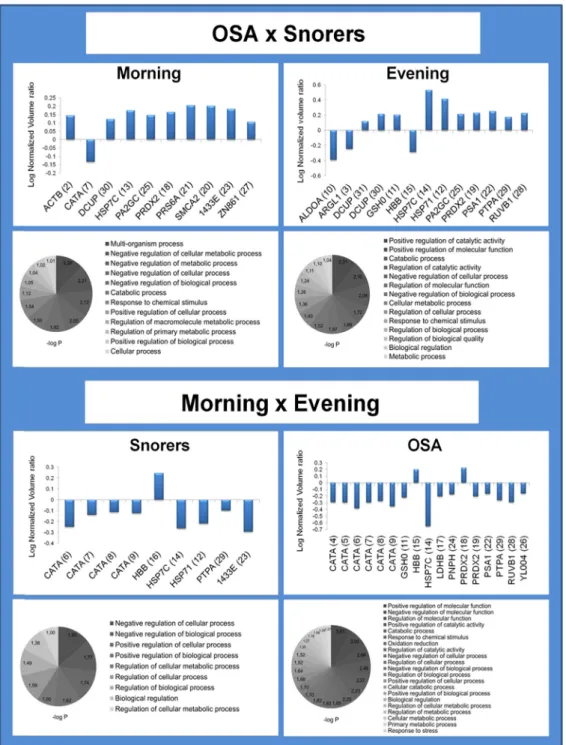
Fig. 2.Fold-change histogram and pathway analysis of RBC proteins/proteoforms with differential abundance in OSAversus
Table 1
Annotation of differential RBC cytosolic proteins between OSA and Snorers at Evening and Morning.
Spot Protein name Acession ID MW/pI Mascot
Score Sequence Coverage (%) Anova (p) Fold (Anova po0.05)
1 Actin ACTB_HUMAN 42052/
5.29
73 20 0.016 1.4
2 Actin ACTB_HUMAN 42052/
5.29
26 2 0.042 1.2 3 Arginine and glutamate-rich
pro-tein 1
ARGL1_HUMAN 33197/ 10.35
60 11 0.036 1.5
4 Catalase CATA_HUMAN 59719/
6.90
663 25 0.009 1.3
5 Catalase CATA_HUMAN 59719/
6.90
253 7 0.002 1.3
6 Catalase CATA_HUMAN 59719/
6.90
896 34 3.8E-06
1.4
7 Catalase CATA_HUMAN 59719/
6.90
730 31 4.9E-04
1.3
8 Catalase CATA_HUMAN 59719/
6.90
797 29 0.001 1.3
9 Catalase CATA_HUMAN 59719/
6.90
397 21 0.012 1.4 10 Fructose-bisphosphate aldolase A ALDOA_HUMAN 39851/
8.30
76 24 0.034 1.8 11 Glutamate–cysteine ligase
reg-ulatory subunit
GSH0_HUMAN 30708/ 5.69
235 26 0.020 1.2 12 Heat shock 70 kDa protein 1A/1B HSP71_HUMAN 70294/
5.48
201 29 0.007 1.8 13 Heat shock cognate 71 kDa protein HSP7C_HUMAN 70854/
5.37
52 2 0.019 1.2 14 Heat shock cognate 71 kDa protein HSP7C_HUMAN 70854/
5.37
380 23 3.8E-04
2.1 15 Hemoglobin subunit beta HBB_HUMAN 16102/
6.75
142 63 0.005 1.3 16 Hemoglobin subunit beta HBB_HUMAN 16102/
6.75
61 8 0.024 1.4 17 L-lactate dehydrogenase B chain LDHB_HUMAN 36615/
5.72
412 32 0.003 1.3
18 Peroxiredoxin-2 PRDX2_HUMAN 22049/
5.66
857 64 0.031 1.2
19 Peroxiredoxin-2 PRDX2_HUMAN 22049/
5.66
85 29 0.004 1.2 20 Probable global transcription
activator SNF2L2
SMCA2_HUMAN 181166/ 6.76
34 4 0.019 1.3 21 26 S protease regulatory subunit
6 A
PRS6A_HUMAN 49458/ 5.13
117 30 0.006 1.4 22 Proteasome subunit alpha type-1 PSA1_HUMAN 29822/
6.15
166 39 0.001 1.2 23 14-3-3 protein epsilon 1433E_HUMAN 29155/
4.63
96 4 0.007 1.4 24 Purine nucleoside phosphorylase PNPH_HUMAN 32097/
6.45
542 40 0.019 1.2 25 Putative inactive group IIC
secre-tory phospholipase A2
PA2GC_HUMAN 16833/ 8.84
13 14 0.016 1.2 26 Putative uncharacterized protein
FLJ45999
YL004_HUMAN 18957/ 10.14
32 10 0.012 1.2 27 Putative zincfinger protein 861 ZN861_HUMAN 11989/
8.91
30 17 0.037 1.2
28 RuvB-like 1 RUVB1_HUMAN 50538/
6.02
64 19 4.7E-04
1.3 29 Serine/threonine-protein
phos-phatase 2 A activator
PTPA_HUMAN 40641/ 5.63
246 17 1.1E-04
1.3 30 Uroporphyrinogen decarboxylase DCUP_HUMAN 40761/
5.77
32 2 0.007 1.3 31 Uroporphyrinogen decarboxylase DCUP_HUMAN 40761/
5.77
of DTT (15 min, RT) in order to accomplish reduction of disulfide bonds, followed by derivatization of cysteine residues with equilibration buffer containing 4% of iodacetamide (15 min, RT).
Second-dimension separation was performed using Ettan DALT six electrophoresis system (GE Healthcare) using 12.5% SDS-PAGE running overnight with a power of 1 W per gel and at a constant temperature of 15°C. A preparative 2D-gel stained with coomassie blue, containing equal amount of each non-labeled pooled samples mixed with 50μg of IS labeled sample, in a total of 700μg of proteins, was performed for further spot cutoff for mass spectrometry (MS) protein iden-tification. Introducing some labeled sample into preparative gel facilitates gel match with analytical gels for spot location and picking for MS analysis.
2.4. 2D-DIGE image analysis
Each gel was scanned at 100μm resolution using an Amersham Biosciences Typhoon 8400 vari-able imager, resulting in two images, one for the IS and one for the sample. To improve the signal collection capabilities of the instrument and avoid image saturation, a prescan was performed to check and adjust the photomultiplier tube (PMT) voltages of the different channels that were set to values between 500 and 550 V.
Spot detection, gel matching, and statistical analysis were performed with Progenesis SameSpots, version 4.5 (Nonlinear Dynamics, UK). Abundance values of matched spots across all gel images, expressed as normalized volume, were compared between groups, so that each spot could be assigned a score of relative significant difference, in terms of p value (o0.05). Relative content alteration of each spot across the study groups was expressed by fold change values, which were calculated by the ratio of the mean normalized volumes of a certain spot in each condition. Spots decreasing their abundance were represented by negative fold values, calculated as the inverse of the previous ratio multiplied by 1 (Fig. 1).
2.5. Protein identification
After in-gel digestion of protein spots collected from the preparative gel, proteins were identified by MS. The protein spot picking was performed manually. In-gel digestion was per-formed as described before[2]. Tryptic peptides, prepared in 50% (v/v) ACN and 0.1% (v/v) tri-fluoroacetic acid (TFA), were directly deposited on a 192-well matrix-assisted laser desorption/ ionization (MALDI) plate with 5 mg/ml α-cyano-4-hydroxycinnamic acid (α- CHCA, 1:1), pre-pared in 0.1% TFA/60% ACN (v/v) and allowed to co-crystallize at RT. Peptides were analyzed on an Applied Biosystems 4700 MALDI Proteomics Analyzer (with time-of-flight/time-of-flight (TOF/TOF) ion optics exactly as described before[2,3]. The identified proteins are displayed in the Table.
2.6. Protein annotation and classification
Protein annotation properties were acquired using the Database for Annotation, Visualization and Integrated Discovery (DAVID) v6.7 [6]. This open-source tool retrieves a set of biological and functional information such as GO terms, subcellular location, molecular function and association with biological process and/or disease with p-values of over-representation r0.05 (Fig. 2)
Acknowledgements
Transparency document. Supplementary material
Transparency data associated with this article can be found in the online version athttp://dx.doi. org/10.1016/j.dib.2017.01.005.
References
[1] A. Feliciano, F. Vaz, V. M. Torres, C. Valentim-Coelho, R. Silva, V. Prosinecki, B. Alexandre, A. S. Carvalho, R. Matthiesen, A. Malhotra, P. Pinto, C. Bárbara, D. Penque, Evening-morning peroxiredoxin-2 redox/oligomeric state variation in Obstructive Sleep Apnea red blood cells: correlation with polysomnographic and metabolic parameters, Biochim Biophys Acta. 1863, 2017, 621-629.10.1016/j.bbadis.2016.11.019.
[2] N. Charro, B.L. Hood, D. Faria, P. Pacheco, P. Azevedo, C. Lopes, A.B. de Almeida, F.M. Couto, T.P. Conrads, D. Penque, Serum proteomics signature of cysticfibrosis patients: a complementary 2-DE and LC-MS/MS approach, J. Proteom. 74 (2011) 110–126.http://dx.doi.org/10.1016/j.jprot.2010.10.001.
[3] S.A. Pacheco, V.M. Torres, H. Louro, F. Gomes, C. Lopes, N. Marçal, E. Fragoso, C. Martins, C.L. Oliveira, M. Hagenfeldt, A. Bugalho-Almeida, D. Penque, T. Simões, Effects of occupational exposure to tobacco smoke: is there a link between environmental exposure and disease? J. Toxicol. Environ. Heal. Part A 76 (2013) 311–327. http://dx.doi.org/10.1080/ 15287394.2013.757269.
[4] S.G. Rhee, K.-S. Yang, S.W. Kang, H.A. Woo, T.-S. Chang, Controlled elimination of intracellular H(2)O(2): regulation of peroxiredoxin, catalase, and glutathione peroxidase via post-translational modification, Antioxid. Redox Signal, 7, pp. 619–
626. doi:http://dx.doi.org/10.1089/ars.2005.7.619.
[5] R. a Poynton, M.B. Hampton, Peroxiredoxins as biomarkers of oxidative stress, Biochim. Biophys. Acta. 1840 (2014) 906–912.
http://dx.doi.org/10.1016/j.bbagen.2013.08.001.