AN EVALUATION
OF THE CHILD HEALTH
SERVICES
IN CORNWALL
COUNTY, JAMAICA
B. F. Melville,’ S. Ismail,’ and B. A. Wint3
A special pilot program to enhance primary care services was insti- tuted in Cornwall County, Jamaica, in 1976. The study reported here was conducted some years laterfor the purpose of assessing the effects of that program.
Introduction
Before 1976 Jamaica’s child health services were not considered effective from a public health standpoint; it was estimated, for example, that as of 1974 the percentage of children under two years old who had health services coverage was a highly inadequate 21.9% (1). Similarly, DPT and poliomyelitis immunization coverage (received respectively by 10.2% and 24.1% of the children in this age group) was very low, and the average number of health care visits made per child under two years old was insuffi- cient for satisfactory care.
Although infant mortality appeared to decline between 1973 and 1976, this appearance did not necessarily reflect reality (it is noteworthy that Puffer and Serrano (2) reported a 10% under- registration of infant deaths in urban Jamaica in the late 1960s). Malnutrition was still a common cause of death among those less than two years old in the 1970s (3), and there appeared to have been no significant change in the nutritional status of preschool children from 1970 through 1975 (4-9). Around 1970 the mean birth-weight was below the 50th percentile of the Stuart and Stevenson standard (10).
‘Nutritionist, Cornwall County Health Administration, Ministry of Health, Jamaica.
‘Lecturer, Tropical Metabolism Research Unit, Univer- sity of the West Indies, Mona, Jamaica.
‘Semor Medical Officer, Cornwall County Health Admin- istration.
These and other circumstances indicated an urgent need for a national health system directed at providing health care for children as well as for all other members of the Jamaican commu- nity. To make a start in this direction, a special primary health care program was introduced into Cornwall County in 1976 with World Bank as- sistance. Under this program, the country’s pri- mary health care services were restructured so as to bring about a decentralization of adminis- trative units. The result was a hierarchy of health centers, with the various centers being classed as types I through IV, Type I being the smallest and simplest. The latter type, with which the work reported here was principally concerned, serves populations not exceeding 4,000 inhabit- ants and is staffed by a district midwife and one or more community health aides.
In accordance with the exploratory nature of this program, a “pilot” district was established in each of Cornwall County’s five parishes. These pilot districts, designated in 1978, each had a Type IV (or sometimes a Type III) health center with associated Type II and Type I cen- ters. The main criterion used to select these pilot districts was the availability of appropriate per- sonnel and health centers.
Training programs were intensified in order to help personnel at the Type I health centers carry out an expanded role regarding delivery of primary health care. New administrative pro- cedures were established and new buildings and equipment were provided.
352
PAHO BULLETIN
l vol.18, no. 4, 1984
Exterior view of a typical Type I health center.
Materials and Methods
The aim of the study reported here was to com-
pare certain aspects of the structure, process,
and outcome of the primary child health care ser-
vices offered by the Type I health centers in the
parishes of Trelawny and St. James-both
in
the pilot and non-pilot districts of these parishes.
The study itself was carried out during the period
1 January-30 June 1980. It is worth noting that
public health nurses and community health aides
served smaller populations, on the average, in
St. James than in Trelawny , while district mid-
wives served larger average populations in St.
James than in Trelawny.
Key child health indicators were used to
evaluate the Cornwall County child health ser-
vices studied. These indicators were derived
from the clinic records of all children born be-
tween 1 January 1978 and 30 June 1978 (i.e.,
those who had their second birthday during the
study period). In all, this information was col-
lected from 323 child health records. Also, a
questionnaire was administered to all the district
midwives (11) and community health aides (14)
in the Type I centers studied for the purpose of
ascertaining why certain basic health activities
were not being performed, and a check-list was
used to obtain information about the clinics’ or-
ganization and about the community health aide
system in both St. James and Trelawny . In ad-
dition, a list of the supplies distributed to the
Type I health centers in the two parishes during
the study period (1 January-30 June 1980) was
evaluated.
ikfelvifk et
al. 0 CHILD HEALTH SERVICES IN JAMAICA353
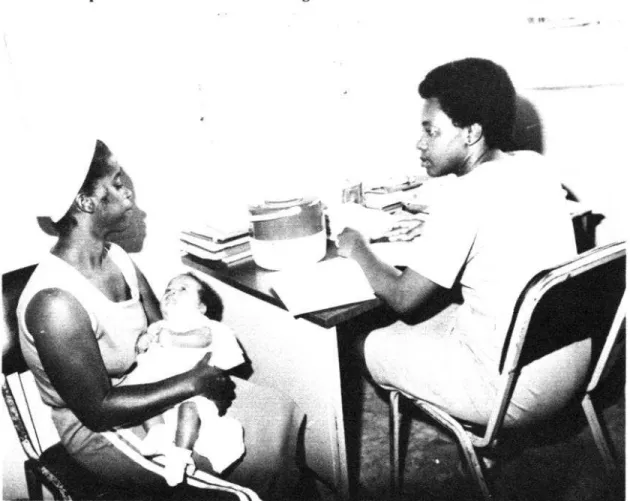
A public health nurse interviewing a mother at the child health clinic.
Results
Distribution of the Children Studied
Table 1 shows the distribution of study chil-
dren attending clinics in the pilot and non-pilot
districts of St. James and Trelawny . Table 2
indicates the proportion of study children in the
two parishes’ pilot and non-pilot districts who
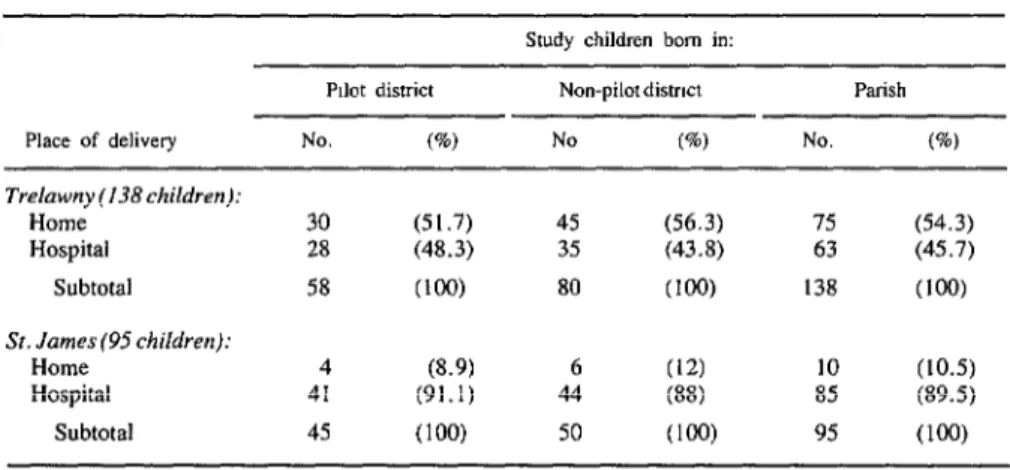
were delivered at home or in a hospital. These
data indicate that the proportion of hospital de-
liveries was significantly higher
in’ St. Jamesthan in Trelawny (P<O.OOl).
Table 3 shows the numbers of routine visits
made to child welfare clinics by study children
in St. James and Trelawny , grouped according
to whether the clinics visited were in pilot or non-
pilot districts. The average number of visits (4.9
with a standard deviation of 3.1 in Trelawny
and 4.6 with a standard deviation of 2.6 in St.
James) was similar in the two parishes. How-
ever, the average number of visits per child was
significantly higher in the Trelawny pilot district
(6.2 + 3.4) than in the Trelawny non-pilot dis-
trict (4.3 + 2.8) (P-CO.001). It is also notewor-
thy, however, that only 29% of the study chil-
dren (all clinic attenders) in the two parishes
had made seven or more clinic visits by the time
they were two years old-despite the higher than
average clinic attendance record of the study
children in the Trelawny pilot district.
Table 1. Distribution of the study children
attending clinics in St. James and Trelawny,
by pilot and non-pilot districts.
No. of children Trelawny St. James
Pilot district 73 59
Non-pilot district 130 61
354 PAHOBULLETIN l vol. 18, no. 4, 1984
Table 2. The recorded numbers of study children delivered at home and at hospitals in St. James and Trelawny, by type of district.’
Smdy children born in:
Pdot district Non-pilot distnct Parish Place of delivery No. (%I No (%I No. (%) Trelawny(138children):
Home Hospital
Subtotal
St. James(95children):
Home Hospital
Subtotal
30 (51.7) 45 (56.3) 75 (54.3)
28 (48.3) 35 (43.8) 63 (45.7)
58 Cl@3 80 (100) 138 (1W
4 (8.9) 6 (12) 10 (10.5)
41 (91.1) 44 (88) 85 (89.5)
45 (1W 50 (loo) 95 (100)
“No information about place of delivery was recorded on the child health cards of 90 study children, the vast majority of whom were presumably born at home. Typically, when children are delivered at home by traditional birth attendants or by the mothers themselves, those births are not recorded at the health clinics. Later, when visits are made to the clinics, the nurses sometimes forget to ask the mothers where their children were delivered, or else fail to record that information on the child health cards. Consequently, not all home deliveries are recorded on the child health cards.
Table 3. The average number of routine visits by study children to child welfare clinics in the pilot and non-pilot districts of St. James and Trelawny during the first two years of life, by number of visits.
Trelawny smdy children wsiting clinics n: St. James study children visiting clinics in: AN’o”.‘“opf”
Pilot district Non-pdot district Parish Pilot distnct Non-pilot district Parish routine visits
per child No. (%) No. (%) No. 6) No. 6) No. (%) No. (a)
1-4 26 (35.6) 76 (58.5) 102 (50.2) 33 (55.9) 34 (55.8) 67 (55.8)
5-6 12 (16.4) 27 (20.7) 39 (19.2) 10 (17.0) 10 (16.4) 20 (16.7)
27 35 (47.9) 27 (20.8) 62 (30.6) 16 (27.1) 17 (27.8) 33 (27.5)
Total 73 (1W 130 Cl@) 203 (loo) 59 (100) 61 (1W 120 (1W
Melville et
al. 0 CHILD HEALTH SERVICES IN JAMAICA355
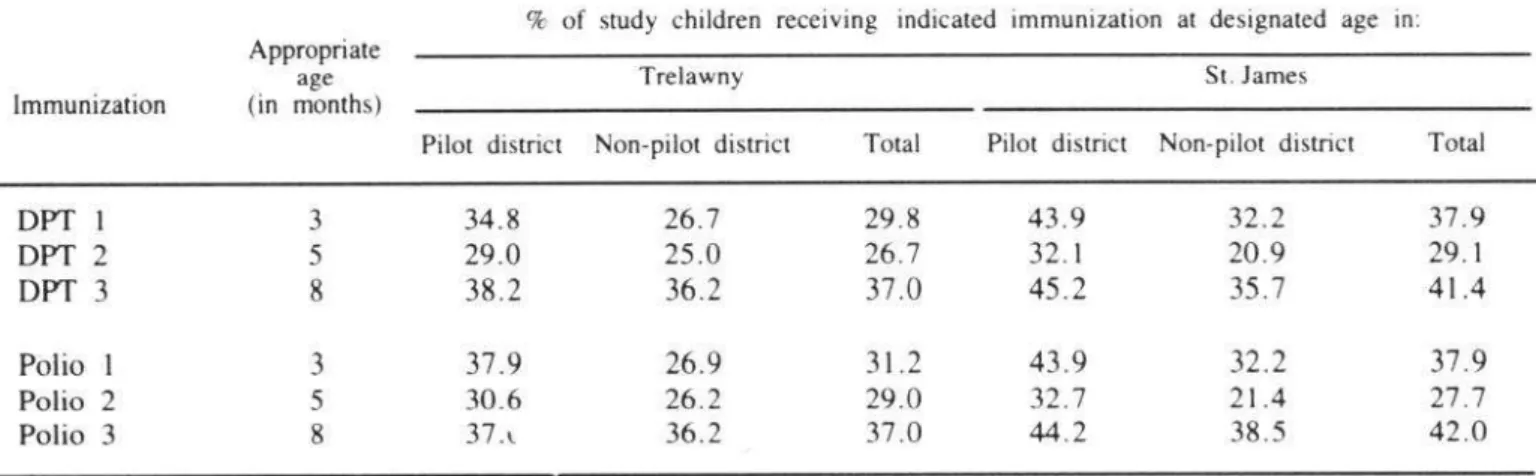
Table 4. Percentages of study children receiving the indicated DPT and poliomyelitis immunizations
at the age designated for each immunization, by district and parish.
Immunization
% of study children receiving indicated immunization at designated age in: Appropriate
age Trelawny St. James
(in months)
Pilot district Non-pilot district Total Pilot district Non-pilot district Total
DPT 1 3 34.8 26.7 29.8 43.9 32.2 37.9
DPT 2 5 29.0 25.0 26.7 32.1 20.9 29.1
DPT
3
8
38.2
36.2
37.0
45.2
35.7
41.4Polio 1
3
37.9
26.9
31.2
43.9
32.2
37.9
Polio 2 5 30.6 26.2 29.0 32.7 21.4 27.7
Polio 3 8 37.c 36.2 37.0 44.2 38.5 42.0
Birth- Weights and Nutritional Status
pital-delivered study children with low birth-
weights (less than 2,500 g) was lower in Tre-
Reliable birth-weights were available only for
lawny (0%) than in St. James (11%). The highest
children delivered in hospitals. The average
percentage of hospital-delivered study children
birth-weight of study children delivered in the
with low birth-weights (16%) was found in the
hospital was significantly greater in Trelawny
non-pilot district of St. James.
(3,287 + 657 g) than in St. James (3,076 t 588
The overall prevalence of moderate and severe
g) (PCO.05). Similarly, tht: percentage of hos-
malnutrition (G6mez grades 2 and 3 combined)
A community health aide weighing a child at the health clinic.
356 PAHOBULLETIN l vol. 18, no. 4, 1984
among the study children was similar in the two parishes (4.7% in Trelawny and 4.4% in St. James). However, the non-pilot district of Tre- lawny showed a notably higher prevalence (5.7%) than did the parish’s pilot district (3.6%).
Health Services Coverage
The actual number of children in the O-2 year age group that lived in the areas served by the health centers is unknown. Consequently, the denominator used to assess coverage was based on the assumption that in a population of 1,000 one can expect to find 60 children in this age group /11). The population served by each health center was estimated from data in the Health Ministry’s reference manual on primary health care published in 1978 (12), no more recent information being available.
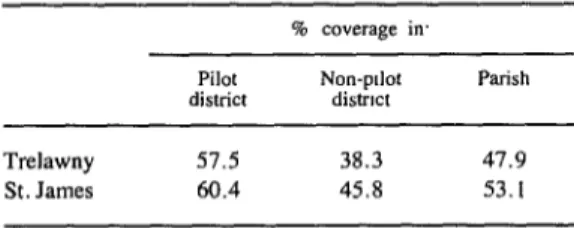
Using this data, Table 5 shows the indicated degree of health services coverage provided in the pilot and non-pilot districts of St. James and Trelawny. This coverage appeared slightly greater in St. James than in Trelawny, and seemed nota- bly greater in the pilot districts than in the non- pilot districts. In most cases, the health coverage provided for children in the O-2 age group was higher at those health centers with a relatively high health worker to population ratio.
Table 5. Estimated health services coverage for children O-2 years of age in the St. James and Trelawny
study areas, by pilot and non-pilot districts.
Pilot Non-pdot
district distmt Parish
Trelawny 57.5 38.3 47.9
St. James 60.4 45.8 53.1
Questionnaire Responses
Most of the district midwives and community health aides responding to the questionnaire
queries cited a shortage of scales as the major obstacle to weighing children at the health cen- ters. They also cited contraindications (e.g., high fever and vomiting) as factors limiting the administration of DPT and poliomyelitis vac- cines to clinic attendees.
The responses also confirmed that health center facilities (the number of rooms, size of rooms, seating facilities, lavatories, and general hygiene) were unsatisfactory. Most of the com- munity health aides said they made regular home visits, and all of them stated that equipment and supplies at the health centers were inadequate.
When asked if they liked their jobs, all of the community health aides said “yes.” However, a crude assessment of motivation suggested that motivation was better among the community health aides in St. James than among those in Trelawny .
Health Center Supplies
During the period 1 January-30 June 1980, the Type I health centers in St. James received various essential medical supplies more fre- quently than did the Type I health centers in Trelawny. These supplies included analgesics, iron preparations, local antiseptics, dressings, expectorants and cough suppressants, antacids, cotton, bandages, and vaccines. Consequently, during this period more medical supplies were available for the delivery of primary health care at the Type I health centers in St. James than at those in Trelawny.
Melville et al. l CHILD HEALTH SERVICES IN JAMAICA 357
Discussion and Conclusions
Since the introduction of the special primary health care program in Cornwall County, there appears to have been some slight improvement in certain aspects of child health services. Over- all health services coverage for children under two years of age has improved, and the average number of routine visits per child to child health clinics has increased--even though only 30.6% of the Trelawny study children and 27.5% of the St. James study children in this age group made the minimum number of seven routine clinic visits called for by the Jamaican Ministry of Health (II). Also, the results of this study indicate that the prevalence of malnutrition has fallen since 1970, thereby supporting similar general findings previously reported by Fox et al. (13).
However, the study also revealed that immu- nization coverage was still low and that the num- bers of children immunized at the appropriate ages were unsatisfactory. It also indicated no major increase in average birth-weights, a cir- cumstance posing a particular problem in the parish of St. James. (Infant mortality in Cornwall County’s three parishes was about 27 deaths per thousand live births in 1980-14.)
In general, the child health goals set forth in the World Bank report of 1976 (1.5) were only partly met. Shortages of personnel, equipment, and supplies, together with unsatisfactory phys-
ical plants at the health centers, presumably con- tributed to the failure to meet these targets; in addition, of course, the targets themselves may have been optimistic.
On the whole, the centers studied in St. James performed better than those in Trelawny in terms of the child health component of the primary health care program. This could be attributed to (a) better motivation by community health aides and public health nurses in St. James, (b) the smaller populations served by each community health aide and public health nurse in St. James, and (c) the fact that more regular supplies reached the Type I health centers in St. James.
Although the results indicated that the centers in the pilot districts were performing better than those in the non-pilot districts, a general assess- ment of both child and maternal health activities (16) showed that the quality of the health person- nel at each health center seemed to play a major part in influencing health care activities, whether the district was a pilot district or not.
In conclusion, there is no doubt that primary health care services can contribute to the im- provement of children’s health status. However, the establishment of adequate support services is crucial. Thus, there is a need to improve the overall operation and structure of the primary health care program in Cornwall County-as well as primary care services elsewhere in the country-if Jamaica is to stand a reasonable chance of achieving the goal of “health for all by the year 2000.”
ACKNOWLEDGMENTS
358 PAHO BULLETIN l vol. 18, no. 4, 1984
SUMMARY
In 1976 a special pilot program was initiated in Cornwall County, Jamaica, with World Bank assis- tance. This program sought to enhance primary health care services, primarily through training and decen- tralization. The study reported here, conducted in January-June 1980, was designed to gauge that pro- gram’s effect on the health of children under two years of age.
data on supplies provided to the centers.
For this purpose, two Cornwall County parishes (St. James and Trelawny) were selected, and within each the “pilot” district where the program had been implemented was studied along with a “non-pilot” district. The study itself was based on the records of 323 children attending the smallest and simplest class of health care center within the areas covered, together with health worker responses to a questionnaire and
The study results suggest that certain features of infant and young child health services in the study parishes improved between 1976 and 1980. Specifical- ly, health service coverage appears to have increased; the average number of routine clinic visits per child rose; and the prevalence of malnutrition seems to have diminished. On the other hand, immunization coverage was still low, and the study findings indicate no major increase in average birth-weights. Regarding the “pilot” versus “non-pilot” districts, the former fared somewhat better than the Iatter in terms of the average number of clinic visits per child, immuniza- tion coverage, low-weight births, nutritional status, and health services coverage, although in many cases the differences observed were fairly modest.
REFERENCES
(1) Ashley, D. An Assessment of the Maternal and Child Health Programme in Jamaica. Ministry of Health; Kingston, Jamaica, 1980.
(2) Puffer, R. R., and C. V. Serrano. Patterns
of
Mortality in Childhood. PAHO Scientific Publication262. Pan American Health Organization, Washing- ton, D.C., 1973.
(3) Ashworth, A., and D. Picou. Nutritional status in Jamaica, 1968-1974. West Indian MedJ 25:23-24, 1976.
(4) Alderman, M. H., B. Levy, J. Husted, R. Searle, and 0. D. Minnott. A young-child nutrition programme in rural Jamaica. Lancet 1: 1166-l 169, 1973.
(5) Anthrobus, K.A.C. Programme Planning and Evaluation in Community Nutrition Education (Re- port on the Lambs River Project, Jamaica, 1971- 1974). The Freedom from Hunger Campaign, United Kingdom, 1975.
(6) Bantje, H.F.W. Household Circumstances in Infant Malnutrition in Western Hanover. CFNI Mimeographed .Document 544-74. Caribbean Food and Nutrition Institute, Kingston, Jamaica, 1974.
(7) Gurney, J. M., H. Fox, and J. Neill. A rapid survey to assess the nutrition of Jamaican infants and young children in 1970. Trans R Sot Trop Med Hyg 66:653-662, 1972.
(8) Lamboum, A. Nutritional Status of Children Attending Child Health Clinics in Portland in 1973. Ministry of Health; Kingston, Jamaica, 1973.
(9) Marchione, T. J. Food and nutrition in self-re- liant national development: The impact on child nutrition of Jamaica Government policy. Medical An- thropology 1:57-79, 1977.
(IO) Grantham-McGregor, S. M., P. Desai, and E. H. Back. A longitudinal study of infant growth in Kingston, Jamaica. Hum Biof 44:549-56 I, 1972.
(II) Ministry of Health, Jamaica. Manual for Health Centre-Type I. Kingston, Jamaica, 1977.
(12) Ministry of Health, Jamaica. Primary Health Care-The Jamaican Perspective: A Reference Man- ual
for
Primary Health Care Concepts and Ap- proaches in Jamaica. Kingston, Jamaica, 1978.(13) Fox, K., M. Gueri, J. M. Gurney, P. J. Jutsum, R. Paradis, W. K. Simmons, and M. Spence. The Nutritional Status of Jamaican Pre-School Children in 1978 (with Comparison with a Previous Study). CFNI Mimeographed Document J 20-79. Caribbean Food and Nutrition Institute, Kingston, Jamaica,
1974.
(14) Desai, P., B. F. Hanna, B. F. Melville, and B. A. Wint. Infant mortality rate in three parishes of western Jamaica, 1980. West fndian MedJ 32:83-87,
1983.
(1.5) World Bank. Appraisal of a Second Popula- tion Project: Jamaica Report No. 1040 B-J 19. Washington, D.C., 1976.