Functionally Active
In Vitro
, but Do Not Prevent Colitis
Yu-Yuan C. Go¨tlind1*, Sukanya Raghavan1, Paul W. Bland1,2, Elisabeth Hultgren Ho¨rnquist3
1Department of Microbiology & Immunology, Institute of Biomedicine, Mucosal Immunology and Vaccine Center, University of Gothenburg, Gothenburg, Sweden,
2University of Bristol, Clinical Veterinary Science, Bristol, United Kingdom,3School of Health and Medical Sciences, O¨rebro University, O¨rebro, Sweden
Abstract
Background:Mice deficient in the inhibitory G protein subunit Gai2 spontaneously develop a T helper 1 dominated colitis. We examined whether a defect in CD4+FoxP3+regulatory T cells (Treg) underpins the pathogenesis of colitis in the Gai22/2
(Gai2-deficient) colitis model.
Methodology/Principal Findings:Using flow cytometry, we found that thymus and colonic lamina propria, but not spleen and mesenteric lymph nodes, of colitic Gai22/2mice contained increased frequencies of Treg, whereas FoxP3 expression
intensity was similar in Gai22/2compared to Gai2+/2or Gai2+/+wild type (WT) mice. The frequency of CD4+FoxP3+T cells expressing CD103 was significantly increased in Gai22/2compared to WT mice. Treg in colons from WT mice clustered in
the T cell areas of colonic lymphoid patches (CLP), with relatively few Treg in the lamina propria, as demonstrated by immunohistochemistry. In Gai22/2mice, CLP were not observed but lamina propria Treg were increased in number and frequency within the CD4+infiltrate, compared to WT mice. Using an in vitro co-culture system and flow cytometric analysis of cell division we could demonstrate that the in vitro suppressive function of WT and Gai22/2CD4+FoxP3+regulatory T cells (WT-Treg and KO-Treg) was indistinguishable, but that T effector cells (CD4+252T cells) from Gai22/2mice were less
readily suppressed than WT effectors (WT-Teff) by Treg from either source. However, neither WT nor Gai22/2Treg was able to suppress colitis induced by adoptive transfer of Gai22/2effector T cells (KO-Teff) to RAG22/2recipients. The enhanced
inflammatory activity of Gai22/2 effectors was accompanied by increased expression of an effector/memory T cell
phenotype and increased cytokine secretion, especially IL-4, IL-6 and IFN-c.
Conclusions: There is an increased frequency of Gai22/2 Treg in the colon, and they demonstrate no endogenous functional defect. However, Gai22/2T effector cells are dramatically less susceptible to suppression in vitro, and in vivo, despite increased effective numbers of Treg, they cannot prevent disease.
Citation:Go¨tlind Y-YC, Raghavan S, Bland PW, Ho¨rnquist EH (2011) CD4+FoxP3+Regulatory T Cells from G
ai22/2Mice Are Functionally ActiveIn Vitro, but Do Not Prevent Colitis. PLoS ONE 6(9): e25073. doi:10.1371/journal.pone.0025073
Editor:Jacques Zimmer, Centre de Recherche Public de la Sante´ (CRP-Sante´), Luxembourg
ReceivedMay 9, 2011;AcceptedAugust 26, 2011;PublishedSeptember 22, 2011
Copyright:ß2011 Go¨tlind et al. This is an open-access article distributed under the terms of the Creative Commons Attribution License, which permits unrestricted use, distribution, and reproduction in any medium, provided the original author and source are credited.
Funding:Funding for this work was provided by the Swedish Research Council (http://www.vr.se/inenglish) Grant no 2008-4075, The Swedish Cancer Society (http://www.cancerfonden.se/sv/Information-in-English/) Grant no. CAN 2008/591, and the Sahlgrenska Academy (Ph.D. student grant for Y-YG) (http://www. sahlgrenska.gu.se/). The funders had no role in study design, data collection and analysis, decision to publish, or preparation of the manuscript.
Competing Interests:The authors have declared that no competing interests exist.
* E-mail: [email protected]
Introduction
The mucosal immune dysregulation which results in chronic inflammatory bowel disease (IBD) has been evaluated using several chemically-induced, T cell transfer and spontaneous mouse
models of colitis. Untreated Gai22/2 mice on a 129SvEv
background spontaneously develop colitis [1,2,3]. The inflamma-tion is restricted to the large intestine, resembling the pathology seen in human ulcerative colitis (UC) with crypt distortion, loss of mucin producing goblet cells, and abscess formation together with erosion and ulcerations of the mucosa [1,2,3].
The development of colitis in the Gai22/2 mouse model is
dependent on the presence of an enteric microflora (unpublished
observations) and is characterized by a Th1 CD4+T cell response,
with increased production of IFN-c, together with increased levels
of IL-1, IL-6 and TNF-a in inflamed tissue [1,2,4]. The lack of
Gai2 results in functional disorders in epithelial cells [5],
professional antigen-presenting cells [6], B cells [2,4,6] and
CD4+
T cells [1,3,7,8,9] and points to multiple requirements for
Gai2 in mucosal immune regulation, but the underlying molecular
mechanisms involving Gai2 have not been defined.
Mucosal tolerance to environmental and food antigens is essential to prevent exacerbated immune reactions that can cause allergic diseases and chronic inflammation, and it has long been recognized that the gut is an important site for the induction of tolerance [10]. Peripheral immune tolerance is mediated by several mechanisms, including anergy; deletion; ignorance; or suppression of effector T cell (Teff) function by different populations of regulatory T cells (Treg) [11]. There are two subsets of Treg: natural Treg (nTreg), which develop in the thymus; and inducible Treg (iTreg), which are derived from naı¨ve
CD4+
T cells in the periphery. Inducible Treg comprise type 1 regulatory T cells (Tr1), which are induced by IL-10 [12] and T
helper 3 (Th3) cells, which are induced by TGFb[13]. Treg utilize
contact-dependent mechanism in vitro (possibly by granzyme or perforin-mediated cytotoxicity or by cAMP), while their regulatory effects in vivo are assumed to be mainly cytokine-mediated [14,15].
The development, function, and homeostasis of Treg are controlled by the forkhead family transcription factor, Foxp3 [16,17,18]. Mutations in the gene encoding Foxp3/FOXP3 have been identified in both mice and humans [16,19]. Patients with
mutations inFOXP3develop a severe, fatal systemic autoimmune
disorder, Immune Dysregulation Polyendocrinopathy Enteropathy X-linked (IPEX) syndrome [19]. Experiments using adoptive transfer of effector and regulatory T cell populations into immunodeficient mice indicate a crucial role for Treg in maintaining mucosal immune homeostasis [20,21], suggesting that dysfunction of Treg may be a contributory factor in the pathogenesis of human IBD.
In this study, we address the hypothesis that colitis in Gai22/2
mice is a consequence of a qualitative or quantitative defect in
CD4+
FoxP3+
regulatory T cells (Treg). The data show that
although Treg from Gai22/2mice are functional in vitro, and are
present at enhanced frequency within the CD4+
infiltrate in colitis, they are unable to prevent disease caused by endogenously
activated Gai22/2 effector T cells, the latter being significantly
more resistant to suppression by either wild type or Gai22/2Treg.
Materials and Methods
Ethics statement
All animal procedures were carried out under local and national ethical guidelines (Swedish Board of Agriculture) and were approved by the regional ethical committee, Gothenburg Administrative Court of Appeal, with the ethical approval ID 79-2008.
Mice
Gai22/2 deficient (Gai22/2) mice on a pure 129SvEv
background were bred and maintained under specific pathogen-free conditions in microisolator cages with filtered air at the Department of Experimental Biomedicine, University of
Gothen-burg. Heterozygous Gai2+/2males were bred with heterozygous
females, and the offspring were genotyped by polymerase chain reaction (PCR) analysis using genomic DNA from the tail.
Homozygous Gai22/2mice on this background develop a lethal
colitis between the age of 5 and 8 weeks. In this study, mice were euthanized at 4–5 weeks (pre-colitic) or 5–9 weeks (colitic) and the absence/presence of colitis was confirmed post mortem. The experiments included both male and female mice as gender differences in clinical disease or immune parameters have not been
found [7]. Both homozygous wild-type (WT) Gai2+/+
and
heterozygous (Gai2+/2) mice were used as controls in the study
(collectively referred to here as ‘‘WT mice’’). RAG22/2mice on a
129SvEv background (a kind gift from F. Powrie, Univ. of Oxford) were bred homozygous, and were used as recipients in our cell transfer model.
Media and antibodies
Fetal calf serum (FCS), 2-mercaptoethanol and Triton X-100 were purchased from Sigma-Aldrich (St. Louis, MO). Fixation/ Permeabilization solution was purchased from eBioScience (San Diego, CA). Calcium and magnesium free HBSS (CMF-HBSS), HEPES, RPMI 1640 medium, GlutaMAX I and gentamicin were purchased from Invitrogen-GIBCO (Carlsbad, CA).
Antibodies used were: rat IgG2b anti-mouse CD16/CD32 (2.4G2), rat IgG2a anti-mouse CD4-Pacific Blue (PB) or -FITC (RM4-5), hamster IgG3 anti-mouse CD3-PE (145-2c11), CD62L
(L-selectin/LECAM-1/Ly-22), CD44 (Pgp-1/H-CAM/Ly-24), rat IgG1 anti-mouse CD25-APC (PC61), rat IgG2a anti-mouse CD4
(L3T4), rat IgG2akisotype control, all BD Pharmingen (San Jose,
CA); rat IgG2a isotype control (eBR2a), rat IgG2a anti-mouse Foxp3-PE or FITC (FJK-16S) (Flow Cytometry) or unconjugated (Immunohistochemistry), all eBioScience (San Diego, CA); goat anti-rat IgG Alexa Fluor 488, goat anti-rat IgG Alexa Fluor 568 amplification, all Molecular Probes-Invitrogen (Eugene, OR).
Solublea-CD3 mAb (10% supernatant from hybridoma 45-2C11)
was produced in-house.
Immunohistochemistry
Mouse colons were removed intact and rolled around a toothpick with proximal colon on the inside and distal colon on the outside of the roll, embedded in OCT compound
(Tissue-TekH, Miles Inc., Elkhart, IN), frozen in liquid nitrogen-cooled
isopentane and stored at280uC. Frozen sections, 6mm (sectioned
on a Leica CM3050s cryostat (Leica Microsystems, Wetzlar, Germany)), were fixed in 100% cold acetone for 10 min prior to H&E or fluorescence staining. For FoxP3/CD4 double labelling, sections were post fixed in 4% buffered formaldehyde for 5 min and permeabilized using 0.5% Triton X-100 for 5 min. After fixation/permeabilization, sections were incubated with rat IgG2a anti-mouse FoxP3, or with rat IgG2a isotype control, followed by detection using goat anti-rat IgG Alexa Fluor 568. The samples were then incubated with rat anti-mouse CD4, followed by goat
anti-rat IgG Alexa Fluor 488. The slides were mounted in 49,
6-diamidino-2-phenylindole (DAPI)-containing mounting medium (Molecular Probes-Invitrogen) and visualized with a Zeiss Axioskop 2 microscope (Carl Zeiss Imaging, Thronwood, NY) and analyzed by Axiovision 4,5 software (Carl Zeiss Imaging) or Leica DFC 480 (Leica Microsystems GmbH, Germany). Numbers
of CD4+cells and CD4+FoxP3+cells were counted, using Image J
(Image Processing and Analysis in Java, National Institutes of Health, U.S.A), at 3–5 sites of the mucosa in distal colons from
four colitic Gai22/2 mice and 4 WT controls; and at least one
colonic lymphoid patch (CLP) in each of four WT control mice.
Preparation of cell suspensions
Single cell suspensions were prepared from the whole thymus, spleen or mesenteric lymph nodes (MLN) as previously described [1,7]. Splenic erythrocytes were lysed with ammonium chloride and cells were then washed in phosphate-buffered saline (PBS) containing 1% heat inactivated fetal calf serum (FCS). For isolation of colonic lamina propria lymphocytes (LPL), dissected colons were washed free of fecal contents by flushing with saline. They were then opened longitudinally, washed extensively in Hank’s Balanced Salt Solution without Calcium and Magnesium (CMF-HBSS) supplemented with 15 mM HEPES and incubated
for 5615 min at 37uC, in CMF-HBSS containing 5 mM EDTA
to remove epithelial cells and intraepithelial lymphocytes. The remaining tissue was incubated for 15 min in RPMI 1640 containing 15 mM HEPES and 10% heat inactivated FCS, followed by three successive 60 min incubations in Liberase/ blendzyme 3 (0.2 Wu¨nsch units/ml, Roche Applied Science,
Indianapolis, IN) in RPMI 1640 medium+GlutaMAX I
contain-ing 15 mM HEPES and 20% heat inactivated horse serum, yielding LPLs.
Flow cytometry
Single cell suspensions of 16106cells/30ml were incubated on
ice for 10 min with unconjugated anti-CD16/CD32 and then for
30 min with: anti-CD4-PB or -FITC; anti-CD3e-PE;
For intracellular staining, cells were first permeabilized using Fixation/Permeabilization solution. Cells were then acquired on a BD LSRII flow cytometer (BD Biosciences, San Jose, CA), and the data analyzed using the Flow-Jo software (Tree Star Inc., San Carlos, CA).
Cell fractionation
Splenic CD4+
cells were partially purified by negative selection on AutoMACS (Miltenyi Biotec, Bergisch Gladbach, Germany),
following the manufacturer’s instructions, using the mouse CD4+
T cell isolation kit (Miltenyi Biotec). Cells were then labeled with
fluorochrome-conjugated CD4-PB, CD25-APC, CD3e-PE in PBS
supplemented with 2% FCS and 2 mM EDTA, washed and
subsequently sorted into CD25+
and CD252subpopulations using
a FACSAriaH (BD Biosciences). Purity of the sorted cells
(CD3+CD4+CD25+or CD3+CD4+CD252) ranged from 95% to
98%. The CD25+and CD252populations contained 89.366.9%
(n = 9) and 6.361.8% (n = 9) (Gai22/2 mice) or 91,066,0%
(n = 11) and 4,361.4% (n = 6) (WT mice) FoxP3+lymphocytes,
respectively.
Macroscopic scoring of colitis
Colonic pathology was macroscopically scored in a blinded fashion by two independent observers and graded for the following parameters: thickness (0–2), stiffness (0–3), edema (0–3) and visible ulcerations (0–1), with a total maximum score of 9 [22].
Adoptive transfer
Freshly sorted splenic CD4+CD25+ (Treg) and CD4+CD252
cells (Teff), either 46105Teff only, or co-transferred with 16105
Treg, from colitic Gai22/2 and WT mice were adoptively
transferred into 129SvEv RAG22/2 mice by i.p. injection.
RAG22/2 mice on this background are resistant to colitis
induction by WT effector T cells in the absence of H hepaticus
infection [23].
Analysis of cell division
Analysis of cell division by dye dilution was performed using a Vybrant CFDA SE cell tracer kit (CFSE) (Molecular Probes-Invitrogen). Effector T cells were washed twice with cold PBS,
resuspended in 1 ml 5mM CFSE solution/107 cells, and
incubated for 8 min at room temperature in the dark. Staining was quenched by adding an equal volume of FCS. Cells were then washed twice with complete culture medium and used in the suppression assay. The calculation of percent cell division of Teff within the Teff:Treg co-cultures was performed using FlowJo software (Tree Star Inc., San Carlos, CA). The percentage of the CFSE-labelled Teff cells of the original sample which had divided are denoted as ‘‘Cell division %’’ in the graph. I.e., if all the Teff in the starting population have divided, the Cell division % = 100%.
Table 1.Frequency of FoxP3+T cells in CD4+, CD4+CD25+and CD8+subpopulations from mesenteric lymph nodes (MLN), as determined by flow cytometry.
Mean %±SD of FoxP3+
Range
CD4+ early colitic mice n = 7 10.7
62.5 (7.34–13.3)
control mice{ n = 7 9.061.0 (7.84–10.2)
colitic mice n = 7 11.461.6 (8.84–12.9)
control mice{{ n = 7 9.161.4 (7.76–11.9)
CD4+ CD25+
early colitic mice n = 7 81.068.7 (71.1–94.6)
control mice{ n = 7 82.0611.9 (66.0–95.1)
colitic mice n = 7 79.265.7 (73.2–87.8)
control mice{{ n = 7 91.262.2 (88.8–93.4)
CD8+
early colitic mice n = 7 1.661.4 (0.29–3.73)
control mice{ n = 7 1.261.0 (0.29–2.46)
colitic mice n = 7 0.660.3 (0.26–0.96)
control mice{{ n = 7 0.460.2 (0.29–0.75)
{
: 4–6 weeks old mice, {{
: 7–9 weeks old mice.
doi:10.1371/journal.pone.0025073.t001
Figure 1. Frequency and intensity of expression of FoxP3 in CD4+ T cells in central, peripheral and mucosal lymphoid
tissue.A. Frequencies of FoxP3+
cells in gated CD4+
T lymphocytes in colitic Gai22/2 mice were compared to age-matched control mice,
(n$6 in each group) as determined by FACS analysis. Each symbol represents one mouse and the mean of each group is indicated by a line. Results are shown from at least three independent experiments, where *** = p#0.001. B. Intensity of FoxP3 expression, measured as median fluorescence intensity (MFI) of gated CD4+FoxP3+lymphocytes. Results are shown as mean values6SD of n = 4 to 6 mice per group, pooled from at least three independent experiments.
In vitro suppression assay
Sorted splenic CD4+
CD252cells (Teff), 56104 cells per well,
stained with CFSE, from colitic Gai22/2 or WT mice were
incubated with CD4+CD25+putative Treg from colitic Gai22/2
or WT mice at Teff:Treg ratios of 2:1, 4:1, 8:1 or Teff alone in
96-well round-bottom plates for 72 h at 37uC in 5% CO2 in the
presence of solublea-CD3 mAb in Basal Iscove complete medium
containing 10% heat-inactivated fetal calf serum, 50mM
2-mercaptoethanol, 1 mM L-glutamine, and 50mg/ml gentamicin.
Irradiated (25 Gy Cesium-137) T cell-depleted spleen cells from
WT mice were used as accessory cells at 26105cells per well.
Cytokine measurements in supernatants
Cytokine concentrations in supernatants from the suppression assays were measured using a cytometric bead array (CBA) kit, mouse Th1/Th2/Th17 cytokine kit (BD Pharmingen); according
to the manufacturer’s instructions. Cytokine levels were quanti-tated using calibrated standards of each cytokine and analyzed by the CBA software.
Statistical analysis
The Mann-Whitney non-parametric test for unpaired data, the Student t-test or one-way ANOVA (Tukey’s Multiple Comparison Test) were used for comparison between groups. Differences were
considered statistically significant at p,0.05.
Results
FoxP3 expression is restricted to CD4+T cells
The localization of FoxP3 expression within T cell
subpopula-tions in Gai22/2and WT mice was analyzed, using mesenteric
lymph node (MLN) cells. As illustrated in Table 1, FoxP3+
cells
Figure 2. Immunohistochemical analysis of distribution of CD4+FoxP3+cells in colonic tissues.A, B, E, F = colon from WT mice; C, D = colon from Gai22/2mice with colitis. Tissues were double stained for CD4 and FoxP3. Images shown are double positive (DP) CD4+
(green) FoxP3+
(red) (A, C, E) (where DP cells appear as yellow), or single positive (SP) FoxP3 (grey) (B, D, F); In WT colonic mucosa (A, B), CD4+
T cells were few in number and were mostly confined to the basal lamina propria. In colitis (C, D), CD4+T cells infiltrated the entire lamina propria and included many DP cells. Within colonic lymphoid patches (CLP) of WT mice (E, F), interfollicular T cell areas contained many DP CD4+
FoxP3+
cells (compare to paucity of DP cells in normal mucosa to left and right). G–J, controls: G, CD4/FoxP3; H, CD4/FoxP3 isotype control; I, CD4 isotype control/FoxP3; J, CD4 isotype control/FoxP3 isotype control. Original magnifications:620. K. Absolute numbers of CD4+
cells and CD4+ FoxP3+
cells were counted at 3–5 sites of mucosa in distal colons from 4 colitic Gai22/2mice and 4 WT control mice; at least one Colonic Lymphoid Patches (CLP) was counted in 4 WT control
mice. ‘‘Upper’’ and ‘‘lower’’ lamina propria were defined as above crypt bases and between crypt base and muscularis mucosa, respectively. L. Frequency of FoxP3+cells within the CD4+population, as calculated from the results in K. Results are shown as mean values
6SEM of n = 4 mice per group, where * = p#0.05, ** = p#0.01 and *** = p#0.001.
were restricted to the CD4+
T cell population in the MLN in both precolitic and colitic mice, with 80 to 90% residing in the
CD4+
CD25+
T cell population. The CD8+
T cell population had
almost no expression of CD25 (,1% positive cells, data not
shown) and Foxp3 expression was detected on less than 2% of
CD8+
T cells [Table 1].
Frequency of FoxP3+lymphocytes in central, peripheral and gut-associated lymphoid tissues
We and others have reported that precolitic Gai22/2 mice
develop thymic atrophy, a significant decrease in the number of thymocytes, and a higher frequency of mature thymocytes, compared to WT mice [7,24]. As FoxP3 expression is restricted
to CD4+
mature single positive thymocytes, we examined the
frequencies of CD4+FoxP3+thymocytes in Gai22/2compared to
WT mice. Gai22/2 CD4+
mature thymocytes contained a
significantly higher frequency of FoxP3+
cells compared to WT
thymocytes (p,0.01) (Fig. 1A). In contrast, there were no
significant differences in the frequency of splenic and MLN
CD4+FoxP3+T cells between colitic Gai22/2 and age-matched
WT mice. The frequency of CD4+FoxP3+T cells was, however,
significantly higher (p,0.001) in the colonic lamina propria (LP) of
colitic Gai22/2 mice, compared to the healthy colon of WT
controls. In addition, we also analyzed the intensity of expression
of FoxP3 within CD4+FoxP3+cells in the thymus, spleen, MLN,
and colonic lamina propria, measured as median fluorescence intensity (MFI). No statistically significant differences were found
in these four lymphoid tissues between colitic Gai22/2and
age-matched WT mice, (Fig. 1B). These data indicate that the
spontaneous chronic inflammation in Gai22/2 mice cannot be
explained by a simple quantitative reduction of Treg within total colonic tissues.
However, as it is likely that the function of Treg is related to their distribution within tissues in relation to effector T cells, we further examined their tissue distribution in colonic tissues of WT
and colitic Gai22/2 mice, by immunohistochemistry. In the
lamina propria of WT mice, CD4+
T cells were sparse, mostly restricted in the tissue to the level of the crypt bases, and contained
few FoxP3+
cells (1–4%, Fig. 2A–B, K–L). In colonic lymphoid
patches (CLP) of WT mice, large numbers of CD4+
FoxP3+
Treg were observed, restricted to the interfollicular T cell areas (Fig. 2E–
F), comprising 10–15% of the total CD4+
T cells in this tissue
(Fig. 2L). In colitic Gai22/2 mice, the distribution was quite
different. In the inflamed colon, no discrete CLP with associated
clustered CD4+
FoxP3+
Treg were observed. Instead, the colonic lamina propria, particularly above the level of crypt bases, was
heavily infiltrated by CD4+
cells – a 106increase over equivalent
WT tissues (Fig. 2A–J, K). A significant number of these CD4+
infiltrating cells expressed FoxP3 (Fig. 2K), with a 10–206
increase in the number of CD4+
FoxP3+
cells in the basal and upper mucosa, respectively. Similar to the flow cytometric analysis, their frequency in the upper lamina propria were
increased 2–36compared to CD4+
cells in WT colon (Fig. 2L). Thus, the hyperplastic mucosa in established colitis was heavily
infiltrated by a ten-fold increase in CD4+
T cells, and the
proportion of FoxP3+
cells rose by two- to three-fold. However, this was preceded by a loss of CLP, which, in the WT colon, contain the major proportion of Treg.
Figure 3. Expression of integrinaE (CD103) on CD4+CD25+FoxP3+
Treg cells from central, peripheral and mucosal lymphoid tissue. Frequencies of CD4+
CD25+ FoxP3+
Treg cells in thymus, spleen, mesenteric lymph nodes (MLN) and colon from 5 to 8 weeks old colitic Gai22/2mice and age-matched WT littermates. (n$6 in each group),
expressing CD103 were determined by FACS analysis. Gates were set on the CD4+
CD25+ FoxP3+
subpopulation of lymphocytes. Each symbol represents one mouse and the mean is indicated by a line. Results pooled from at least three independent experiments, where ** = p#0.01 and *** = p#0.001.
doi:10.1371/journal.pone.0025073.g003
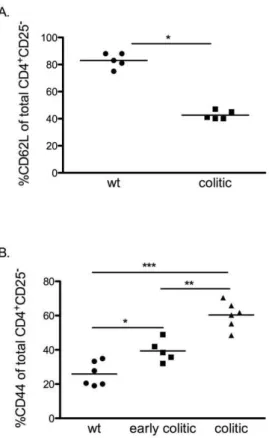
Figure 4. Increased frequencies of CD62L+and CD44+effector T
cells in spleens of Gai22/2mice.A. Frequencies of CD62L+cells in
gated CD4+
CD252splenocytes in colitic Gai22/2mice were determined
by FACS analysis and compared to age-matched control mice, (n = 5 in each group) B. Expression of CD44+
cells in gated CD4+ CD252
splenocytes in early colitic, colitic Gai22/2 mice and age-matched
control mice, (n = 5–6 in each group). Each symbol represents one mouse and the mean of each group is indicated by a line. Results are shown from at least three independent experiments, where * = p#0.05, ** = p#0.01 and *** = p#0.001.
High frequencies of CD103-expressing Treg in colitic Gai22/2 mice
IntegrinaE(CD103)ß7 contributes to mucosa specific retention
of T cells and other cells within epithelia by binding to E-cadherin [25,26]. In addition, CD103 has a possible accessory function for activation of intraepithelial lymphocytes. It has been reported that CD103 is a marker for activated Treg [27] We therefore investigated the frequency of Treg with CD103 expression in primary, secondary and gut-associated lymphoid tissues in
Gai22/2mice. As shown in Fig. 3, the frequency of CD4+FoxP3+
T cells expressing CD103 was significantly increased in Gai22/2
compared to WT mice in all four tissues studied: thymus, spleen, MLN, and colonic lamina propria.
Treg from colitic Gai22/2 mice fail to protect against colitis in a transfer model
Our group and others have reported that CD4+
T cells from
Gai22/2 mice undergo altered development and amplified
responses to TCR ligation [7,8]. The increase in frequency of
Treg among total CD4+T cells in the thymus and in the inflamed
colon of Gai22/2mice, compared to WT mice prompted us to
investigate the functional activity of the Treg in vivo and in vitro.
CD4+
CD252 effector T cells from colitic Gai22/2 mice
(KO-Teff), or CD4+
CD252effector T cells from WT mice (WT-Teff)
were transferred with or without CD4+CD25+ Treg from
Gai22/2mice with colitis (KO-Treg) or WT mice (WT-Treg) at
a 4:1 Teff:Treg ratio into RAG22/2 recipients. Analysis of the
activation phenotype of these transferred CD4+
CD252 cells
showed that those derived from colitic Gai22/2 donor spleens
contained a significantly higher proportion of cells with a
CD4+
CD44+
CD62L2 effector memory phenotype than those
derived from WT spleens. Interestingly, the data also show that even in mice of three weeks of age, before the development of
colitic symptoms, splenic CD4+T cells contain significantly higher
proportions of effector memory cells (Fig. 4). Five to seven weeks after T cell transfer, mice receiving WT-Teff cells did not develop disease, irrespective of the presence or absence of Treg from either donor. These mice were observed up to 15 or 29 weeks after transfer and did not develop colitis within this time frame (Fig. 5). This is consistent with previous studies demonstrating that, in contrast to the SCID or RAG transfer models on backgrounds
other than 129SvEv, in which naı¨ve wild type CD45RBhiT cells
induce colitis upon transfer [21], RAG2/2 mice on a 129SvEv
background, are resistant to colitis induction by wild type cells in
the absence ofH. hepaticusinfection [23].
However, the majority of mice (6/8) receiving KO-Teff cells alone in two separate experiments developed clinical signs of disease (Fig. 5). Co-transfer of KO-Treg or WT-Treg at a 4:1 Teff:Treg
ratio at 46105had little effect on induction of pathology (5/6 and
4/4, respectively, developing colitis). Thus, the KO-Teff cells were highly pathogenic and the pathology induced was unaffected by
co-transfer of Treg from either WT or Gai22/2mice.
Treg from Gai22/2mice are fully functional in vitro
The apparent insufficient regulatory function demonstrated in the in vivo cell transfer model of colitis raises questions regarding
the inherent function of the Treg population in the Gai2-deficient
immune system. It has been shown that co-culture of CD4+
CD25+
Treg with CD4+CD252effector T cells (Teff) from wild-type mice
results in inhibition of the proliferative response of CD4+CD252
effectors [28]. We therefore established an in vitro suppression
assay with mixed combinations of Treg and Teff from Gai22/2
and WT mice at different ratios. Regulation of these Teff responses were analyzed in Teff:Treg co-cultures by cell cycle analysis, using CFSE labeling (Fig. 6). It is apparent from the cell division data (Fig. 6A, B, D) that Treg from both WT (WT-Treg)
and Gai22/2mice (KO-Treg) were able to suppress proliferation
of both WT-Teff and KO-Teff, with the former being more readily suppressed (even at 8:1) than KO-Teff which were suppressed less readily; (at a 4:1 ratio) (Fig. 6A–B). Thus, the in vitro suppressive functions of the Treg populations from the two strains of mice were equivalent. However, this again highlights that KO-Teff were more responsive to signaling through CD3, probably reflecting their pathogenic potential. This was confirmed by comparison of proliferation of the Teff populations alone, measured by CFSE cell cycle analysis (Fig. 6C), demonstrating significantly higher percentages of WT Teff undergoing cell division compared to KO Teff.
Finally, an assessment of Teff cytokines produced in these cultures was made. Supernatants of anti-CD3-activated WT Teff
contained relatively low levels of IL-2, IL-4, IL-6, or IFN-cand it
was not possible to define any significant effects on cytokine levels
Figure 5. Treg from colitic Gai22/2mice fail to protect against colitis in a transfer model.Freshly isolated and sorted donor splenic
CD4+CD252Teff cells from colitic Gai22/2mice (KO-Teff) or CD4+CD252effector T cells from WT mice (WT-Teff) were transferred with or without
splenic CD4+ CD25+
Treg from Gai22/2mice with colitis (KO-Treg) or WT CD4+ CD25+
Treg (WT-Treg) at a 4:1 (Teff:Treg) ratio into RAG22/2recipients by i.p. injection. The results are based on three separate experiments.
mediated by either WT-Treg or KO-Treg (Fig. 7). However, significantly higher levels of cytokines were measured in supernatants of cultures containing activated splenic KO-Teff compared to WT-Teff: 2–3-fold higher for IL-2; 20–60-fold higher for IL-4; 10–20-fold higher for IL-6; and up to 130-fold higher for
IFN-c (Fig. 7). It was not possible to define any significant
reductions in effector cytokines attributable to addition of Treg to the co-cultures, although a trend towards reduced cytokine production with increasing amounts of Treg in the cultures was
noticed. The cytokines IL-10, IL-17 and TNF-a were below the
detection limit of our assay.
Discussion
Both nTreg and iTreg play a critical role in maintenance of peripheral tolerance by suppressing potential autoimmune re-sponses, while simultaneously regulating inflammatory responses to microbes. Our experiments show that FoxP3-expressing Treg in
Gai22/2mice are restricted to the CD4+subpopulation and that
these CD4+
FoxP3+
T cells are found in higher frequencies in the
thymus and colon of colitic Gai22/2mice.
The high frequency of CD4+
FoxP3+
thymocytes is consistent
with the Gai2 deficient mice having abnormal thymocyte
Figure 6. Treg from Gai22/2mice are fully functionalin vitro, but KO-Teff are less readily suppressed than WT-Teff.CD4+CD252
effector T cells (Teff) and CD4+CD25+regulatory T cells (Treg) were sorted from the spleen of 5 to 8 weeks old colitic Gai22/2mice and from
age-matched WT littermates, respectively. These effector and regulator cells were mixed at various ratios and in different combinations. CD4+
CD252Teff
cells were pre-stained with CFSE before being added to co-cultures. A–B. In the suppression assay, Gai22/2Treg (KO-Treg) or WT Treg (WT-Treg) were
added at the indicated ratios with either Gai22/2Teff (KO-Teff) or WT Teff (WT-Teff) (56104cells per well). The mixtures of cell populations were
co-cultured with irradiated T cell depleted splenocytes from WT mice as accessory cells (26105cells) and solublea-CD3 mAb for 72 hours. Means
6SEM
of cell divisions in the suppression assay from FACS analysis is shown. The results presented are from 4 independent experiments, where ** = p#0.01 and *** = p#0.001. C. Means6SEM of cell divisions of CFSE WT-Teff and KO-Teff from the wells with Teff only, was analyzed by FACS analysis. The results are based on 4 independent experiments, where *** = p#0.001. D. Representative histograms showing the division of CFSE labeled cells in the absence or presence of KO-Treg or WT-Treg.
doi:10.1371/journal.pone.0025073.g006
Figure 7. Cytokine production in the suppression assay co-cultures.Supernatants were harvested after 48 hours and assayed for IL-2, IL-4, IL-6 and IFN-cby CBA analysis. Means6SEM of cytokine levels from the collected supernatants in two of the triplicate wells are shown. Results presented are from 3 independent experiments, where ** = p#0.01 and *** = p#0.001.
development resulting in an increase in positive selection and
aberrant development of CD4+
CD25+
T regulatory cells [24]. No
differences in intensity of FoxP3 expression by CD4+T cells were
found in the thymus, spleen, MLN and colonic lamina propria of
colitic Gai22/2 mice and age-matched controls, indicating that
the phenotype is consistent in both groups.
In the colon, the proportion of isolated CD4+
cells which expressed FoxP3 increased 2–3-fold, compared to WT mice. This might be expected if these putative Treg are migrating into an established site of inflammation in an attempt to restore homeostasis, a phenomenon that has also been observed in rheumatoid arthritis patients [29]. However, it has been suggested that Treg are generated within special DC-containing structures within the colon in response to infiltration
by pathogenic CD4+
T cells [30], implying either a structural reservoir of Treg precursors within the colon, or a colonic organized lymphoid structure in which Treg may be generated via DC interactions. To examine structural implications, we derived distribution data using immunohistochemistry. These data show that
in the WT mice, the overwhelming majority of colonic FoxP3+Treg,
are indeed associated with organized CLP (and isolated lymphoid follicles (ILF)) structures. In accordance with our previous
demon-stration of regression of Peyer’s patches in Gai22/2mice prior to
colitis [2], CLP and ILF were not observed in inflamed Gai22/2
colons but the numbers of lamina propria CD4+
FoxP3+
cells increased in inflammation, with their frequency within the total
CD4+
population increasing, based on both flow cytometry and immunohistochemistry data. We speculate that CLP represent the
WT equivalent of the minimal DC structures seen in the RAG22/2
transfer model [30] and that they may constitute reservoirs in which Treg either accumulate and/or are generated, although this requires
further investigation. Regardless of this interpretation, CD4+
cells with a Treg phenotype clearly accumulate in significantly increased frequency within the inflamed colonic mucosa.
It is possible that the higher frequency of FoxP3+
cells in the
colonic lamina propria of colitic Gai22/2 mice may be a
consequence of ongoing inflammation, as there was no significant
difference in the frequency of CD4+
FoxP3+
T cells at other
peripheral sites, such as spleen and MLN, between Gai22/2and
WT mice. These findings concur with reports from human disease
- in patients with active IBD, the number of FoxP3+
cells in the affected intestinal mucosa correlates with disease activity [31,32].
Our data show that CD4+
FoxP3+
Treg, in both central and
peripheral lymphoid tissue in colitic Ga´i22/2 mice have a
substantially higher frequency of cells expressing CD103, com-pared to controls. CD103 have been reported to be an activation
marker for Treg [33]. The CD4+
FoxP3+
CD103+
subset expresses
CTLA-4; suppresses T cell proliferationin vitro; and protects mice
from colitis in the severe combined immunodeficient (SCID)
transfer modelin vivo[33]. IntegrinaE(CD103)b7 can therefore be
regarded as a marker for activated regulatory T cells, including those operating at the mucosal barrier. It is possible that in the steady state, Treg efficiently home to lymph nodes, expand and accumulate where cognate antigens are present. This basal level of activity prevents priming of autoreactive T cells and maintains immune homeostasis. However, when this first line of protection fails and barrier breakdown, tissue destruction and inflammation
occur, changes in the local microenvironment enable further activation of T cells into Treg with high expression of CD103, allowing their traffic to affected tissues [34].
We have shown that Treg from colitic Gai22/2mice are as potent
as WT Treg in inhibiting the proliferative response of both WT-Teff
and KO-Teff following polyclonal TCR-mediated stimulationin vitro,
although KO-Teff were less inhibited by either Treg population compared to WT-Teff. The crucial finding of our experiments is that
Gai22/2Treg are fully functional and there is no endogenous Ga
i2-related defect. Nonetheless, these apparently potent Gai22/2Treg,
paradoxically, were only partially protective against colitis in the
RAG22/2 transfer model. However, the protective effect of
Gai22/2Tregin vivowas comparable to WT Treg. On the basis
of thein vitroandin vivodata, we argue that the dysregulated immune
activity in this model is a product of heightened effector cell activity, and not of reduced Treg function, within the colitic lesion.
Our present and previous data by others clearly demonstrate
that T effectors from Gai22/2mice are more pro-inflammatory
[8]. This is presumably a reflection of the phenotype of the cells we
have used as effectors. The Ga´i22/2 Teff population comprised
many more cells with a CD4+CD62L2 CD44+effector memory
phenotype than WT Teff, which are more easily activated to proliferate and less susceptible to regulation by Treg. In addition, IL-6, one of the proinflammatory cytokines secreted at high levels by KO-Teff in this study, has been shown to enhance the resistance of T effector cells to the suppressive effects of Tregs [35,36]. With regard to this possibility, administration of IL-6R
mAb to SCID mice, after transfer of CD45RBhighT cells, confers
protection from colitis [37], and IL-6–deficient mice have been shown to be less susceptible to colitis [38]. Finally, cells with this phenotype can actively suppress the induction of iTreg by cell contact and secreted factor-mediated mechanisms [39]. Even in
young mice, before the age of onset of frank colitis, Ga´i22/2
CD4+T cells are pushed towards this phenotype. It seems likely,
then, that the Ga´i22/2deletion drives the differentiation of CD4+
T cells towards this easily activated, not readily regulated, effector memory phenotype, which proliferate to bacterial antigens in the
Ga´i22/2 colon with a potentially defective epithelial barrier [5],
and actively suppress the induction of appropriate numbers of inducible regulatory T cells [39]. In addition, defective chemokine
receptor signaling within the Gai22/2environment may reduce
the infiltration of effective numbers of Treg.
In conclusion, Gai22/2Treg that are functionally activein vitro
are enriched in the inflamed colon in Gai22/2mice, but are unable
to regulate the highly potent Gai22/2effector T cells, which we
demonstrated to be significantly more resistant to suppression by
either WT or Gai22/2 Treg, compared to WT effector T cells.
Further studies are in progress to investigate the relative kinetics of mucosal Teff and Treg infiltration during pathogenesis.
Author Contributions
Performed the experiments: Y-YG. Analyzed the data: Y-YG PB EH. Wrote the paper: Y-YG PB EH. Contributed methods/protocols/technical supports: SR.
References
1. Hornquist CE, Lu X, Rogers-Fani PM, Rudolph U, Shappell S, et al. (1997) G(alpha)i2-deficient mice with colitis exhibit a local increase in memory CD4+T cells and proinflammatory Th1-type cytokines. J Immunol 158: 1068–1077. 2. Ohman L, Franzen L, Rudolph U, Birnbaumer L, Hornquist EH (2002) Regression
of Peyer’s patches in G alpha i2 deficient mice prior to colitis is associated with reduced expression of Bcl-2 and increased apoptosis. Gut 51: 392–397.
3. Ohman L, Franzen L, Rudolph U, Harriman GR, Hultgren Hornquist E (2000) Immune activation in the intestinal mucosa before the onset of colitis in Galphai2-deficient mice. Scand J Immunol 52: 80–90.
5. Saha C, Nigam SK, Denker BM (1998) Involvement of Galphai2 in the maintenance and biogenesis of epithelial cell tight junctions. J Biol Chem 273: 21629–21633.
6. He J, Gurunathan S, Iwasaki A, Ash-Shaheed B, Kelsall BL (2000) Primary role for Gi protein signaling in the regulation of interleukin 12 production and the induction of T helper cell type 1 responses. J Exp Med 191: 1605–1610. 7. Elgbratt K, Bjursten M, Willen R, Bland PW, Hornquist EH (2007) Aberrant
T-cell ontogeny and defective thymocyte and colonic T-T-cell chemotactic migration in colitis-prone Galphai2-deficient mice. Immunology 122: 199–209. 8. Huang TT, Zong Y, Dalwadi H, Chung C, Miceli MC, et al. (2003)
TCR-mediated hyper-responsiveness of autoimmune Galphai2(2/2) mice is an intrinsic naive CD4(+) T cell disorder selective for the Galphai2 subunit. Int Immunol 15: 1359–1367.
9. Hultgren OH, Berglund M, Bjursten M, Hultgren Hornquist E (2006) Serum interleukin-1 receptor antagonist is an early indicator of colitis onset in Galphai2-deficient mice. World J Gastroenterol 12: 621–624.
10. Faria AM, Weiner HL (2005) Oral tolerance. Immunol Rev 206: 232–259. 11. Mackay IR (2000) Science, medicine, and the future: Tolerance and
autoimmunity. BMJ 321: 93–96.
12. Groux H, O’Garra A, Bigler M, Rouleau M, Antonenko S, et al. (1997) A CD4+
T-cell subset inhibits antigen-specific T-cell responses and prevents colitis. Nature 389: 737–742.
13. Weiner HL (2001) Induction and mechanism of action of transforming growth factor-beta-secreting Th3 regulatory cells. Immunol Rev 182: 207–214. 14. Vignali DA, Collison LW, Workman CJ (2008) How regulatory T cells work.
Nat Rev Immunol 8: 523–532.
15. Sakaguchi S, Wing K, Onishi Y, Prieto-Martin P, Yamaguchi T (2009) Regulatory T cells: how do they suppress immune responses? Int Immunol 21: 1105–1111.
16. Khattri R, Cox T, Yasayko SA, Ramsdell F (2003) An essential role for Scurfin in CD4+CD25+T regulatory cells. Nat Immunol 4: 337–342.
17. Hori S, Nomura T, Sakaguchi S (2003) Control of regulatory T cell development by the transcription factor Foxp3. Science 299: 1057–1061.
18. Fontenot JD, Gavin MA, Rudensky AY (2003) Foxp3 programs the development and function of CD4+CD25+regulatory T cells. Nat Immunol 4: 330–336.
19. Gambineri E, Torgerson TR, Ochs HD (2003) Immune dysregulation, polyendocrinopathy, enteropathy, and X-linked inheritance (IPEX), a syndrome of systemic autoimmunity caused by mutations of FOXP3, a critical regulator of T-cell homeostasis. Curr Opin Rheumatol 15: 430–435.
20. Singh B, Read S, Asseman C, Malmstrom V, Mottet C, et al. (2001) Control of intestinal inflammation by regulatory T cells. Immunol Rev 182: 190–200. 21. Izcue A, Coombes JL, Powrie F (2009) Regulatory lymphocytes and intestinal
inflammation. Annu Rev Immunol 27: 313–338.
22. Larsson AE, Melgar S, Rehnstrom E, Michaelsson E, Svensson L, et al. (2006) Magnetic resonance imaging of experimental mouse colitis and association with inflammatory activity. Inflamm Bowel Dis 12: 478–485.
23. Maloy KJ, Salaun L, Cahill R, Dougan G, Saunders NJ, et al. (2003) CD4+CD25+T(R) cells suppress innate immune pathology through cytokine-dependent mechanisms. J Exp Med 197: 111–119.
24. Zhang Y, Finegold MJ, Jin Y, Wu MX (2005) Accelerated transition from the double-positive to single-positive thymocytes in G alpha i2-deficient mice. Int Immunol 17: 233–243.
25. Cepek KL, Shaw SK, Parker CM, Russell GJ, Morrow JS, et al. (1994) Adhesion between epithelial cells and T lymphocytes mediated by E-cadherin and the alpha E beta 7 integrin. Nature 372: 190–193.
26. Karecla PI, Bowden SJ, Green SJ, Kilshaw PJ (1995) Recognition of E-cadherin on epithelial cells by the mucosal T cell integrin alpha M290 beta 7 (alpha E beta 7). Eur J Immunol 25: 852–856.
27. Simonetta F, Chiali A, Cordier C, Urrutia A, Girault I, et al. (2010) Increased CD127 expression on activated FOXP3+CD4+ regulatory T cells. Eur J Immunol 40: 2528–2538.
28. Thornton AM, Donovan EE, Piccirillo CA, Shevach EM (2004) Cutting edge: IL-2 is critically required for the in vitro activation of CD4+CD25+T cell suppressor function. J Immunol 172: 6519–6523.
29. Leipe J, Skapenko A, Lipsky PE, Schulze-Koops H (2005) Regulatory T cells in rheumatoid arthritis. Arthritis Res Ther 7: 93.
30. Leithauser F, Meinhardt-Krajina T, Fink K, Wotschke B, Moller P, et al. (2006) Foxp3-expressing CD103+ regulatory T cells accumulate in dendritic cell aggregates of the colonic mucosa in murine transfer colitis. Am J Pathol 168: 1898–1909.
31. Holtta V KP, Sipponen T, Westerholm-Ormio M, Kociubinski G, Salo H, et al. (2008) IL-23/IL-17 immunity as a hallmark of Crohn’s disease. Inflamm Bowel Dis 14: 1175–1184.
32. Maul J, Loddenkemper C, Mundt P, Berg E, Giese T, et al. (2005) Peripheral and intestinal regulatory CD4+CD25(high) T cells in inflammatory bowel disease. Gastroenterology 128: 1868–1878.
33. Lehmann J, Huehn J, de la Rosa M, Maszyna F, Kretschmer U, et al. (2002) Expression of the integrin alpha Ebeta 7 identifies unique subsets of CD25+as well as CD252regulatory T cells. Proc Natl Acad Sci U S A 99: 13031–13036. 34. Bluestone JA, Tang Q (2005) How do CD4+CD25+regulatory T cells control
autoimmunity? Curr Opin Immunol 17: 638–642.
35. Goodman WA, Levine AD, Massari JV, Sugiyama H, McCormick TS, et al. (2009) IL-6 signaling in psoriasis prevents immune suppression by regulatory T cells. J Immunol 183: 3170–3176.
36. Pasare C, Medzhitov R (2003) Toll pathway-dependent blockade of CD4+CD25+T cell-mediated suppression by dendritic cells. Science 299: 1033–1036.
37. Yamamoto M, Yoshizaki K, Kishimoto T, Ito H (2000) IL-6 is required for the development of Th1 cell-mediated murine colitis. J Immunol 164: 4878–4882. 38. Suzuki A, Hanada T, Mitsuyama K, Yoshida T, Kamizono S, et al. (2001)
CIS3/SOCS3/SSI3 plays a negative regulatory role in STAT3 activation and intestinal inflammation. J Exp Med 193: 471–481.