www.atmos-chem-phys.net/15/13475/2015/ doi:10.5194/acp-15-13475-2015
© Author(s) 2015. CC Attribution 3.0 License.
Insights into the growth of newly formed particles in a subtropical
urban environment
F. Salimi1,a, L. R. Crilley1,b, S. Stevanovic1, Z. Ristovski1, M. Mazaheri1, C. He1, G. Johnson1, G. Ayoko1, and L. Morawska1
1International Laboratory for Air Quality and Health, Queensland University of Technology, GPO Box 2434,
Brisbane QLD, 4001, Australia
anow at: Menzies Research Institute, University of Tasmania, Hobart, Tasmania, Australia
bnow at: School of Geography, Earth and Environmental Science, University of Birmingham, Edgbaston,
Birmingham, B15 2TT, UK
Correspondence to:L. Morawska (l.morawska@qut.edu.au)
Received: 3 September 2014 – Published in Atmos. Chem. Phys. Discuss.: 11 November 2014 Revised: 11 November 2015 – Accepted: 17 November 2015 – Published: 7 December 2015
Abstract.The role of different chemical compounds, partic-ularly organics, involved in the new particle formation (NPF) and its consequent growth are not fully understood. There-fore, this study was conducted to investigate the chemical composition of aerosol particles during NPF events in an urban subtropical environment. Aerosol chemical composi-tion was measured along with particle number size distri-bution (PNSD) and several other air quality parameters at five sites across an urban subtropical environment. An Aero-dyne compact Time-of-Flight Aerosol Mass Spectrometer (c-ToF-AMS) and a TSI Scanning Mobility Particle Sizer (SMPS) measured aerosol chemical composition (particles above 50 nm in vacuum aerodynamic diameter) and PNSD (particles within 9–414 nm in mobility diameter), respec-tively. Five NPF events, with growth rates in the range 3.3– 4.6 nm, were detected at two of the sites. The NPF events happened on relatively warmer days with lower condensa-tion sink (CS). Temporal percent fraccondensa-tions of organics in-creased after the particles grew enough to have a signifi-cant contribution to particle volume, while the mass frac-tion of ammonium and sulfate decreased. This uncovered the important role of organics in the growth of newly formed particles. Three organic markers, factors f43, f44 and f57,
were calculated and the f44 vs. f43 trends were compared
between nucleation and non-nucleation days. K-means clus-ter analysis was performed on f44 vs.f43 data and it was
found that they follow different patterns on nucleation days compared to non-nucleation days, wherebyf43decreased for
vehicle-emission-generated particles, while bothf44andf43
decreased for NPF-generated particles. It was found for the first time that vehicle-generated and newly formed particles cluster in different locations onf44vs.f43plot, and this
find-ing can be potentially used as a tool for source apportionment of measured particles.
1 Introduction
mor-tality and morbidity (Donaldson et al., 2002; WHO, 2005; Ning et al., 2003).
Over the past years, the traditional view of the NPF has evolved in light of the recent breakthroughs in this field. The main findings leading to the current understanding of NPF events were observations and theoretical prediction of molecular clusters and their size-dependent growth via nano-Kohler-type processes (Kulmala et al., 2007, 2013, 2004). It is now understood that this process includes the follow-ing steps: (I) production of low and extremely low volatile vapours as a result of chemical reaction in the gas phase; (II) clustering; (III) nucleation; (IV) activation of clusters by a different group of vapours; and (V) multicomponent con-densation growth of the activated clusters (Ehn et al., 2014; Riccobono et al., 2014; Kulmala et al., 2014a, b).
The chemical composition of UFPs during NPF events in urban environments have been investigated in only a handful of studies as it was thought that these events tend to hap-pen more in pristine air. However, NPF events have been observed frequently in Brisbane, an urban area in eastern Australia, and were associated with precursors emitted from traffic and solar radiation (Cheung et al., 2010). Cheung et al. (2010) characterised the evolution of particle number size distribution (PNSD) in Brisbane and found 65 nucleation events over a 1-year period, with an average particle growth rate of 4.6 (nm h−1). Leigh et al. (2014) found ammonium
and sulfate as the dominant species on particle formation days in a short-term study based on measurements at a fixed site. More studies need to be carried out, particularly in less investigated areas, using direct measurement techniques, and including comprehensive and advanced analysis, in order to determine the species involved in NPF events and the nature of their contribution. To address this gap in knowledge, the main aim of this study was to determine the role of chemical species in NPF events growth process in a subtropical urban environment.
2 Materials and methods 2.1 Background
This study was performed as part of the “Ultrafine Parti-cles from Traffic Emissions and Children’s Health” project (UPTECH; Salimi et al., 2013). Air quality measurements were conducted for two consecutive weeks at each of 25 sites across the Brisbane Metropolitan Area, in Australia, during the period October 2010 to August 2012. Chemical compo-sition of the aerosol particles was monitored in real time at five sites, referred to as s1, s4, s11, s12 and s25.
2.2 Instrumentation
Meteorological parameters including wind speed/direction, relative humidity and solar radiation were measured using a “Monitor Sensor” weather station. A TSI Scanning Mobility
Particle Sizer (SMPS) measured PNSD within the size range 9–414 nm. The SMPS system consisted of a TSI 3071 Differ-ential Mobility Analyser (DMA) and a TSI 3782 water-based Condensation Particle Counter (CPC). Particle size detection accuracy of the SMPS system was calibrated at the start of measurements at each site using polystyrene latex (PSL) par-ticles. In addition, the system sheath and aerosol flow rate were checked every second day. The measured PNSD data were corrected for diffusion loss inside the system and sam-pling tube. Further information regarding the SMPS’s oper-ating conditions and calibration can be found in Salimi et al. (2014). An Aerodyne compact Time-of-Flight Aerosol Mass Spectrometer (c-ToF-AMS) was deployed to monitor the chemical composition of aerosol particles in the PM1
fraction in real time. A detailed description of the sampling method and c-ToF-AMS operation can be found in Crilley et al. (2013). Briefly, the c-ToF-AMS was housed in a va-cant room at each site and sampled for 2–3 weeks. The sam-pling interval was 5 min, alternating equally between parti-cle time of flight and mass spectrometer modes. The instru-ment was calibrated for both ion efficiency and particle size at the beginning of measurements at each site, and ion effi-ciency calibration was also performed in the middle and at the end of measurement campaigns at each site. All calibra-tions were performed according to the standard procedures proposed in the literature (Drewnick et al., 2005; Jayne et al., 2000; Jimenez et al., 2003c). Solar radiation and other mete-orological parameters were measured by a Monitor Sensors µ Smart Series weather station, a TSI 3781 water-based CPC was used for particle number concentration (PNC) measure-ments, and a TSI DustTrak measured particle mass concen-tration (PM2.5and PM10).
2.3 Data analysis
Characterisation of new particle formation events: NPF events were identified and classified using the procedure de-veloped by Dal Maso et al. (2005). PNSD data were analysed to identify a distinct new mode of particles in the nucleation mode size range (particles with diameter less than 30 nm). If the mode grew in size and was persistent for more than 1 h, it was assigned as a NPF event. Once identified, the growth rates of the nucleation events were calculated following the procedure described in Creamean et al. (2011).
2.3.1 Condensation sink
cal-culated using the following formula (Lehtinen et al., 2003):
CS=2π D
∞
Z
0
dpβM(dp)n(dp)ddp=2π D
βMiXdp,iNi
i
, (1)
whereDis the diffusion coefficient,dpis the particle
diam-eter,Ni is the concentration of particles andβM can be ex-pressed as (Fuks et al., 1971)
βM=
Kn+1
0.377Kn+1+4
3α−1Kn2+ 4 3α−1Kn
, (2)
where αis the sticking coefficient and is assumed to be 1 (Clement et al., 1996) andKnis the Knudsen number, which is equal to2λv
dp . The mean free path (λv)is a function of
pres-sure and temperature and can be calculated using the follow-ing formula (Willeke, 1976):
λv=λo( 101
p )( T
296.2)(
(1+ 110 296.2)
(1+110
T )
), (3)
whereP is in kPa andT in kelvin.λo=0.039 µm, which is the mean free path of H2SO4at standard conditions (Bae et
al., 2010). CSs were calculated using the above-mentioned procedure on the PNSD data.
2.3.2 Particle size
Due to the difference in detection limit between the two instruments (Dva=50 nm for AMS and Dm= 10 nm for
SMPS), measurement of the mass distribution for the small-est particles detected during each nucleation was delayed for the AMS in order for particles to grow to the detectable size. Ratio of mobility diameter (Dm), measured by the SMPS,
to vacuum aerodynamic diameter (Dva)is a function of size,
composition, shape and relative humidity for ambient par-ticles. This ratio can be simplified to be equal to parti-cle density, assuming that partiparti-cles are spherical (Jimenez et al., 2003a). The newly formed particles were assumed to have the density of around 1.8 g cm−3 and, therefore,
Dm/Dva=1.8 for newly formed particles (Zhang et al.,
2004). Therefore, the AMS’s lowest detection limit will be equivalent to aDm=30 nm.
2.3.3 Particle chemical composition
Concentrations of sulfate, nitrate, organics and ammonium were measured by a c-ToF-AMS, as these have been iden-tified as the main contributing species to the NPF events and subsequent particulate growth in literature (Zhang et al., 2004). These data were processed and analysed using Squir-rel v1.51 in Igor Pro v6.22. The organic aerosol (OA) can be divided into oxygenated OA (OOA) and hydrocarbon-like OA (HOA), based upon key m/z ions that have been shown to be surrogates for the different components. OOA
can be separated further into low-volatility OOA (LV-OOA) and semi-volatile (SV-OOA). Two main ions,m/z44 (CO+
2)
andm/z43 (mostly C2H3O+), can characterise the
evolu-tion of OA in the atmosphere (Ng et al., 2010b). The ratios ofm/z44 andm/z 43 to total organic signal (f44 andf43,
respectively) indicate the degree of oxidation of OA, since the SV-OOA component spectra have a lowerf44and higher
f43compared to LV-OOA. OA has been shown to occupy a
triangular region of thef44vs.f43plot with younger OA
oc-cupying the lower part of the triangle, while more oxidised and subsequently more aged OAs are concentrated in the up-per part (Ng et al., 2010b, 2011). Therefore,f43andf44were
calculated and plotted against each other to determine the type and evolution of OA during NPF events.m/z 57 ions have been shown to be a tracer of HOA (primary organics from combustion sources) (Ng et al., 2010a), and therefore
f57was calculated to investigate the OA that originated from
vehicle emissions.
2.3.4 LOESS smoothing
In order to better understand the trends and patterns of the data, LOESS technique as a locally weighted polynomial regression smoothing method was selected and applied to the data. The resulting smooth functions, and their 95 % confidence intervals, indicate the trends of the relevant data throughout the paper (Cleveland and Devlin, 1988).
2.3.5 K-means clustering
This clustering algorithm minimises the within-cluster sum of squares in order to divideMobservations withN dimen-sions into K clusters (Hartigan and Wong, 1979). A common method of choosing the number of clusters is to compare vi-sually a measure of error, such as sum of squared error (SSE), with sequential number of clusters by plotting the measure of error onyaxis and the number of clusters onxaxis (Everitt et al., 2010). Optimum number of clusters is the point at which the measure of error flattens and forms an elbow. The above-mentioned clustering technique was applied to thef44 and
f43to assess the possible clustering for days with and
with-out nucleation.
3 Results and discussion
3.1 Identified new particle formations
Table 1.Duration of each nucleation event as well as their average growth rates. Growth rates were calculated by a linear fit from 9 to 20 nm.
Site Start of event End of event Growth rate
(nm h−1)
s12 12/08/2011, 11:00 13/08/2011, 05:00 3.9
s12 13/08/2011, 12:30 14/08/2011, 06:20 4.6
s12 14/08/2011, 15:20 15/08/2011, 06:00 3.3
s25 25/08/2012, 12:24 26/08/2012, 02:14 4.3
s25 26/08/2012, 12:00 27/08/2012, 01:00 3.8
Figure 1 summarises the average solar radiation, rela-tive humidity, temperature and CS calculated using LOESS method for days with NPF events (nucleation days), as well as for the days where no NPF events were observed (non-nucleation days) at s12 and s25. Nucleation days had higher solar radiation intensity compared to non-nucleation days at s25 while opposite trend was observed at s12. Nucleation days had a slightly higher temperature compared to non-nucleation days at both sites. Higher relative humidity was observed on nucleation days compared to non-nucleation days at s12, whereas opposite trend was observed at S25. The wind speed and direction have not been plotted as they did not show a typical trend during the nucleation and non-nucleation days. CS was found to be lower on non-nucleation days compared to non-nucleation days, about 2 h before the start of nucleation at both sites. Similar trends have been ob-served in other studies (Salma et al., 2011; Hussein et al., 2008). CS is a measure of the available surface area for con-densation of vapours, as well as for the scavenging of particle clusters. A small CS is favourable for nucleation as it pro-duces less surface area for vapours and newly formed clus-ters, in agreement with the observations in Fig. 1.
Figure 2 illustrates the average mass concentration of or-ganics, nitrate, sulfate and ammonium during nucleation and non-nucleation days at s12 and s25. Mass concentration of organics and nitrate followed relatively the same trend through the day until 16:00–17:00 AEST (6–7 h after the start of the NPF event) at s12 and s25.
However, mass concentration of organics and nitrate in-creased dramatically between 15:00 and 22:00 on nucleation days, at higher rate compared to non-nucleation days at s12, and the same trend was observed at s25, with an hour de-lay in the increase of the mass concentration of organics and nitrate. At s25, sulfate and ammonium mass concentration started to increase at 12:00, reached a peak and decreased subsequently; however, a significant increase was observed around 16:00. s12 s25 25 50 75 0 250 500 750 1000 5 10 15 20 25 0.0 0.1 0.2 0.3 0.4 0.5 Humidity ( % ) SR ( W.m 2 ) Temperature ( ° C ) CS ( s − 1 )
0 4 8 12 16 20 0 4 8 12 16 20
h
Nucleation No
Yes
Figure 1.Average diurnal pattern of solar radiation (SR), humidity, temperature and condensation sink (CS) as well as the measured data on nucleation and non-nucleation day at s12 and s25. Shaded areas represent the 95 % confidence interval in the mean. Data in-clude 5 and 51 nucleation and non-nucleation days respectively.
s12 s25 0 5 10 15 20 0.0 0.5 1.0 1.5 0.0 0.5 1.0 1.5 2.0 0.0 0.5 1.0 Organics ( µ g.m − 3 ) NO 3 ( µ g.m − 3 ) SO 4 ( µ g.m − 3 ) NH 4 ( µ g.m − 3 )
0 4 8 12 16 20 0 4 8 12 16 20
h
Nucleation No
Yes
Figure 2.Average diurnal pattern of organics, nitrate, sulfate and ammonium concentrations as well as the measured data on nucle-ation and non-nuclenucle-ation days at s12 and S25. Shaded areas repre-sent the 95 % confidence interval in the mean. Data include 5 and 51 nucleation and non-nucleation days respectively.
3.2 Evolution of chemical composition of newly formed particles
The analysis and interpretation of the chemical composition of the newly formed particles focuses mostly on the parti-cles in the growth phase due to the lowest detection limit of the c-ToF-AMS, which does not permit seeing them in the formation phase. Particle volume distribution (PVD) was calculated from the PNSD data as it is a better measure for comparison with the mass.
par-2011−08−12 2011−08−13 2011−08−14
10 20 50 100 200 400
01 03 05 07 09 11 13 15 17 19 21 23 01 03 05 07 09 11 13 15 17 19 21 23 01 03 05 07 09 11 13 15 17 19 21 23
Diameter (nm)
0 10000 20000 30000 dN/dLogDp(cm−3)
2011−08−12 2011−08−13 2011−08−14
10 20 50 100 200 400
01 03 05 07 09 11 13 15 17 19 21 23 01 03 05 07 09 11 13 15 17 19 21 23 01 03 05 07 09 11 13 15 17 19 21 23
Diameter (nm)
0.0 2.5 5.0 7.5 10.0 dV/dLogDp(µm3/cm3)
2011−08−12 2011−08−13 2011−08−14
0.1 1.0 10.0
01 03 05 07 09 11 13 15 17 19 21 23 01 03 05 07 09 11 13 15 17 19 21 23 01 03 05 07 09 11 13 15 17 19 21 23
Concentr
ation (
µ
g/
m
3)
Component
Organics Nitrate
Sulfate Ammonium
2011−08−12 2011−08−13 2011−08−14
0 25 50 75
01 03 05 07 09 11 13 15 17 19 21 23 01 03 05 07 09 11 13 15 17 19 21 23 01 03 05 07 09 11 13 15 17 19 21 23 Time (h)
Mass fr
action (%)
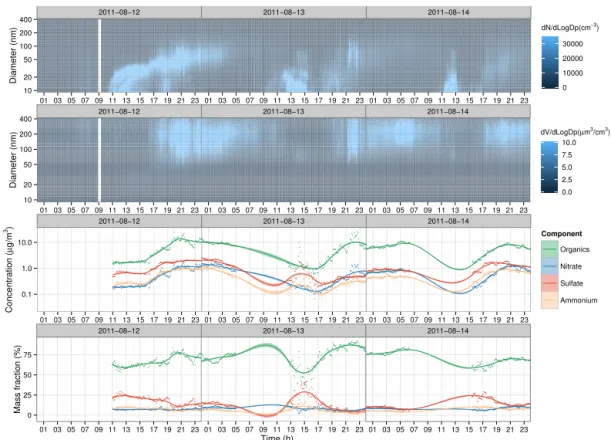
Figure 3.Time series of the particle number/volume size distributions (top two graphs) and mass concentration of particle species and their fraction to the total (bottom two graphs) at s12. Solid lines are calculated using LOESS smoothing technique, and the shaded areas represent the 95 % confidence interval.
ticulate growth are sulfate, nitrate, organics and ammonium (Zhang et al., 2004). Therefore, the percent fractions of each of these chemical species were calculated by dividing the mass concentration of each chemical species by the total (sul-fate+nitrate+ammonium+organics).
Figure 3 illustrates the evolution of PNSD, PVD, and mass concentration of chemical species (organics, nitrate, sulfate and ammonium) during the three consecutive NPF events at s12. In general, mass concentration of the aerosol species followed the evolution of particle volume distribu-tion as expected. Ammonium, sulfate and nitrate mass frac-tions peaked just before the particle volumes increase due to the growth of newly formed particles. However, organic mass fraction followed the opposite trend, with a significant rise after the increase in particles volume due to the growth of new particles. In other words, the fraction of organics in-creased and the fraction of ammonium, sulfate and nitrate decreased when the newly formed particles grew enough to dominate the particle volume. This shows the import contri-bution of organics to the growth of newly formed particles.
Time series of PNSD and mass concentration of particle species during two NPF events happening on two consecu-tive days at s25 are illustrated in Fig. 4. The mass concen-trations of the chemical species and their fractions followed similar trends as the ones at s12. At s12, the magnitude of
mass fractions changed from almost 50, 30, 10 and 10 % be-fore the nucleation to 70, 20, 6 and 4 % after the event for or-ganics, sulfate, ammonium and nitrate respectively. At s25, the changes in mass fractions were more dramatic as they changed from 40, 25, 25 and 10 % before the event to 85, 5, 5 and 5 % after the nucleation occurred.
3.3 Role of organics
As indicated in the previous section, five NPF events were observed at s12 and the contribution of organics to the growth of newly formed particles was high; therefore, further data analyses regarding the role of organics were performed. Firstly,f43 andf44 were calculated for the total chemical
mass data on nucleation days and non-nucleation days.f44
was plotted againstf43at each hour of the day, as well as the
triangle space proposed by Ng et al. (2010b) (Fig. 5). Dur-ing the non-nucleation days, the OA was concentrated in the middle and right border of the triangular region, which is the beginning of the LV-OOA region. As expected, thef44
de-creased during morning and afternoon rush hours, as the par-ticles were younger and less oxidised, whilef43 remained
almost unchanged during the day.
2012−08−25 2012−08−26
10 20 50 100 200 400
01 03 05 07 09 11 13 15 17 19 21 23 01 03 05 07 09 11 13 15 17 19 21 23
Diameter (nm)
0 10000 20000 30000 dN/dLogDp(cm−3)
2012−08−25 2012−08−26
10 20 50 100 200 400
01 03 05 07 09 11 13 15 17 19 21 23 01 03 05 07 09 11 13 15 17 19 21 23
Diameter (nm)
0.0 2.5 5.0 7.5 10.0 dV/dLogDp(µm3/cm3)
2012−08−25 2012−08−26
0.1 10.0
01 03 05 07 09 11 13 15 17 19 21 23 01 03 05 07 09 11 13 15 17 19 21 23
Concentr
ation (
µ
g/
m
3)
Component
Organics Nitrate
Sulfate Ammonium
2012−08−25 2012−08−26
0 25 50 75
01 03 05 07 09 11 13 15 17 19 21 23 01 03 05 07 09 11 13 15 17 19 21 23 Time (h)
Mass fr
action (%)
Figure 4.Time series of the particle number/volume size distributions (top two graphs) and mass concentration of particle species and their fraction to the total (bottom two graphs) at s25. Solid lines are calculated using LOESS smoothing technique, and the shaded areas represent the 95 % confidence interval.
and the aerosol components reached the bottom left side of the triangular region. It is expected that the particles orig-inating from nucleation events cluster somewhere at top of the triangle; however, as the particles measured in our study originated from nucleation events and primary vehicle emis-sions, they clustered at the middle left-hand side of the tri-angle. The above-mentioned visual inspection of the figure revealed potential clustering on the graph during nucleation and non-nucleation days.
In order to assess the possible different clustering of f44
vs.f43for nucleation days compared to non-nucleation days,
K-means clustering technique was applied on thef43andf44
data. A period between 15:00 and 17:00 was selected for this purpose as this was the initial stage where the newly formed particles grew enough to have significant contribution to the total signal. In order to find the optimum number of clusters, SSE was plotted against the sequential number of clusters; five was the number of clusters found to be appropriate as it was located at the elbow in the plot (Fig. 6).
The five identified clusters as well as their 95 % confidence ellipse are illustrated in Fig. 7a; 93 % of the data measured in nucleation days were in clusters 3–5 (54, 15 and 24 % in clus-ters 3, 4 and 5 respectively) while clusclus-ters 1 and 2 contained 77 % of the data measured in non-nucleation days (Fig. 7). In addition, cluster 1 and 5 contained less than 1 % of nucleation
and non-nucleation days respectively. These show a distinct clustering onf44 vs. f43 for nucleation days compared to
non-nucleation days and indicate a potential application of
f44vs.f43 plot for identification of the newly formed
parti-cles.
It has been reported in the literature that f57 is
asso-ciated with combustion-generated primary organics (Cana-garatna et al., 2004; Jimenez et al., 2003b).f57 was
calcu-lated and its diurnal variation was modelled using a LOESS smoothing model. The measured data and their smoothed av-erage showed that f57 followed exactly the same trend on
nucleation and non-nucleation days, with an increase dur-ing the morndur-ing and afternoon rush hours (Fig. 8). All non-nucleation days did not have exactly the same meteorological conditions, but the effects of their variation onf57were
min-imal.
4 Summary and conclusions
In summary, PNSD, chemical composition and meteorolog-ical parameters were measured at five sites across the Bris-bane Metropolitan Area. Five NPF events, with growth rates ranging from 3.3 to 4.6 nm h−1, were observed at two of the
0 1 2 3 4
5 6 7 8 9
10 11 12 13 14
15 16 17 18 19
20 21 22 23
0.0 0.1 0.2 0.3
0.0 0.1 0.2 0.3
0.0 0.1 0.2 0.3
0.0 0.1 0.2 0.3
0.0 0.1 0.2 0.3
0.05 0.10 0.15 0.05 0.10 0.15 0.05 0.10 0.15 0.05 0.10 0.15
f43
f44
Nucleation
No
Yes
0.00 0.25 0.50 0.75
1 2 3 4 5 6 7 8 9 10 11 12 13 14 15
Number of clusters
SSE
Figure 6.SSE versus the number of clusters. The sharp decrease in SSE stops at five clusters forming an elbow.
0.0 0.1 0.2 0.3
0.02 0.04 0.06 0.08 0.10
f43
f44
Nucleation
No
Yes
Cluster
1
2
3
4
5
(a)
34% 33% 13% 19%
1%7% 54% 15% 24%
No Yes
0 25 50 75 100
Fraction (%)
Nucleation
Cluster
1
2
3
4
5
(b)
Figure 7. The f44 vs. f43 plot for nucleation days and non-nucleation days with the five clusters and their 95 % confidence
ep-silon (a). The contributing proportion of each cluster to the total
for nucleation and non-nucleation days(b). The triangle from Ng et
al. (2010b) is drawn as a visual aid.
0.00 0.01 0.02 0.03 0.04
0 5 10 15 20
h f57
Nucleation
No
Yes
Figure 8.Diurnal variation of thef57 during the nucleation and non-nucleation days. Solid lines have been calculated using the LOESS smoothing method, and the shaded areas represent the 95 % confidence interval. Data include 5 and 51 nucleation and non-nucleation days. The data include weekdays and weekend as no exclusions were applied to increase the statistical power.
fate, nitrate, ammonium and organics were observed on nu-cleation days compared with days when no nunu-cleation was observed. Percent fractions of nitrate, sulfate, ammonium and organic chemical species were calculated and their diur-nal trends were modelled using LOESS. Ammonium, sulfate and nitrate mass fractions increased before the newly formed particles grew enough to have a significant contribution to the particle volume, peaked around that time and decreased after that. Conversely, the organics percent fraction increased sig-nificantly after the contribution of new particles to total vol-ume, indicating the important role of organics in the growth phase of NPF events.f44 andf43 were analysed to
inves-tigate the role of organics more in depth, as thef44 vs.f43
would reveal information regarding the level of oxidation and volatility of OOA.f43andf44both decreased after the start
of nucleation, whilef44 decreased only in case of particles
generated from vehicle emission. K-means clustering anal-ysis revealed that the aerosol particles generated by vehicle emissions and NPF events clustered in different locations on thef44vs.f43plot. This determined the potential application
of thef44vsf43 plot for identification of the source(s) and
transformation of the OOA components as they clearly fol-lowed different patterns. However, it should be noted that the analyses were based on only five NPF events and the results may not be a general rule.
Acknowledgements. This work was supported by the Australian
would also like to thank G. Marks, P. Robinson, K. Mengersen, R. Jayaratne, S. Low Choy, G. Williams, W. Ezz, S. Clifford, M. Mokhtar, N. Mishra, R. Laiman, L. Guo, C. Duchaine, H. Sa-lonen, X. Ling, J. Davies, L. Leontjew Toms, F. Fuoco, A. Cortes, B. Toelle, A. Quinones, P. Kidd and E. Belousova, M. Falk, F. Fatokun, J. Mejia, D. Keogh, T. Salthammer, R. Appleby and C. Labbe for their contribution to the UPTECH project.
Edited by: W. Birmili
References
Bae, M.-S., Schwab, J. J., Hogrefe, O., Frank, B. P., Lala, G. G., and Demerjian, K. L.: Characteristics of size distributions at urban and rural locations in New York, Atmos. Chem. Phys., 10, 4521– 4535, doi:10.5194/acp-10-4521-2010, 2010.
Canagaratna, M. R., Jayne, J. T., Ghertner, D. A., Herndon, S., Shi, Q., Jimenez, J. L., Silva, P. J., Williams, P., Lanni, T., and Drewnick, F.: Chase studies of particulate emissions from in-use New York City vehicles, Aerosol Sci. Tech., 38, 555–573, 2004. Cheung, H. C., Morawska, L., and Ristovski, Z. D.: Observation of new particle formation in subtropical urban environment, At-mos. Chem. Phys., 11, 3823-3833, doi:10.5194/acp-11-3823-2011, 2011.
Clement, C. F., Kulmala, M., and Vesala, T.: Theoretical consid-eration on sticking probabilities, J. Aerosol Sci., 27, 869–882, doi:10.1016/0021-8502(96)00032-8, 1996.
Cleveland, W. S. and Devlin, S. J.: Locally Weighted
Regression: An Approach to Regression Analysis
by Local Fitting, J. Am. Stat. Assoc., 83, 596–610,
doi:10.1080/01621459.1988.10478639, 1988.
Creamean, J. M., Ault, A. P., Ten Hoeve, J. E., Jacobson, M. Z., Roberts, G. C., and Prather, K. A.: Measurements of Aerosol Chemistry during New Particle Formation Events at a Remote Rural Mountain Site, Environ. Sci. Technol., 45, 8208–8216, doi:10.1021/es103692f, 2011.
Crilley, L. R., Ayoko, G. A., Jayaratne, E. R., Salimi, F., and Morawska, L.: Aerosol mass spectrometric analysis of the chem-ical composition of non-refractory PM1 samples from school en-vironments in Brisbane, Australia, Sci. Total Environ., 458–460, 81–89, doi:10.1016/j.scitotenv.2013.04.007, 2013.
Crilley, L. R., Jayaratne, E. R., Ayoko, G. A., Miljevic, B., Ris-tovski, Z., and Morawska, L.: Observations on the Forma-tion, Growth and Chemical Composition of Aerosols in an Urban Environment, Environ. Sci. Technol., 48, 6588–6596, doi:10.1021/es5019509, 2014.
Dal Maso, M., Kulmala, M., Riipinen, I., Wagner, R., Hussein, T., Aalto, P. P., and Lehtinen, K. E. J.: Formation and growth of fresh atmospheric aerosols: eight years of aerosol size distribution data from SMEAR II, Hyytiälä, Finland, Boreal Environ. Res., 10, 323–336, 2005.
Donaldson, K., Brown, D., Clouter, A., Duffin, R., MacNee, W., Renwick, L., Tran, L., and Stone, V.: The pulmonary toxicology of ultrafine particles, J. Aerosol Med., 15, 213–220, 2002. Drewnick, F., Hings, S. S., DeCarlo, P., Jayne, J. T., Gonin, M.,
Fuhrer, K., Weimer, S., Jimenez, J. L., Demerjian, K. L., and Borrmann, S.: A new time-of-flight aerosol mass spectrometer
(TOF-AMS) – Instrument description and first field deployment, Aerosol Sci. Tech., 39, 637–658, 2005.
Ehn, M., Thornton, J. A., Kleist, E., Sipilä, M., Junninen, H., Pulli-nen, I., Springer, M., Rubach, F., Tillmann, R., Lee, B., Lopez-Hilfiker, F., Andres, S., Acir, I. H., Rissanen, M., Jokinen, T., Schobesberger, S., Kangasluoma, J., Kontkanen, J., Nieminen, T., Kurtén, T., Nielsen, L. B., Jørgensen, S., Kjaergaard, H. G., Canagaratna, M., Maso, M. D., Berndt, T., Petäjä, T., Wahner, A., Kerminen, V. M., Kulmala, M., Worsnop, D. R., Wildt, J., and Mentel, T. F.: A large source of low-volatility secondary or-ganic aerosol, Nature, 506, 476–479, 2014.
Everitt, B. S., Landau, S., Leese, M., and Stahl, D.: Cluster Analy-sis, 5 Edn., Wiley, Hoboken, 2010.
Fuks, N., Sutugin, A. G., and Soo, S.: Topics in current aerosol re-search, Pergamon Press, Oxford, 1971.
Hartigan, J. A. and Wong, M. A.: Algorithm AS 136: A K-Means Clustering Algorithm, J. Roy. Stat. Soc. C-App., 28, 100–108, doi:10.2307/2346830, 1979.
Hussein, T., Martikainen, J., Junninen, H., Sogacheva, L., Wag-ner, R., Dal Maso, M., Riipinen, I., Aalto, P. P., and Kulmala, M.: Observation of regional new particle formation in the ur-ban atmosphere, Tellus B, 60, 509–521, doi:10.1111/j.1600-0889.2008.00365.x, 2008.
Jayne, J. T., Leard, D. C., Zhang, X., Davidovits, P., Smith, K. A., Kolb, C. E., and Worsnop, D. R.: Development of an aerosol mass spectrometer for size and composition analysis of submi-cron particles, Aerosol Sci. Tech., 33, 49–70, 2000.
Jimenez, J. L., Bahreini, R., Cocker, D. R., Zhuang, H., Varut-bangkul, V., Flagan, R. C., Seinfeld, J. H., O’Dowd, C. D., and Hoffmann, T.: New particle formation from photooxidation of diiodomethane (CH2I2), J. Geophys. Res.-Atmos., 108, 2156– 2202, doi:10.1029/2002JD002452, 2003a.
Jimenez, J. L., Jayne, J. T., Shi, Q., Kolb, C. E., Worsnop, D. R., Yourshaw, I., Seinfeld, J. H., Flagan, R. C., Zhang, X., and Smith, K. A.: Ambient aerosol sampling using the aero-dyne aerosol mass spectrometer, J. Geophys. Res.-Atmos., 108, doi:10.1029/2001JD001213, 2003b.
Jimenez, J. L., Jayne, J. T., Shi, Q., Kolb, C. E., Worsnop, D. R., Yourshaw, I., Seinfeld, J. H., Flagan, R. C., Zhang, X., Smith, K. A., Morris, J. W., and Davidovits, P.: Ambient aerosol sampling using the Aerodyne Aerosol Mass Spectrometer, J. Geophys. Res.-Atmos., 108, 8425, doi:10.1029/2001JD001213, 2003c. Kulmala, M., Kerminen, V.-M., Anttila, T., Laaksonen, A.,
and O’Dowd, C. D.: Organic aerosol formation via sulphate cluster activation, J. Geophys. Res.-Atmos., 109, D04205, doi:10.1029/2003JD003961, 2004.
Kulmala, M., Riipinen, I., Sipilä, M., Manninen, H. E., Petäjä, T., Junninen, H., Maso, M. D., Mordas, G., Mirme, A., Vana, M., Hirsikko, A., Laakso, L., Harrison, R. M., Hanson, I., Leung, C., Lehtinen, K. E. J., and Kerminen, V.-M.: Toward direct measure-ment of atmospheric nucleation, Science, 318, 89–92, 2007. Kulmala, M., Kontkanen, J., Junninen, H., Lehtipalo, K.,
Manni-nen, H. E., NiemiManni-nen, T., Petäjä, T., Sipilä, M., Schobesberger, S., and Rantala, P.: Direct observations of atmospheric aerosol nucleation, Science, 339, 943–946, 2013.
New Particle Formation, Annu. Rev. Phys. Chem., 65, 21–37, 2014a.
Kulmala, M., Petäjä, T., Ehn, M., Thornton, J., Sipilä, M., Worsnop, D. R., and Kerminen, V. M.: Chemistry of atmospheric nucle-ation: On the recent advances on precursor characterization and atmospheric cluster composition in connection with atmospheric new particle formation, Annu. Rev. Phys. Chem., 65, 21–37, 2014b.
Lehtinen, K. E. J., Korhonen, H., Dal Maso, M., and Kulmala, M.: On the concept of condensation sink diameter, Boreal Environ. Res., 8, 405–411, 2003.
Lohmann, U. and Feichter, J.: Global indirect aerosol effects: a re-view, Atmos. Chem. Phys., 5, 715–737, doi:10.5194/acp-5-715-2005, 2005.
Mejía, J. F. and Morawska, L.: An investigation of nucleation events in a coastal urban environment in the Southern Hemisphere, At-mos. Chem. Phys., 9, 7877–7888, doi:10.5194/acp-9-7877-2009, 2009.
Modini, R. L., Ristovski, Z. D., Johnson, G. R., He, C., Surawski, N., Morawska, L., Suni, T., and Kulmala, M.: New particle for-mation and growth at a remote, sub-tropical coastal location, At-mos. Chem. Phys., 9, 7607–7621, doi:10.5194/acp-9-7607-2009, 2009.
Morawska, L., Wang, H., Ristovski, Z., Jayaratne, E. R., Johnson, G., Cheung, H. C., Ling, X., and He, C.: JEM Spotlight: Environ-mental monitoring of airborne nanoparticles, J. Environ. Moni-tor., 11, 1758–1773, doi:10.1039/B912589M, 2009.
Ng, N., Canagaratna, M., Jimenez, J., Zhang, Q., Ulbrich, I., and Worsnop, D.: Real-time methods for estimating organic compo-nent mass concentrations from aerosol mass spectrometer data, Environ. Sci. Technol., 45, 910–916, 2010a.
Ng, N. L., Canagaratna, M. R., Zhang, Q., Jimenez, J. L., Tian, J., Ulbrich, I. M., Kroll, J. H., Docherty, K. S., Chhabra, P. S., Bahreini, R., Murphy, S. M., Seinfeld, J. H., Hildebrandt, L., Donahue, N. M., DeCarlo, P. F., Lanz, V. A., Prévôt, A. S. H., Dinar, E., Rudich, Y., and Worsnop, D. R.: Organic aerosol components observed in Northern Hemispheric datasets from Aerosol Mass Spectrometry, Atmos. Chem. Phys., 10, 4625– 4641, doi:10.5194/acp-10-4625-2010, 2010b.
Ng, N. L., Canagaratna, M. R., Jimenez, J. L., Chhabra, P. S., Se-infeld, J. H., and Worsnop, D. R.: Changes in organic aerosol composition with aging inferred from aerosol mass spectra, At-mos. Chem. Phys., 11, 6465–6474, doi:10.5194/acp-11-6465-2011, 2011.
Ning, L., Sioutas, C., Cho, A., Schmitz, D., Misra, C., Sempf, J., Meiying, W., Oberley, T., Froines, J., and Nel, A.: Ultrafine Particulate Pollutants Induce Oxidative Stress and Mitochonrial Damage, Environ. Health Persp., 111, 455–460, 2003.
O’Dowd, C. D., Jimenez, J. L., Bahreini, R., Flagan, R. C., Seinfeld, J. H., Hämeri, K., Pirjola, L., Kulmala, M., Jennings, S. G., and Hoffmann, T.: Marine aerosol formation from biogenic iodine emissions, Nature, 417, 632–636, 2002.
Petäjä, T., Kerminen, V.-M., Dal Maso, M., Junninen, H., Ko-ponen, I. K., Hussein, T., Aalto, P. P., Andronopoulos, S., Robin, D., Hämeri, K., Bartzis, J. G., and Kulmala, M.: Sub-micron atmospheric aerosols in the surroundings of Marseille and Athens: physical characterization and new particle forma-tion, Atmos. Chem. Phys., 7, 2705–2720, doi:10.5194/acp-7-2705-2007, 2007.
Pirjola, L., Kulmala, M., Wilck, M., Bischoff, A., Stratmann, F., and Otto, E.: Formation of sulphuric acid aerosols and cloud conden-sation nuclei: an expression for significant nucleation and model comparison, J. Aerosol Sci., 30, 1079–1094, doi:10.1016/S0021-8502(98)00776-9, 1999.
Pope II, C. A. and Dockery, D. W.: Health effects of fine particulate air pollution: lines that connect, Air Waste Manage. Assoc., 56, 709–742, 2006.
Riccobono, F., Schobesberger, S., Scott, C. E., Dommen, J., Ortega, I. K., Rondo, L., Almeida, J., Amorim, A., Bianchi, F., Breiten-lechner, M., David, A., Downard, A., Dunne, E. M., Duplissy, J., Ehrhart, S., Flagan, R. C., Franchin, A., Hansel, A., Junni-nen, H., Kajos, M., KeskiJunni-nen, H., Kupc, A., Kürten, A., Kvashin, A. N., Laaksonen, A., Lehtipalo, K., Makhmutov, V., Mathot, S., Nieminen, T., Onnela, A., Petäjä, T., Praplan, A. P., Santos, F. D., Schallhart, S., Seinfeld, J. H., Sipilä, M., Spracklen, D. V., Stozhkov, Y., Stratmann, F., Tomé, A., Tsagkogeorgas, G., Vaattovaara, P., Viisanen, Y., Vrtala, A., Wagner, P. E., Wein-gartner, E., Wex, H., Wimmer, D., Carslaw, K. S., Curtius, J., Donahue, N. M., Kirkby, J., Kulmala, M., Worsnop, D. R., and Baltensperger, U.: Oxidation Products of Biogenic Emissions Contribute to Nucleation of Atmospheric Particles, Science, 344, 717–721, doi:10.1126/science.1243527, 2014.
Salimi, F., Mazaheri, M., Clifford, S., Crilley, L., Laiman, R., and Morawska, L.: Spatial variation of particle number con-centration in school microscale environments and its impact on exposure assessment, Environ. Sci. Technol., 47, 5251–5258, doi:10.1021/es400041r, 2013.
Salimi, F., Ristovski, Z., Mazaheri, M., Laiman, R., Crilley, L. R., He, C., Clifford, S., and Morawska, L.: Assessment and ap-plication of clustering techniques to atmospheric particle num-ber size distribution for the purpose of source apportionment, Atmos. Chem. Phys., 14, 11883–11892, doi:10.5194/acp-14-11883-2014, 2014.
Salma, I., Borsós, T., Weidinger, T., Aalto, P., Hussein, T., Dal Maso, M., and Kulmala, M.: Production, growth and properties of ultrafine atmospheric aerosol particles in an urban environ-ment, Atmos. Chem. Phys., 11, 1339–1353, doi:10.5194/acp-11-1339-2011, 2011.
Stanier, C. O., Khlystov, A. Y., and Pandis, S. N.: Nucleation Events During the Pittsburgh Air Quality Study: Description and Rela-tion to Key Meteorological, Gas Phase, and Aerosol Parameters Special Issue of Aerosol Science and Technology on Findings from the Fine Particulate Matter Supersites Program, Aerosol Sci. Tech., 38, 253–264, 2004.
Stevens, B. and Feingold, G.: Untangling aerosol effects on clouds and precipitation in a buffered system, Nature, 461, 607–613, 2009.
WHO, W. H. O.: Air Quality Guidelines: Global Update 2005: Par-ticulate Matter, Ozone, Nitrogen Dioxide, and Sulfur Dioxide, World Health Organization Europe, 2005.
Willeke, K.: Temperature dependence of particle slip in a gaseous medium, J. Aerosol Sci., 7, 381–387, doi:10.1016/0021-8502(76)90024-0, 1976.
Woo, K., Chen, D., Pui, D., and McMurry, P.: Measurement of At-lanta aerosol size distributions: observations of ultrafine particle events, Aerosol Sci. Tech., 34, 75–87, 2001.