ACPD
13, 27501–27560, 2013Link between radicals and particle
formation
B. Bonn et al.
Title Page
Abstract Introduction
Conclusions References
Tables Figures
◭ ◮
◭ ◮
Back Close
Full Screen / Esc
Printer-friendly Version Interactive Discussion
Discussion
P
a
per
|
D
iscussion
P
a
per
|
Discussion
P
a
per
|
Discuss
ion
P
a
per
|
Atmos. Chem. Phys. Discuss., 13, 27501–27560, 2013 www.atmos-chem-phys-discuss.net/13/27501/2013/ doi:10.5194/acpd-13-27501-2013
© Author(s) 2013. CC Attribution 3.0 License.
Atmospheric Chemistry and Physics
Open Access
Discussions
This discussion paper is/has been under review for the journal Atmospheric Chemistry and Physics (ACP). Please refer to the corresponding final paper in ACP if available.
The link between atmospheric radicals
and newly formed particles at a spruce
forest site in Germany
B. Bonn1,*, E. Bourtsoukidis1,2, T. S. Sun1,2, H. Bingemer1, L. Rondo1, U. Javed2, J. Li2, R. Axinte2, X. Li3, T. Brauers3, H. Sonderfeld4, R. Koppmann4,
A. Sogachev5, S. Jacobi6, and D. V. Spracklen7 1
Institute for Atmospheric and Environmental Sciences, Goethe University, Frankfurt, Germany
2
Air Chemistry Department, Max-Planck-Institute for Chemistry, Mainz, Germany
3
Institute for Energy and Climate Research, IEK-8, Research Center, Jülich, Germany
4
Physics Department, University of Wuppertal, Wuppertal, Germany
5
Wind Energy Department, Technical University of Denmark, Roskilde, Denmark
6
Hessian Agency for the Environment and Geology, Wiesbaden, Germany
7
Institute for Climate and Atmospheric Science, School of Earth and Environment, University of Leeds, Leeds, UK
*
ACPD
13, 27501–27560, 2013Link between radicals and particle
formation
B. Bonn et al.
Title Page
Abstract Introduction
Conclusions References
Tables Figures
◭ ◮
◭ ◮
Back Close
Full Screen / Esc
Printer-friendly Version Interactive Discussion
Discussion
P
a
per
|
D
iscussion
P
a
per
|
Discussion
P
a
per
|
Discuss
ion
P
a
per
|
Received: 5 September 2013 – Accepted: 13 October 2013 – Published: 24 October 2013
Correspondence to: B. Bonn ([email protected])
Published by Copernicus Publications on behalf of the European Geosciences Union.
ACPD
13, 27501–27560, 2013Link between radicals and particle
formation
B. Bonn et al.
Title Page
Abstract Introduction
Conclusions References
Tables Figures
◭ ◮
◭ ◮
Back Close
Full Screen / Esc
Printer-friendly Version Interactive Discussion
Discussion
P
a
per
|
D
iscussion
P
a
per
|
Discussion
P
a
per
|
Discuss
ion
P
a
per
|
Abstract
It has been claimed for more than a century that atmospheric new particle formation is primarily influenced by the presence of sulphuric acid. However, the activation process of sulphuric acid related clusters into detectable particles is still an unresolved topic. In this study we focus on the PARADE campaign measurements conducted during Au-5
gust/September 2011 at Mt. Kleiner Feldberg in central Germany. During this campaign a set of radicals, organic and inorganic compounds and oxidants and aerosol proper-ties were measured or calculated. We compared a range of organic and inorganic nu-cleation theories, evaluating their ability to simulate measured particle formation rates at 3 nm in diameter (J3) for a variety of different conditions. Nucleation mechanisms 10
involving only sulphuric acid tentatively captured the observed noon-time daily maxi-mum inJ3, but displayed an increasing difference toJ3 measurements during the rest of the diurnal cycle. Including large organic radicals, i.e. organic peroxy radicals (RO2) deriving from monoterpenes and their oxidation products in the nucleation mechanism improved the correlation between observed and simulatedJ3. This supports a recently 15
proposed empirical relationship for new particle formation that has been used in global models. However, the best match between theory and measurements for the site of interest was found for an activation process based on large organic peroxy radicals and stabilized Criegee intermediates (sCI). This novel laboratory derived algorithm simulated the daily pattern and intensity of J3 observed in the ambient data. In this 20
algorithm organic derived radicals are involved in activation and growth and link the formation rate of smallest aerosol particles with OH during daytime and NO3 during nighttime. Because of the RO2s lifetime is controlled by HO2and NO we conclude that peroxy radicals and NO seem to play an important role for ambient radical chemistry not only with respect to oxidation capacity but also for the activation process of new 25
ACPD
13, 27501–27560, 2013Link between radicals and particle
formation
B. Bonn et al.
Title Page
Abstract Introduction
Conclusions References
Tables Figures
◭ ◮
◭ ◮
Back Close
Full Screen / Esc
Printer-friendly Version Interactive Discussion
Discussion
P
a
per
|
D
iscussion
P
a
per
|
Discussion
P
a
per
|
Discuss
ion
P
a
per
|
1 Introduction
The formation of new particles by gaseous molecules has been observed in and above a variety of different forest ecosystems (Kulmala et al., 2004d). Newly formed particles are frequently able to grow to sizes at which they can be activated as cloud droplets (particle diameterDp>60 nm), so influencing the brightness and lifetime of clouds. It 5
has been suggested that biogenic emissions from forests are involved in new particle formation and growth, meaning that forests could impact climate through aerosol-cloud interactions. Previous studies have suggested that the magnitude of this effect could be substantial, with Spracklen et al. (2008) estimating that monoterpene emisisons from boreal forests cause between 1.8 and 6.4 W m−2 of regional cooling through the 10
aerosol indirect effect. Therefore a new climate feedback process linking forest emis-sions, aerosol and climate effects has been proposed (Kulmala et al., 2004d; Bonn et al., 2008, 2009; Carslaw et al., 2010; Paasonen et al., 2013). For both steps involved in new particle formation, i.e. nucleation and and first steps of growth, knowledge of the chemical composition and the controlling parameters for the inital size range (particle 15
diameterDp<10 nm) are essential but so far unidentified.
A number of studies focusing on detailed understanding and explanation of atmo-spheric nucleation processes have been conducted in order to elucidate the key param-eters driving and controlling new particle formation (NPF) (Hyvönen et al., 2005; Kul-mala et al., 2004a, b, c; Bonn and Moortgat, 2003; Bonn et al., 2008, 2009; Mauldin III. 20
et al., 2013). However, the current impossibility to chemically analyze the tiny and chemically unstable aerosol particles at their smallest size (≈1.5 nm in diameter)
com-plicates the identification of the nucleation initiating molecules or compounds (NIM) and the compounds needed for the initial activation and growth. This initial activation is thought to be controlled by the presence of air ions (Laakso et al., 2006) or by strong 25
chemical interactions of participating molecules such as sulphuric acid. Some previous studies have focused on sulphuric acid related explanations only (Weber et al., 1999; Laakso et al., 2006; Riipinen et al., 2007; Paasonen et al., 2012; Mauldin III. et al.,
ACPD
13, 27501–27560, 2013Link between radicals and particle
formation
B. Bonn et al.
Title Page
Abstract Introduction
Conclusions References
Tables Figures
◭ ◮
◭ ◮
Back Close
Full Screen / Esc
Printer-friendly Version Interactive Discussion
Discussion
P
a
per
|
D
iscussion
P
a
per
|
Discussion
P
a
per
|
Discuss
ion
P
a
per
|
2013), whereas other theories rely on iodine oxides (Burkholder et al., 2004; O’Dowd and Hoffmann, 2005), organic substances (Bonn and Moortgat, 2003), or a mixed ap-proach of organic and inorganic species (Kulmala et al., 2004a, b; Bonn et al., 2008). For example, Bonn and Moortgat (2003) have suggested that sesquiterpenoid products initiate nucleation.
5
To find indications of the nucleation mechanism, indirect approaches involving cor-relations between particle formation rate (typically either at 3 nm (J3) or at 1 nm (J1) in diameter) and ambient gas-phase concentrations have been applied. A number of studies have explored the relationship between particle formation rate and the concen-tration of gaseous sulphuric acid for the SMEAR II boreal forest site in Hyytiälä (South-10
ern Finland) as well as for other locations (Kulmala et al., 2006; Sihto et al., 2006; Riipinen et al., 2007; Zhang et al., 2012). The correlations appear to be environment dependent, with relationships linking sulphuric acid concentration [H2SO4] and J3 in-volving sulphuric acid to the power of between unity and two (Kulmala et al., 2006; Sihto et al., 2006; Riipinen et al., 2007; Nieminen et al., 2012) multiplied by empirically 15
derived pre-factors (i.e.AorK) that vary spatially and temporally by orders of magni-tude (Kulmala et al., 2006; Sihto et al., 2006; Riipinen et al., 2007). These empirically derived pre-factors are assumed to include the lumped kinetics of particle formation as well as further species contributing to the initial steps of particle growth (Bonn et al., 2008). The most recent empirical formulation for the boreal forest site in Hyytiälä (Fin-20
land) is provided by Nieminen et al. (2012). Nonetheless, the detailed meaning and understanding of the formation process remains an open question.
One challenge in this context is the correlation between a variety of different sub-stances especially those linked through a similar method of production or destruction. For example, sulphuric acid is highly correlated with the atmospheric oxidant OH, which 25
ACPD
13, 27501–27560, 2013Link between radicals and particle
formation
B. Bonn et al.
Title Page
Abstract Introduction
Conclusions References
Tables Figures
◭ ◮
◭ ◮
Back Close
Full Screen / Esc
Printer-friendly Version Interactive Discussion
Discussion
P
a
per
|
D
iscussion
P
a
per
|
Discussion
P
a
per
|
Discuss
ion
P
a
per
|
an entire set atmospheric species. Therefore a good correlation is neither a proof nor a disproof of a compounds particular role in the nucleation process.
Here we investigate a novel potential link between the new particle formation process and ambient radicals. These radicals are expected to increase the nucleus size through chemical reactions that enable the cluster to overcome the critical nucleation size. The 5
primary candidates for these heterogeneous reactions (NIM or cluster+radical), are organic peroxy radicals from terpene oxidation (Bonn et al., 2007; Wolf et al., 2009, 2011). If this is the case, it is likely that the entire formation process is controlled by a number of different compounds, i.e. ambient inorganic and organic radicals such as hydroxyl radical (OH), hydroperoxy radicals (HO2), nitrogen monoxide (NO), the nitrate 10
radical (NO3) and different organic peroxy radicals (RO2). These are key species for representing different atmospheric chemistry situations, i.e. nitrogen oxides (NOx) and VOC control, the impact of radiation and temperature and of biosphere atmosphere interactions.
2 Theoretical background
15
New aerosol particles are formed from gaseous conversion forming an amorphous new phase (Pankow, 1994). Therefore a non-volatile and supersaturated gas-mixture is usually considered (Friedlander, 2000; Jacobson, 2005; Seinfeld and Pandis, 2006). In this context we will distinguish between two different rates, i.e. the nucleation and the formation rate of new particles. As nucleation describes the novel production of a new 20
phase with a distinct boundary between the phases the corresponding rate is named nucleation rate. On the contrary, ultrafine particles at larger sizes form by the split up of larger ones or by the growth of smaller ones to the apparent size. The increase in number in a certain size interval is called the formation rate and the exact value depends on the particular size of interest. As the exact starting size of a new particle 25
relies on the compounds involved, we will focus on the formation rate at 3 nm in particle diameterJ3. At this size a new phase (i.e. a particle) is definitely formed independent
ACPD
13, 27501–27560, 2013Link between radicals and particle
formation
B. Bonn et al.
Title Page
Abstract Introduction
Conclusions References
Tables Figures
◭ ◮
◭ ◮
Back Close
Full Screen / Esc
Printer-friendly Version Interactive Discussion
Discussion
P
a
per
|
D
iscussion
P
a
per
|
Discussion
P
a
per
|
Discuss
ion
P
a
per
|
of its chemical composition and is detectable with a commercial condensation particle counter.
The formation of clusters and particles from gaseous molecules in the atmosphere needs to overcome several nucleation hampering effects. Those include the surface production for a novel droplet or crystal (Kelvin effect) and a sufficient growth, before 5
the clusters or smallest particles become captured by preexisting particles. This captur-ing process depends on the growth rate GR (diameter per time) and the condensation (in m−2, CS′) or coagulation sink (in m−2, CoagS′). The larger GR (substantial mass supply), and therefore the shorter the time to survive before becoming detectable, and the smaller CS′or CoagS′, the higher the survival rate. These two sink terms are com-10
monly provided in two different units, i.e. (a) in s−1to represent the ambient lifetime of the clusters or particles before getting lost on preexisting surfaces (Pirjola and Kulmala, 1998; Dal Maso et al., 2005) or in (b) m−2(here denoted with an ′), i.e. related to the available aerosol surface area for attachment due to diffusional collisions (Kerminen and Kulmala, 2002).
15
Since homogeneous homomolecular nucleation by a single compound generally re-quires extremely high supersaturation for any of the relevant species to overcome the Kelvin effect, it is not relevant for stable compounds except radicals at atmospheric background conditions (Friedlander, 2000; McFiggans et al., 2004). Homogeneous nu-cleation by multiple compounds (heteromolecular) requires a substantial interaction 20
between compounds such as present in the binary or ternary nucleation of sulphuric acid-water and of sulphuric acid-water-ammonia or amines (Friedlander, 2000; Seinfeld and Pandis, 2006; Kirkby et al., 2011; Paasonen et al., 2012). These intermolecular in-teractions such as acid-base stabilization (Kirkby et al., 2011; Ryding et al., 2012) lower the critical energy that is required to form the new particle phase. There are two further 25
ACPD
13, 27501–27560, 2013Link between radicals and particle
formation
B. Bonn et al.
Title Page
Abstract Introduction
Conclusions References
Tables Figures
◭ ◮
◭ ◮
Back Close
Full Screen / Esc
Printer-friendly Version Interactive Discussion
Discussion
P
a
per
|
D
iscussion
P
a
per
|
Discussion
P
a
per
|
Discuss
ion
P
a
per
|
In the size range of interest the solvent mass is extremely small and even water va-por is not able to join the aerosol phase due to the Kelvin effect without considering chemical effects. One theory including this effect is the so-called nano-Koehler theory (Kulmala et al., 2004a), which assumes sulphuric acid and water containing clusters become activated by water-soluble organic compounds. But organic compounds of no-5
table mass are primarily less water-soluble and the solubility effects commonly become predominant at sizes beyond 50 nm in diameter, i.e. sizes substantially greater than the nucleation size. Earlier investigations on the ionic effect within the vegetated boundary layer revealed a contribution of less than 0.1 cm−3s−1(Hirsikko et al., 2011) to the par-ticle formation rate at 2 nm (J2). This effect declines further still towards larger particle 10
sizes because of a multitude of sink terms. Laakso et al. (2006) quantified its relative contribution to less than 10 %. Despite these nontrivial theories, numerous discrepan-cies exist and so far none of these schemes is capable of adequately explaining the details of observed particle formation and growth rates in the boundary layer above vegetation. There is a need for modified or novel approaches and explanations for the 15
growth of NIM to detectable sizes of 3 nm in particle diameter.
The remaining possibility is of reactive nature. Herein gas phase molecules interact with cluster surfaces and form new macromolecules (Zappoli et al., 1999; McFiggans et al., 2004; Kalberer et al., 2004; O’Dowd and Hoffmann, 2005). The process is not affected by the Kelvin effect and is controlled only by the reactivity and concentration 20
of cluster and corresponding molecules. This reaction controlled activation (RCA) re-quires the presence of trace gases, possessing a high reactivity and notable molar mass, i.e. larger radicals, which basically initiate a catalytic reaction chain. In this RCA, radicals react with clusters maintaining the reactive site and contributing to particu-late mass (Burkholder et al., 2004). The process is similar to the behavior of OIO that 25
initiates a polymerization to form new clusters and particles. This is capable of explain-ing new particle formation observed at coastal sites (O’Dowd et al., 2001; McFiggans et al., 2004; O’Dowd and Hoffmann, 2005). But halogen radicals are not available in substantial amounts for nucleation at forest sites.
ACPD
13, 27501–27560, 2013Link between radicals and particle
formation
B. Bonn et al.
Title Page
Abstract Introduction
Conclusions References
Tables Figures
◭ ◮
◭ ◮
Back Close
Full Screen / Esc
Printer-friendly Version Interactive Discussion
Discussion
P
a
per
|
D
iscussion
P
a
per
|
Discussion
P
a
per
|
Discuss
ion
P
a
per
|
In forested areas large amounts of biogenic volatile organic compounds (BVOCs) are emitted (Guenther et al., 1995, 2006; Bourtsoukidis et al., 2012). These compounds have a variety of different reactivities, functionalities, molecular sizes (Kesselmeier and Staudt, 1999) and driving forces (Guenther et al., 1995; Niinemets et al., 2010; Bourt-soukidis et al., 2012). During daytime most of the BVOCs are oxidized by the hydroxyl 5
radical (OH) to form an organic peroxy radical (RO2) in the first stage. This radical proceeds reacting with one of the other available radicals such as HO2, NO, RO2and NO3in the gas-phase to form stable intermediate products such as alcohols, nitrates, organic hydroperoxides, carbonyl compounds or organic acids. Those compounds con-tribute to secondary organic aerosol mass after partitioning to the preexisting organic 10
aerosol (Pankow, 1994; Hoffmann et al., 1997; Barsanti and Pankow, 2004, 2005, 2006; Donahue et al., 2006, 2011). A further heterogeneous reaction was postulated by Bonn et al. (2007) and revealed under laboratory conditions by Wolf et al. (2009, 2011) for organic peroxy radicals consisting of more than five carbon atoms (RO2(C>5)). These large organic peroxy radicals are thought to react with aerosol constituents pro-15
ducing a variety of different macromolecules that have been seen in infrared spectra (Wolf et al., 2009). Organic peroxy radicals with less than six carbon atoms seem to split after formation of a very short-lived intermediate caused by the release of reaction energy, undergoing transfer to stable carbonyl compounds. Thus, they cannot con-tribute to particle mass and may seal the reactive sites preventing further reactions. 20
Organic peroxy radicals with six C atoms or more (RO2(C>5)) tend to distribute the elevated energy over a sufficiently large molecule and form a tentatively stable macro-molecule. The proposed growth process is independent of the cluster chemical nature, i.e. inorganic or organic, and is only dependent on its reactivity with respect to ambient radicals. This distinction between small and large organic compunds has important im-25
plications for BVOC emissions from vegetation: temperate forests with high emissions of isoprene will yield small (C≤5) RO2in high amounts, preventing activation and thus
ACPD
13, 27501–27560, 2013Link between radicals and particle
formation
B. Bonn et al.
Title Page
Abstract Introduction
Conclusions References
Tables Figures
◭ ◮
◭ ◮
Back Close
Full Screen / Esc
Printer-friendly Version Interactive Discussion
Discussion
P
a
per
|
D
iscussion
P
a
per
|
Discussion
P
a
per
|
Discuss
ion
P
a
per
|
(mono)terpene emissions act as proposed by Bonn et al. (2007) and Wolf et al. (2009, 2011).
Support for this process has been found recently in laboratory studies (Hummel, 2010; Ebach, 2010; Kestel, 2013). These studies used alkene-ozone reactions in the presence of nopinone (C9H14O), a ketone product of β-pinene oxidation. Neither 5
ethene- nor propene- or cis-2-butene-ozone reactions are expected to create new par-ticles at moderate concentrations in the range of less than 1012cm−3(<40 ppbv). How-ever, adding nopinone (2.5×10¹²–1.5×1013cm−3, that is 100–1000 ppbv, i.e. ca. two
to three orders of magnitude below saturation level) they cause significant formation of new particles and the activation process can be explained solely by the formed OH 10
radicals as a product of the ozonolysis and the organic peroxy radicals involved. For the present study three different nucleation hypotheses are considered: (A) sulphuric acid only based on Nieminen et al. (2012),
(B) interaction of organic compounds with sulphuric acid based on Bonn et al. (2008) and Metzger et al. (2010) and
15
(C) organic only based on studies of Bonn et al. (2007); Wolf et al. (2009, 2011); Hummel (2010); Ebach (2010) and Kestel (2013).
(A) Sulphuric acid only
This hypothesis is solely focused on the presence of sulphuric acid, obtained from fits to measurement data at the Finnish boreal station Hyytiälä and is scaled to the acids 20
concentration the following way:
J3,H2SO4=2×10⁻¹¹cm−3s−1([H
2SO4] cm3)1.78 (1)
The pre-factor 2×10⁻¹¹cm−3s−1 includes all unknowns and the reactivity of
inter-acting, partially unknown compounds.
ACPD
13, 27501–27560, 2013Link between radicals and particle
formation
B. Bonn et al.
Title Page
Abstract Introduction
Conclusions References
Tables Figures
◭ ◮
◭ ◮
Back Close
Full Screen / Esc
Printer-friendly Version Interactive Discussion
Discussion
P
a
per
|
D
iscussion
P
a
per
|
Discussion
P
a
per
|
Discuss
ion
P
a
per
|
(B) Interaction of organic compounds with sulphuric acid
The nucleation is described empirically as a product of monoterpenes, OH, conden-sation sink in the unit s−1(CS, Eq. 3) and sulphuric acid concentration assigned with a scaling factorK (Kulmala et al., 2006; Sihto et al., 2006; Riipinen et al., 2007) and has been found to agree in a certain range for different ecosystems around the globe: 5
J3,mix=K·[MT][OH]
CS ·[H2SO4] (2)
This formation approach (Eq. 2) uses the sulphuric acid concentration, an empirical fitting parameterK derived from ambient measurements and includes a monoterpene-OH-oxidation product that is assumed non-volatile and sticks to any aerosol surface at collision. For the present study a fit of PARADE data results in a K value of (5±
10
1)×10−25cm6s−2that is used for the intercomparison. For the formation approach (B)
the lifetime of smallest clusters is assumed as 1/CS, i.e. the ambient lifetime before collision with the next particle surface. CS in s−1 is used as formulated by Pirjola and Kulmala (1998):
CS=2
∞
Z
Dp0
βn(Dp)βMdDp≈2πDiX
i
1+2λair
Dp
1+ 0.377+43α
·2Dλair
p + 3
4α
2λ
air
Dp
2
·DpiNi (3)
15
CS′
= CS
4πDi
(4)
These two equations include several parameters: the diffusion coefficient of the con-densing molecules Di commonly assumed to be sulphuric acid, the collision rate β of gas molecules and particles which changes for different sizes, the particle number 20
densityn(Dp), the transition correction factorβMfor different particle sizes that includes the Knudsen numberKn(=2λair
ACPD
13, 27501–27560, 2013Link between radicals and particle
formation
B. Bonn et al.
Title Page
Abstract Introduction
Conclusions References
Tables Figures
◭ ◮
◭ ◮
Back Close
Full Screen / Esc
Printer-friendly Version Interactive Discussion
Discussion
P
a
per
|
D
iscussion
P
a
per
|
Discussion
P
a
per
|
Discuss
ion
P
a
per
|
Dp, the sticking coefficientα commonly assumed to be 1 and finally the particle num-ber concentrationNi in a certain size section i. In order to calculate the entire loss of condensing molecules the loss must be integrated over the entire particle size distribu-tion with the largest particles contributing most because of the difference in speed and because of the large surface area.
5
Analysing the particle formation rate description in Eq. (2), it may be concluded that the proposed interaction of large (C>5) organic peroxy radicals is already included. Those are formed in the first step of monoterpene oxidation by OH. The reciprocal condensation sink displays a lifetime that is in the same range as the common RO2 sinks such as NO or the hydroperoxy radical HO2. TheK factor can be interpreted as 10
well in two different ways, i.e. as described by Bonn et al. (2008) as a lumped constant from several reactions including ozone, terpenes and water vapour or as the reaction rate constant between organic peroxy radicals from monoterpenes and OH times the former reaction rate constant of the monoterpene-OH product and sulphuric acid.
(C) Organic only
15
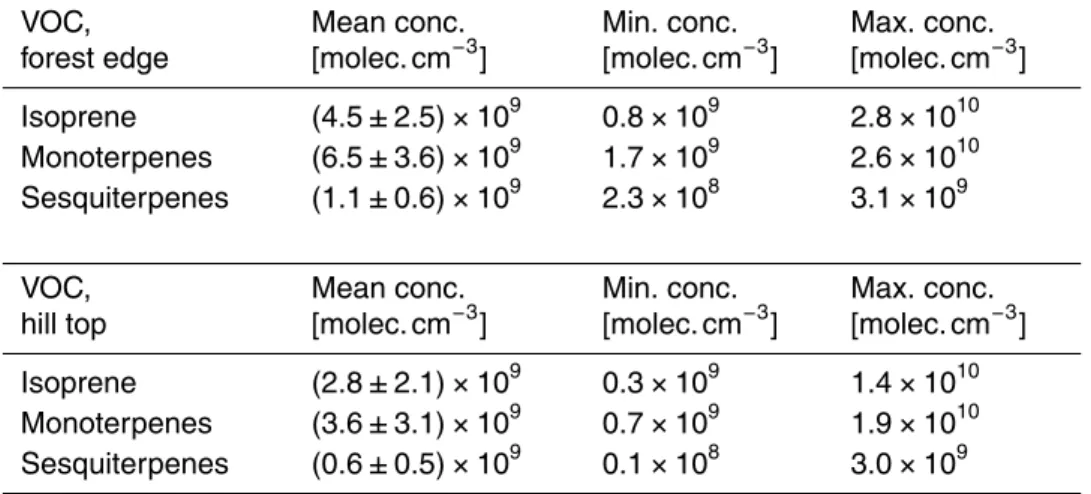
This new particle formation theory is described by a three step process (see scheme provided in Fig. 1): (1) first the nucleation initiating molecule (NIM) with weak chemical bonds such as the secondary ozonide (SOZ) is formed (Bonn et al., 2002; Bonn and Moortgat, 2003). It provides insufficient supersaturation to allow homogeneous nucle-ation to occur. (2) The activnucle-ation step occurs essentially as a catalytic chain reaction 20
including the large organic peroxy radicals (RO2(C>5)) as well as stabilized Criegee intermediates (sCI, Criegee (1975)), during which the weak O-O bond is continuously split and reformed. This process is supposed to bridge the gap between the NIM size of around 1 nm and the step 3. (3) Onset of partitioning of organic compounds (Pankow, 1994). In terms of mass production, this step becomes efficient above about 5 nm and 25
dominant above about 10 nm in particle diameter. This third step actually includes the partitioning and the condensation of low volatile compounds and heterogeneous reac-tions such as acid-catalyzed reacreac-tions (Barsanti and Pankow, 2004, 2005, 2006).
ACPD
13, 27501–27560, 2013Link between radicals and particle
formation
B. Bonn et al.
Title Page
Abstract Introduction
Conclusions References
Tables Figures
◭ ◮
◭ ◮
Back Close
Full Screen / Esc
Printer-friendly Version Interactive Discussion
Discussion
P
a
per
|
D
iscussion
P
a
per
|
Discussion
P
a
per
|
Discuss
ion
P
a
per
|
The formation rateJ3can be summarized by the Eqs. (5) and (6). It approximates the formation process by the limiting reaction between the SOZ and either a (RO2(C>5)) or a sCI. For this purpose SOZ, (RO2(C>5)) and sCI are gained by steady-state ap-proaches (i.e. sources balance sinks), which is feasible for short-lived gases in the ambient with respect to the time resolution. However for the SOZ this may result in 5
a moderate overestimation because of its larger lifetime of several minutes up to a quar-ter of an hour. The empirically shortened formulation results from a set of laboratory studies (Bonn et al., 2002; Bonn and Moortgat, 2003; Hummel, 2010; Ebach, 2010; Kestel, 2013) conducted earlier on the impact of a variety of trace gases such as NO, CO, water vapour and large ketones:
10
J3,org=[SOZ]·min(2.5×10⁻¹³cm3molec.−1s−1
·[RO2](terp.), 2×10⁻¹²cm3molec.−1s−1·[sCI]) (5)
·2.5×10
−13
cm3molec.−1s−1·[RO2](terp.)+2×10⁻¹²cm3molec.−1s−1·[sCI]
kHO2
RO2[HO2]+k
NO
RO2[NO]+k
NO3
RO2[NO3]+k
RO2
RO2[RO2]
SOZ=k
O3
SQT[SQT][O3]·Ystab 80 s−1+kH2O
sCI [H2O]
· 80 s
−1
kSOZOH [OH]+CS
(6)
15
[SOZ] abbreviates the secondary ozonide concentration formed by the intramolec-ular formation during sesquiterpene (SQT) ozone (O3) reactions and approximated in Eq. (6). The kinetic speed of this intramolecular reaction has been quantified by Beck et al. (2011) forα-humulene and was assumed identical forβ-caryophyllene, far-nesene and the other sesquiterpenes present at Taunus Observatory (Bourtsoukidis 20
et al., 2012). The reaction rate constant of the stabilized Criegee intermediates (sCI) with water, which is currently not accurately determined (10−19cm−3s−1<kH2O
sCI <
10−15cm−3s−1, Atkinson et al., 2006), is assumed as 2×10⁻¹⁷cm3s−1 (Großmann,
as-ACPD
13, 27501–27560, 2013Link between radicals and particle
formation
B. Bonn et al.
Title Page
Abstract Introduction
Conclusions References
Tables Figures
◭ ◮
◭ ◮
Back Close
Full Screen / Esc
Printer-friendly Version Interactive Discussion
Discussion
P
a
per
|
D
iscussion
P
a
per
|
Discussion
P
a
per
|
Discuss
ion
P
a
per
|
sumed as 0.8). RO2(terp.) represents the sum of organic peroxy radicals formed from (mono)terpene oxidation by OH and NO3. It is important to note that while the sesquiterpenes are assumed to contribute primarily to the SOZ formation, monoter-penes and oxidation products are considered to control the activation process by sCI and RO2(terp.). Although monoterpenes react much slower with ambient ozone, their 5
sCIs do not form SOZ intramolecularly and therefore the concentration is essentially dependent on the primary sink reaction with ambient water vapour.
The mean reaction rate kO3
SQT of the sesquiterpene mixture (Bourtsoukidis et al., 2012) with ambient ozone was calculated from the product of individual contributions and reaction rate constants taken as available from the literature. Missing reaction rate 10
constants for individual SQTs have been approximated by structure activity relation-ships (Kourtchev, I., personal communication, 2012) based on the detected mixture determined by GC-MS analysis. The value of 1/CS again represents the approximated lifetime of SOZ molecules before being lost to an aerosol surface, which is controlled by preexisting aerosol surface area. The chemical destruction of SOZ is assumed to 15
occur by OH (kSOZOH =7.29×10⁻¹¹cm3s−1) (Saunders et al., 2003; Jenkin et al., 2003),
which leads to a minimum chemical lifetime of about 104s assuming a hydroxyl radical concentration [OH] of 106cm−3. If compared to the sink on aerosol surfaces CS the destruction by OH contributes negligibly to the gas-phase loss of SOZ. Finally, the min-imum expression of two reaction rates of RO2(C>5) and of sCI with the SOZ or the 20
cluster, respectively represents the activation step (2) with the slower one controlling the entire process. These two reaction rate constants are taken from laboratory exper-iments of Hummel (2010) and simulations of Ebach (2010) representing the activation cycle summarized in a single step. While the reaction rate constant of RO2 and NIM is basically the RO2+RO2 reaction rate constant for larger peroxy radicals (Atkinson 25
et al., 2006), the reaction rate constant of sCI and NIM is about 1.5×10⁵ times the
one of sCI with water. This was found to be rather consistent for a range of different conditions.
ACPD
13, 27501–27560, 2013Link between radicals and particle
formation
B. Bonn et al.
Title Page
Abstract Introduction
Conclusions References
Tables Figures
◭ ◮
◭ ◮
Back Close
Full Screen / Esc
Printer-friendly Version Interactive Discussion
Discussion
P
a
per
|
D
iscussion
P
a
per
|
Discussion
P
a
per
|
Discuss
ion
P
a
per
|
At least two of the nucleation hypotheses (B) and (C) are linked to organic peroxy radicals, while the situation remains unclear in case (A) because of the lumping of a multitude of processes in a single empirical fitting constant.
In order to test this hypothesized link between radicals and particle formation rates and to evaluate the potential importance of the individual pathways for atmospheric 5
conditions at Mt. Kleiner Feldberg, we require the knowledge of the concentrations of individual terpene groups, OH, NO3, ozone, water vapor, large organic peroxy radicals (RO2(C>5)), HO2, NO, stabilized Criegee intermediatess (sCI) and of the condensa-tion sink CS of NIM at approximately 1.2–1.5 nm.
3 Measurements and methods
10
The “Particles And RAdicals: Diel observations of the impact of urban and biogenic Emissions” (PARADE) campaign measurements were conducted at Taunus Observa-tory (50◦13′N, 8◦26′E, 825 m a.s.l.). It is located at the hilltop of the second highest elevation of the Taunus ridge within a managed spruce forest of about 60 to 80 yr in age (Handisides et al., 2003). While the forest predominantly consists of spruce, 15
smaller amounts of pines are present. The hill top was cleared of any forests about a century ago for meteorological measurements (circle of around 160 m in diameter) and kept free of coniferous trees since then. Several invasive smaller trees or bushes have grown there since then. A full set of trace gas, radical, particle and photolysis measurements were performed between the 14 August and the 9 September 2011. 20
3.1 Gaseous measurements
ACPD
13, 27501–27560, 2013Link between radicals and particle
formation
B. Bonn et al.
Title Page
Abstract Introduction
Conclusions References
Tables Figures
◭ ◮
◭ ◮
Back Close
Full Screen / Esc
Printer-friendly Version Interactive Discussion
Discussion
P
a
per
|
D
iscussion
P
a
per
|
Discussion
P
a
per
|
Discuss
ion
P
a
per
|
(a) at the hill top including the following compounds were measured: Ozone, NO, NO2, NO3, N2O5, PAN, HONO, CO, HO2, H2O2, SO2, H2SO4, HCHO, glyoxal, acetone, methanol, toluene and monoterpenes.
(b) The second point was located close to the forest (find further details in Bourt-soukidis et al., 2012) measuring at a dynamical plant cuvette, which allowed detection 5
of the ambient mixing ratio when a budget approach was applied. The compounds in-vestigated were HCHO, acetone, benzene, isoprene, mono- and sesquiterpenes, major primary terpene oxidation products such as nopinone and pinonaldehyde and linalool. A highly time-resolved measurement of volatile organic compound (VOC) pattern was obtained continuously by Proton Transfer Reaction-Mass Spectrometry (HS-PTR-MS, 10
Ionicon, Bourtsoukidis et al., 2013) in a plant cuvette at 4 m above soil level at a sunlit branch at the edge of the forest. This was essential to obtain sesquiterpene emis-sions and ambient mixing ratios above the detection limit. More details on the method can be found in Bourtsoukidis et al. (2012, 2013). Because of the insensitive PTR-MS approach for compounds with identical molar masses the detailed composition of 15
mono- and sesquiterpenes were derived by (a) exemplary branch samples analyzed by gas chromatography-mass spectrometry (GC-MS) (FMI, Helsinki, FI) (Hakola et al., 2006) during the season and (b) by air samples analyzed by GC-MS (MPI Mainz). OH-reactivity was obtained by a novel method from the Max-Planck Institute in Mainz (Nölscher et al., 2012, 2013) for the same cuvette as used for the VOC measurements 20
using the PTR-MS and at the hill top too. The individual instruments and methods as well as the corresponding groups responsible for data acquisition are listed in Table 1.
3.2 Particle measurements
Particles were measured by different sets of instruments. One set measured the par-ticle size distribution by a nano-DMPS set-up focusing on the smallest parpar-ticle size 25
range between 3 and 20 nm in particle diameter at the hill top container. Particle for-mation ratesJ3at 3 nm were considered as the positive change in concentration of the particles between 3 and 5 nm per 10 min interval. For condensation sink calculations
ACPD
13, 27501–27560, 2013Link between radicals and particle
formation
B. Bonn et al.
Title Page
Abstract Introduction
Conclusions References
Tables Figures
◭ ◮
◭ ◮
Back Close
Full Screen / Esc
Printer-friendly Version Interactive Discussion
Discussion
P
a
per
|
D
iscussion
P
a
per
|
Discussion
P
a
per
|
Discuss
ion
P
a
per
|
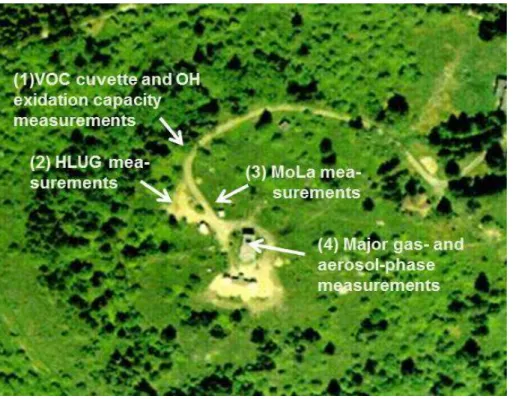
a second set-up, a FMPS and an OPC were deployed in a Mobile Laboratory (MoLa) (Drewnick et al., 2012) about 20 m away from the cuvette measurement site in east-ward direction (Fig. 2). With this set-up particle size distributions between 5.6 nm and 32 µm were detected, which is sufficient for aerosol sink estimates. The condensation sink itself was calculated according to Pirjola and Kulmala (1998); Kulmala et al. (2001) 5
as given in Eq. (3). All particle measurements were conducted at a height of about 5 to 6 m above soil level similar to gas-phase and wind speed measurements. The detailed instrumentation and references to their methods can be found in Table 1.
3.3 Boundary layer mixing and dilution
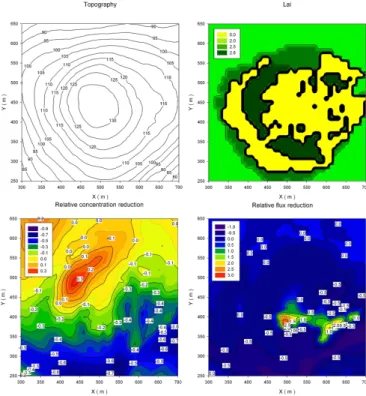
As the hill top site is not homogeneous, with the surrounding vegetation diverse in 10
height, mixture and density, a distinct horizontal variation of the individual parameters, especially VOCs and related radicals has to be expected. Therefore we will describe how forest edge concentration measurements have been modified to account for dilu-tion during advecdilu-tion to the aerosol measurement locadilu-tion at the hill top center. This step is necessary in order to allow intercomparison with the aerosol measurements and 15
the calculations based on the different hypotheses (A)–(C). Important to remember is the different location of the measurements due to optimum measurement conditions. VOC measurements were conducted at the spruce forest edge, while most of the other measurements were performed at the hill-top at a distance between 20–60 m away from the forest edge (Sect. 3.1). Therefore the derived VOC concentrations need a di-20
lution correction as a function of wind speed and direction as well as of boundary layer characteristics to obtain the concentration at the aerosol measurement location.
This was done using the numerical atmospheric boundary layer model SCADIS ap-plied to a very detailed 3-D structure of the present surface. The model accounts for topographic variations and considers the vegetation as a multi-layer medium. Imple-25
ACPD
13, 27501–27560, 2013Link between radicals and particle
formation
B. Bonn et al.
Title Page
Abstract Introduction
Conclusions References
Tables Figures
◭ ◮
◭ ◮
Back Close
Full Screen / Esc
Printer-friendly Version Interactive Discussion
Discussion
P
a
per
|
D
iscussion
P
a
per
|
Discussion
P
a
per
|
Discuss
ion
P
a
per
|
found in Sogachev et al. (2002, 2004, 2012). Spatial resolution was set to 5 m and the model was initialized with the ALKIS-dataset of the Hessian local agency for sur-face management and geo information (HVBG, Wiesbaden, Germany). With sources of passive scalar prescribed according to Sogachev et al. (2008), concentration fields around and over the forest gap were calculated. Therefore a vegetation mass related 5
emission was assumed for an unreactive compound in the three dimensional space. Implementing neutrally stratified conditions allows us to assume a similarity of mod-elled airflow and concentration fields in the range of observed wind speeds. For each wind direction the reduction due to dilution was calculated for a standard wind profile (see e.g. Fig. 3). This considers a mean horizontal wind velocity of ustand of 2 m s−1 10
at the measurement container of the Hessian Agency for Environment and Geology (HLUG, Wiesbaden, Germany) that is half of the way between forest and hill top mea-surement location. All wind velocities were subsequently normalized to the value at the forest edge. To estimate VOC mixing ratios at the hill top, the following procedure was applied:
15
(a) Calculation of ambient mixing ratios at the forest edge [VOC](forest edge) based on cuvette measurement budgets (Bourtsoukidis et al., 2013).
(b) Calculation of the total dilution for each of the wind directions at standard wind speed conditions (Table 2) and linear interpolation in between.
(c) Calculation of the transport time τ between the closest forest edge opposite to 20
the wind direction (i.e. towards the west for an eastward wind), and derivation of dilution constant per time (kdil(wind dir.)) using the calculated wind speed pattern and the distance iteratively.
(d) Calculation of the summed losses of individual VOCs at measured wind speeds
umeas and ozone concentrations (measurements at hill top applied): 25
[VOC](hill top)=[VOC](forest)·exp
−
kdil+kO3
VOC·[O3]
τ·umeas
ustand
(7)
ACPD
13, 27501–27560, 2013Link between radicals and particle
formation
B. Bonn et al.
Title Page
Abstract Introduction
Conclusions References
Tables Figures
◭ ◮
◭ ◮
Back Close
Full Screen / Esc
Printer-friendly Version Interactive Discussion
Discussion
P
a
per
|
D
iscussion
P
a
per
|
Discussion
P
a
per
|
Discuss
ion
P
a
per
|
The wind speed umeas was obtained by HLUG at 4 m above the surface, half way between the forest edge and hill top and was interpolated for 10 min intervals.
3.4 Estimation of OH-concentration
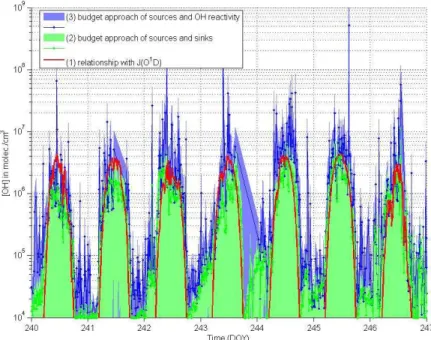
One of the essential points for atmospheric particle formation is the quantification of at-mospheric radicals such as OH. Therefore different approaches were used: as planned 5
OH measurements failed because of a detector malfunction, the following calculation methods were applied: (1) the correlation of the photolysis rate of O(1D) J(O1D) with OH (Rohrer and Berresheim, 2006), (2) the budget approach of sources and sinks of OH as quantified by gaseous measurements and (3) the budget approach using quan-tified sources and OH reactivity measurements at the hill top.
10
With respect to approach (1) J(O1D) was measured by spectroradiometer as de-scribed by Bohn et al. (2008). Data were available during the entire period for daytime. Rohrer and Berresheim (2006) have found a linear correlation with a mean slope of 2.4×10¹¹s for Hohenpeißenberg, Southern Germany. Available values for different
comparable areas and pollution impacts were found between 1.4× and 3.9×10¹¹s,
15
this range is also to be expected at the Taunus Observatory. As the site of inter-est is influenced by anthropogenic and biogenic sources neither of the assumptions of Rohrer and Berresheim (2006) is valid and the provided equations were used in an extensive version (see supporting online information). With this, a correlation of (1.8±0.1)×1011s was found (see supporting online information, Supplement Fig. S8).
20
This was used for photolysis rates above 10−6s−1. Since this approach uses a limited amount of data and includes a notable uncertainty of individual parameters we assume a maximum uncertainty of the estimated OH concentration of a factor of 2. For the bud-get approaches (approaches 2 and 3) a chemical box model has been used assuming a steady-state condition between all source and sink terms for OH. All significant tro-25
ACPD
13, 27501–27560, 2013Link between radicals and particle
formation
B. Bonn et al.
Title Page
Abstract Introduction
Conclusions References
Tables Figures
◭ ◮
◭ ◮
Back Close
Full Screen / Esc
Printer-friendly Version Interactive Discussion
Discussion
P
a
per
|
D
iscussion
P
a
per
|
Discussion
P
a
per
|
Discuss
ion
P
a
per
|
way as OH through applying a chemical box model including the established tropo-spheric background chemistry (see the Master Chemical Mechanism v3.2, Saunders et al., 2003; Jenkin et al., 1997, 2003, 2012). Therefore initial OH and HO2 concen-trations were assumed as follows: 104cm−3for OH and 107cm−3for HO2and iterated 100 times until steady-state conditions were obtained. The OH destruction (sink) was 5
taken into account by two different approaches, i.e. (approach 2) by considering all known sink terms of the radical (list of sinks, Supplement Table S1 of supporting online information, section (B) and (approach 3) by taking into account the local OH reactivity measurements (Nölscher et al., 2013).
Intercomparison of the three different approaches (Fig. 4) yielded similar results. 10
While approach (2) underestimated the OH concentration calculated by approach (1) during daytime (median:−37 %), approach (3) overestimated it (median:+39 %, values
above 107cm−3 are excluded). This difference is caused by the different sink terms only. However, the sink calculated is notably larger (+53 %) than measured by the OH reactivity method of Nölscher et al. (2013) leading to higher OH estimations using 15
the reactivity method. Most likely horizontal changes in VOC mixing ratios and further sinks do matter significantly as the OH reactivity changes notably from the forest edge towards the cleared hill cap. However, further investigations are beyond the scope of this study. More information can be found in the supporting online information (sections B and C).
20
For formation rate calculations the measurements have been used where available and the estimations using approach (1) ([OH]=f(J(O1D))) at daytime and the budget approach (2) at nighttime, where J(O1D) is not available.
3.5 Particle formation rate at 3 nm and 5 nm
In order to test the effect of different sizes, particle formation rates have additionally 25
been calculated for 5 nm in diameter using the same nano-DMPS set-up. Both parti-cle formation rates, i.e. at 3 and at 5 nm are related by the growth rate and the loss rate. As this is a purely dynamical process Kerminen and Kulmala (2002) have derived
ACPD
13, 27501–27560, 2013Link between radicals and particle
formation
B. Bonn et al.
Title Page
Abstract Introduction
Conclusions References
Tables Figures
◭ ◮
◭ ◮
Back Close
Full Screen / Esc
Printer-friendly Version Interactive Discussion
Discussion
P
a
per
|
D
iscussion
P
a
per
|
Discussion
P
a
per
|
Discuss
ion
P
a
per
|
a simplified equation (Eq. 8):
J5=J3·exp
γCoagS
′
(3 nm)
GR ·
1
5 nm− 1 3 nm
CoagS′
(3 nm)=CoagS(3 nm) 4πDi
(8)
HereJ3andJ5represent the formation rates at 3 and 5 nm,γ is a lumped factor of 0.23 nm2m2h−1 deriving from diffusive speeds, CoagS′(3 nm) is the coagulation sink of 3 nm particles (unit s−1, CoagS(3 nm) divided by 4π and the diffusion constant Di
5
of the growing cluster). In the case of gases CoagS′
is replaced by CS′
and Di is the diffusion constant of the condensing species, here to be assumed as sulphuric acid as is commonly assumed (Kulmala et al., 2001).
The CoagS′
value in the unit ofm2(Kulmala et al., 2001; Dal Maso et al., 2005) has been calculated from the FMPS and OPC derived particle size distribution. The GR 10
at such small sizes is difficult to access directly especially above an inhomogeneous surface. For this a novel approach was applied. It is commonly assumed that new par-ticle formation is linked to a rise in sulphuric acid concentration (Riipinen et al., 2007; Sihto et al., 2006) and thus in OH concentration or vice versa. The time difference in sulphuric acid or OH rise and the rise in particle number at a certain size can thus be 15
interpreted as growing time. Thus the GR results from the size difference divided by the time shift. Here we cross-correlated the particle formation rate at 3 nmJ3with the OH concentration (measurement, or estimation where not available) and looked for the time of maximum correlation within five hours of a particular day (GRmin=0.5 nm h−1 assumed). This limitation is set because of a limit in data at larger times. The cross-20
ACPD
13, 27501–27560, 2013Link between radicals and particle
formation
B. Bonn et al.
Title Page
Abstract Introduction
Conclusions References
Tables Figures
◭ ◮
◭ ◮
Back Close
Full Screen / Esc
Printer-friendly Version Interactive Discussion
Discussion
P
a
per
|
D
iscussion
P
a
per
|
Discussion
P
a
per
|
Discuss
ion
P
a
per
|
4 Results
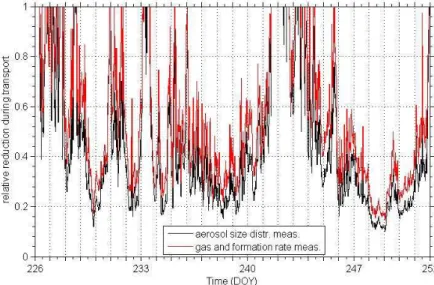
4.1 Boundary layer transport dilution
As noted earlier, the surface information on vegetation, its height and leaf area den-sity was used to initialize the backtrajectory boundary layer model. The outcome was treated as a function of wind direction and was subsequently scaled to the present 5
wind speeds at 4 m above soil level. The resulting relative reduction for VOCs during the transport without any reactions is displayed in Fig. 5 for two different locations, i.e. the hill top, where formation rates and gases have been acquired as well as for the MoLa location, at which the entire particle size distribution has been measured. It is obvious that there were several periods of minor dilution (small transport times): at the 10
start of measurements, at the day of the year (DOY) 233 and at the initial days of the second half (241–244). During these periods relative reduction was minor, while during the other times dilutions up to a tenth of the original values have occurred.
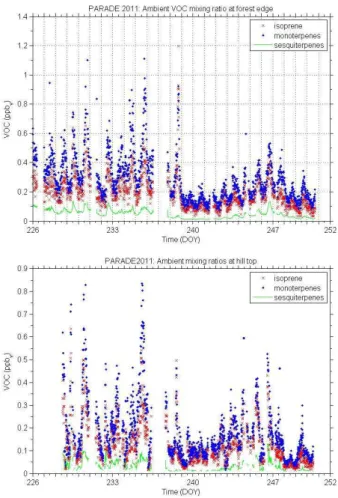
4.2 VOCs and tropospheric basic trace gases
This dilution certainly impacted on the VOC mixing ratios at the hill top. In Fig. 6 the 15
volume mixing ratios of isoprene, mono- and sesquiterpenes are displayed at the forest edge close to the cuvette (top) and at the hill top in the center of the clearing, where most of the measurements were performed and the formation of new particles was investigated. The calculated dilution matches the three different VOC measurements of Bourtsoukidis et al. (2013) and by the MPI Mainz (not shown) performed at the hill 20
top reasonably. A clear decline is apparent for sesquiterpenes since these compounds are additionally reduced by the reaction with ambient ozone. Nevertheless, notable amounts were still present at the center of the hill. The mean and extreme concentra-tions are listed in Table 3.
ACPD
13, 27501–27560, 2013Link between radicals and particle
formation
B. Bonn et al.
Title Page
Abstract Introduction
Conclusions References
Tables Figures
◭ ◮
◭ ◮
Back Close
Full Screen / Esc
Printer-friendly Version Interactive Discussion
Discussion
P
a
per
|
D
iscussion
P
a
per
|
Discussion
P
a
per
|
Discuss
ion
P
a
per
|
4.3 Ozone and NO
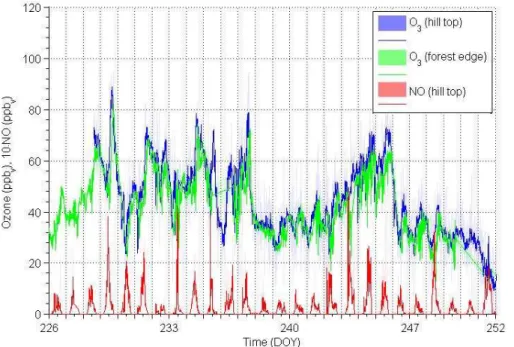
Ozone values were measured at different places, i.e. at the hill top (reference), at the Hessian Agency for the Environment and Geology (Wiesbaden) container and at the forest edge (Fig. 7). In general a minor reduction from hill top to the trees (−2.0±1.3 ppbv) was detected, which was on average about−3.7 ppbvduring daytime
5
(higher at hill top) but changed to an increase of+0.3 ppbv during nighttime (elevated at the forest) The difference is slightly smaller for the hill top and the HLUG measure-ments (−1.9±4 ppbv). Mean ozone mixing ratios at the hill top were (44±15) ppbv.
With respect to NO, the site is notably affected by the transport from Frankfurt and its surrounding traffic routes including motorways, train tracks and the airport. Mean 10
daytime NO mixing ratios were 460 pptv and nighttime ones in the order of 20 pptv. Note that the detection limit for NO was 21 pptv. The detailed pattern of ozone and NO measurements is provided in Fig. 7.
4.4 OH and NO3
For OH approximation individual values of different trace gas measurements and di-15
luted VOCs were selected at the hill top. The results are displayed in Fig. 8 (upper graph) for both methods (see Sect. 3.4), with the black line representing approach (1) and the red line for the OH reactivity approach on the right hand y-axis. The expected daily pattern was found, i.e. showing a clear maximum at highest solar radiation inten-sity and minima during the nights. The maxima of individual days varied as a function of 20
radiation intensity, cloudiness and air pollution between maximum values of several 105 and nearly 107cm−3at noon and values between 100 and 1000 cm−3during nighttime. There are two periods with notable deviation between the J(OD) related and the budgets approaches: the first one is the very first day of the measurements (DOY 226) and the second one is day 238. Both days were days of high relative humidity 25
ACPD
13, 27501–27560, 2013Link between radicals and particle
formation
B. Bonn et al.
Title Page
Abstract Introduction
Conclusions References
Tables Figures
◭ ◮
◭ ◮
Back Close
Full Screen / Esc
Printer-friendly Version Interactive Discussion
Discussion
P
a
per
|
D
iscussion
P
a
per
|
Discussion
P
a
per
|
Discuss
ion
P
a
per
|
results and thus the sink terms that depend on the water uptake of soluble VOCs and the hydronium ion (H3O+) concentration, used for subsequent calculations. Those days were the most humid days during the entire seasonal measurements in 2011 and those exceptional periods occurred during these particular days only. The nitrate radicals (NO3) were measured using Cavity Ring-Down spectroscopy (Crowley et al., 5
2010, 2011), and the data are displayed in the lower graph of Fig. 8. These exhibit the opposite behaviour with maximum concentrations during the night. Mean nighttime NO3 mixing ratios were (21±16) pptv with maximum values during the night between
DOY 227 and 228, 231 and 232 as well as between 243 and 244. The total maximum of 215 pptv was measured at DOY 244.1.
10
4.5 VOC based radicals
Ten minute-averaged concentrations of sesquiterpenes, ozone and water vapour have been used to approximate sCI concentrations and large RO2concentrations based on the mass balance between sources and sinks (bottom graph in Fig. 9) according to Eqs. (9)–(12):
15
[sCI]≈
kO3
MT·[MT][O3]·Ystab,MT+k
O3
LI ·[Linalool][O3]·Ystab,LI
kH2O
sCI ·[H2O]
(9)
+
kO3
SQT·[SQT][O3]·Ystab,SQT
80 s−1
[RO2(terp, day)]=
kMTOH·[MT]+kSQTOH ·[SQT]+P[TOX,d]·kTOX,dOH
·[OH]
kHO2
RO2
·[HO2]+kNO
RO2
·[NO]+kRO2
RO2
·[RO2]+kNO3
RO2
·[NO3]
(10)
≈
kMTOH·[MT]+kSQTOH ·[SQT]+P
[TOX,d]·kTOX,dOH ·[OH]
kHO2
RO2
·[HO2]+kNO
RO2
·[NO]
ACPD
13, 27501–27560, 2013Link between radicals and particle
formation
B. Bonn et al.
Title Page
Abstract Introduction
Conclusions References
Tables Figures
◭ ◮
◭ ◮
Back Close
Full Screen / Esc
Printer-friendly Version Interactive Discussion
Discussion
P
a
per
|
D
iscussion
P
a
per
|
Discussion
P
a
per
|
Discuss
ion
P
a
per
|
[RO2(terp, night)]=
kNO3
MT ·[MT]+k
NO3
SQT·[SQT]+
P
[TOX,n]·kNO3
TOX,n
·[NO3]
kHO2
RO2
·[HO2]+kNO
RO2
·[NO]+kRO2
RO2
·[RO2]+kNO3
RO2
·[NO3]
(11)
≈
kNO3
MT ·[MT]+k
NO3
SQT·[SQT]+
P
[TOX,n]·kNO3 TOX,n
·[NO3]
kHO2
RO2·[HO2]+kRONO2·[NO]+k
NO3
RO2 ·[NO3]
[RO2(terp)]=[RO2(terp, day)]+[RO2(terp, night)] (12)
For both radical groups, i.e. sCI and RO2(terp.) monoterpenes were the most important 5
source class. Equation (9) displays the steady-state approach based on the ozonolysis reactions of monoterpenes, linalool and sesquiterpenes source and the predominant sink reaction with ambient water vapour for monoterpene and linalool derived sCI, while the intramolecular SOZ-formation of sesquiterpene derived sCI is the major sink of the latter. kxy constants represent reaction rate constants as provided by Bourtsoukidis 10
et al. (2012); Shu and Atkinson (1994)and Atkinson et al. (2006) andYstab,i abbreviate the stabilization ratios of linalool or the sum of individual mono- and sesquiterpenes weighted by their contributions to the corresponding terpene class. The following values have been used:Ystab, MT =0.4,Ystab, LI=0.4 andYstab, SQT=0.8.
The sum of individual terpene oxidation product concentrations is abbreviated by 15
([TOX, i]) with a “d” for daytime and an “n” for nighttime’ conditions. This sum times the corresponding reaction rate constants with OH (kTOX,OH i) included the following measured VOCs: nopinone/sabinaketone (mass 138 g mole−1), methyl chavicol (mass 148 g mole−1) (Bouvier-Brown et al., 2009), linalool (mass 154 g mole−1) and pinon-aldehyde/limonaldehyde (mass 168 g mole−1). Nopinone and sabinaketone were not 20
ACPD
13, 27501–27560, 2013Link between radicals and particle
formation
B. Bonn et al.
Title Page
Abstract Introduction
Conclusions References
Tables Figures
◭ ◮
◭ ◮
Back Close
Full Screen / Esc
Printer-friendly Version Interactive Discussion
Discussion
P
a
per
|
D
iscussion
P
a
per
|
Discussion
P
a
per
|
Discuss
ion
P
a
per
|
were taken as the sum of the individual reaction rate constants times the individual contribution of the parent monoterpene to emission (see supp. online information).
With respect to the organic peroxy radicals two aspects are worth mentioning:
(1) Isoprene forms smaller peroxy radicals (RO2(C≤5)) reducing the lifetime and
thus the concentration of (very) large RO2 and therefore counteracting the acti-5
vation (Kiendler-Scharr et al., 2009). Thus, this RO2 was considered only for the total sum of RO2but not for the RO2(terp.) provided in Eqs. (10)–(12).
(2) Investigating the individual contributions to [RO2(C>5)] the contributions of sesquiterpenes and primary oxidation products of monoterpenes (ketones at 138 g mole−1 and aldehydes at 168 g mole−1) are generally minor (10 %). Thus 10
the production of [RO2(C>5)] is found to be primarily controlled by the monoter-pene oxidation.
The calculated [sCI] and [RO2(C>5)] can be seen in Fig. 9.
4.6 Particle formation rate at 3
Next, Eqs. (1)–(3) were used to calculate the formation rate at 3 nm based on the theo-15
ries (A), (B) and (C). The apparentJ3was calculated as the change in interval number concentration between 3 and 5 nm and divided by 600 s due to the time resolution of 10 min of all measurements. Negative values as well as values below 10−3cm−3s−1 were excluded because of the focus on formation and because of the high uncertainty below the smallest value (count rate smaller than 1). A similar approach was done for 20
obtainingJ5that was derived from WCPC measurements (Table 1).
All derived values are displayed in Fig. 10 (top) and zoomed in the bottom plot for the third week with best quantitative measurements available. It is obvious that the total formation rate of particles is rather similar in structure for most of the days with about 0.1 cm−3s−1 during midnight and a maximum of about 100 cm−3s−1 during daytime. 25
During the four weeks of campaign the first ten days were found to have the greatest
ACPD
13, 27501–27560, 2013Link between radicals and particle
formation
B. Bonn et al.
Title Page
Abstract Introduction
Conclusions References
Tables Figures
◭ ◮
◭ ◮
Back Close
Full Screen / Esc
Printer-friendly Version Interactive Discussion
Discussion
P
a
per
|
D
iscussion
P
a
per
|
Discussion
P
a
per
|
Discuss
ion
P
a
per
|
J3 with smaller values between DOY 238 and 240 followed by a subsequent rise to-wards the end of the measurement period. None of the three different theories could be compared to the full dataset, since data gaps occurred particularly for sulphuric acid and VOCs. Therefore we concentrate on the periods of data availability for nearly all of the compounds, i.e. the start and the second half of the campaign. The peaks inJ3 at 5
daily noon-time were calculated by all of the theories, since the entire process seems to be controlled by OH and the condensation sink. However, individual theories indicate a different daily variation. While the organic only hypothesis (C) displays a moderate daily variability due to the permanent presence of VOCs, the availability of ozone and the rather cloudy or rainy conditions, the hypotheses (B) and (A) show substantially 10
greater variability between night- and day-time. The more the hypothesis is bound to sulphuric acid only the stronger the difference between night and day. This is shown in the bottom graph in Fig. 10. In matching the diurnal cycle, theory (C) performs best. In order to check if the exact corresponding size of the particle formation rate matters for the intercomparison, results of particle formation rates at 3 and 5 nm are both shown. 15
This different behaviour is obvious in the mean daily pattern by the measured and the calculated formation rates in Fig. 11. Both approaches (A) and (B) display a strong daily variation, while the organic based approach (C) does not. The reason for this dif-ference is actually the different origins of large organic peroxy radicals at day- (OH) and nighttime (NO3) and the different limitations in the minimum term (Sect. E in supporting 20
online information). This minimum function in Eq. (5) results in a sCI limitation at night-time with notable amounts of large RO2due to high levels of NO3, while at daytime the approach (C) is limited by the large monoterpene derived RO2.
A rather important aspect is the inhomogeneity of the surface resulting in a notable change in local concentrations and sinks, which are measurement point dependent. 25