Soc. Bras. de Arborização Urbana REVSBAU, Piracicaba – SP, v.8, n.3, p 58-74, 2013
INDEX AND PERCENTAGE OF GREEN AREAS IN THE URBAN PERIMETER OF THE CITY OF OURO PRETO, MINAS GERAIS STATE, BRAZIL
Thiago Nogueira Lucon1; José Francisco do Prado Filho2; Frederico Garcia Sobreira3 4.
ABSTRACT
The intense population growth in the city of Ouro Preto, along with the lack of effective environmental policies, brings several consequences for its inhabitants. In an attempt to reverse this situation or, at least minimize these effects, urban environmentalists have developed several tools and strategies to help in the decision-making process of the planning of urban cities, such as the Percentage of Green Areas (PGA) and the Green Area Index (GAI), among others. This study calculated the Population Density (PD), PGA and GAI in the city of Ouro Preto based on IBGE censused from 2007, obtaining the following results: from 27.9 km2 of urban perimeter, approximately 24% (6.69 km2) consists of built-up areas, and 76% (21.09 km2) of green areas. The study shows that the most populous neighborhoods are Padre Faria, Morro Santana, Morro São João, Nossa Senhora das Dores and Vila Aparecida. The areas with higher PD belong to the neighborhoods Vila Itacolomi, Alto da Cruz and São Cristovão. The lowest PGA were found in São Cristovão, Alto da Cruz and Vila Itacolomi neighborhoods and the worst GAI was found in the sectors that comprise the neighborhoods of Vila Itacolomi, Alto da Cruz and São Cristovão. The results of PD, PGA and GAI show that the most critical areas of Ouro Preto belong to Alto da Cruz, São Cristovão and Vila Itacolomi neighborhoods that deserve special attention to their land use, guiding and disciplining the urban occupation.
Key-words: green areas, censused tracts, urban planning.
RESUMO
O forte crescimento populacional da cidade de Ouro Preto (MG) registrado principalmente a partir da década de oitenta, aliado à insistente falta de políticas públicas eficazes vem trazendo inúmeras conseqüências negativas para os seus moradores. Numa tentativa de reverter, ou de pelo menos minimizar estes efeitos, especialistas da área urbano-ambiental desenvolveram diversas ferramentas e estratégias: o cálculo do Percentual de Áreas verdes (PAV), o Índice de Áreas Verdes (IAV), dentre outros, a fim de auxiliar nas tomadas de decisões quanto ao planejamento e a recuperação ambiental do espaço urbano. Este estudo calculou a Densidade Populacional (DP), a Porcentagem de Áreas Verdes (PAV) e o Índice de Áreas Verdes (IAV), para cada setor censitário da cidade de Ouro Preto do IBGE, 2007, obtendo os seguintes resultados: dos 27,9 km2 que compõe o perímetro urbano, aproximadamente, 24% (6,69 km2) se constituí de áreas construídas, e 76% (21,09 km2) de áreas verdes. Os setores censitários mais populosos da cidade estão inseridos nos bairros Padre Faria, Morro Santana, Morro São João, Nossa Senhora das Dores e Vila Aparecida; os setores com Densidades Populacionais (DP) mais elevadas pertencem aos bairros Vila Itacolomi, Alto da Cruz e São Cristóvão; as Porcentagens de Áreas Verdes (PAV) mais baixas foram encontradas nos setores inseridos nos bairros São Cristóvão, Alto da Cruz e Vila Itacolomi e os piores valores para o Índice de Áreas Verdes (IAV) foram encontrados para os setores que compreendem os bairros Vila Itacolomi, Alto da Cruz e São Cristóvão. Analisando os valores de DP, PAV e IAV, nota-se que os setores censitários mais críticos da cidade de Ouro Preto pertencem aos bairros Alto da Cruz, São Cristóvão e Vila Itacolomi, bairros que merecem atenção especial para a utilização e ocupação do seu espaço, sugerindo que os valores obtidos sejam base para orientações e para o disciplinamento da ocupação urbana de suas áreas.
Palavras chaves: áreas verdes, setores censitários, planejamento urbano.
1 . Biólogo especialista em Gestão Ambiental IFMG, mestre em Engenharia Ambiental – UFOP. thiago_lucon@hotmail.com 2 . Ecólogo, Professor Doutor do DEAMB – UFOP, Ouro Preto, MG. jfprado@depro.em.ufop.br
3 . Geólogo, Professor Doutor do DEAMB – UFOP, Ouro Preto, MG 4.
recebido em 25.05.2013 e aceito para publicação em 15.12.2013
INDEX AND PERCENTAGE OF GREEN AREAS IN THE URBAN…
Soc. Bras. de Arborização Urbana REVSBAU, Piracicaba – SP, v.8, n.3, p 58-74, 2013
59
INTRODUCTIONThe city of Ouro Preto, Minas Gerais State, Brazil, is one of best-known historic cities in the country. It is impressive for its historical and architectural heritage preserved from the colonial period of Brazil and known internationally for being the first city listed as historic and cultural patrimony of humanity by the United Nations Educational, Scientific and Cultural Organization (UNESCO), since 1980. Ouro Preto has a colonial architectural inherited from the 18th century, well preserved with imposing and fine examples of religious and civil architecture, built at the height of gold mining exploration period in Minas Gerais State. In addition, Ouro Preto holds several historic, artistic and natural attractions, mainly because it is located in an ecotonal area of the Atlantic Forest and Cerrado biomes in Brazil. However, lack of urban planning, inspection and discipline, especially in terms of the occupation of areas geologically unsuitable for human settlements, is allowing the onset of numerous geotechnical problems related to the misuse of physical space, with increased risks to the population with eventual human losses (SOBREIRA & FONSECA, 2001).
The growth of Ouro Preto City, mainly in the last thirty years, along with lack of effective urban public policy, brought numerous negative consequences to the local community. The intense urbanization, mostly in recent years, makes the city increasingly unfit for human occupation, whether by the concentration of local population, lack of green areas, increased pollution, widespread degradation and risk of natural or anthropic disasters (LIMA NETO et al., 2007). The anthropization of these areas,
which began during the colonial period, has caused numerous accidents of landslides in city periphery as the disastrous landslides in 1979 (PINHEIRO et al, 2003), in late 2011 and early 2012, with fatalities.
The reduction of urban green areas affects directly on the welfare of the local community and the anthropization of these spaces implies directly in a reduction of species diversity of the flora and fauna, which ultimately causes huge losses to the local urban ecosystem.
According to Grey & Deneke (1978), Llardent (1982), Di Fidio (1990), Lombardo (1985), Cavalheiro & Del Picchia (1992), Guzzo (1999), Milano (1990, 1992, 1994, 1995), Dalcin (2000) & Andrade (2001), we can highlight the following benefits provided by green areas in the urban environment:
- They contribute to the reduction of air pollution, through oxygenation processes, gases recycling in photosynthetic processes, fixing toxic gases, and on the retention of physical particulates in the air.
- They affect positively on sunlight incidence and air temperature, softening extreme temperatures, improving air humidity and preserving soil moisture.
- They reduce the runoff of impermeable areas, shelter the fauna and influence on regional water balance.
- They convey psychological well-being, beautify urban spaces, promote interaction between human activities and the environment and buffer noises.
Thiago Nogueira Lucon et al.
Soc. Bras. de Arborização Urbana REVSBAU, Piracicaba – SP, v.8, n.3, p 58-74, 2013
60
contributing to the formation and improvement of the aesthetic sense, thus, they are vital elements for the urban environment. It is unquestionable; therefore, the important role that the green areas play in cities.
To quantify these areas and their benefits, several indexes were developed as tools for urban and environmental planning, such as: Population Density (PD), which analyzes the relationship between the population and the urban area; Percentage of Green Areas (PGA), which quantifies the built-up areas of the city; Green Areas Index (GAI), which establishes the relationship between the remaining green areas and the resident population; Urban Afforestation Index (UAI), which is concerned with the wooded spaces; Index of Free Spaces of Public Use (IFSPU), which accounts for all public green areas; Index of Vegetation Cover in Urban Area (IVCUA), which represents the percentage of area covered by vegetation considering the total area of study.
According to Caporusso & Matias (2008), some researchers mistakenly understand the IVCUA, IFSPU and IVCUA as synonyms to the GAI. Most of these indexes consider only the spaces of public use and cannot be classified as the GAI of a city or urban portion.
Also according to Caporusso & Matias (2008), the GAI is one of the most commonly used indexes to analyze spatial distribution of urban vegetation, and is often used to compare quantities of green areas between different cities, neighborhoods or censused areas of the same city. For Henke-Oliveira (1996), the GAI is critical for urban planning, because it allows
to observe the population dynamics and its relationship with the green areas in the urbanized environment, allowing public authorities to provide public areas to meet the demands for green areas and urban equipment. The most widely used method for calculating the GAI considers the product of the division between the sum of the green areas and the number of residents. A refined alternative for the estimation of the GAI considers the spatial distribution of green areas, in addition to factors related to the distribution of benefits in a given geographical area, such as a circle or a polygon (ZANIN et al., 2007).
In Brazil, the value of 12 m² of green area per inhabitant is used for the GAI, often cited as a recommendation of the United Nations (UN). However, if this recommendation is followed, the value should be 13 m2/inhabitant, the basic GAI used in Germany, according to Cavalheiro & Del Picchia (1992). For the Brazilian Society of Urban Afforestation, the minimum required of public green areas for recreation is 15 m2/inhabitant (SBAU, 1996).
INDEX AND PERCENTAGE OF GREEN AREAS IN THE URBAN…
Soc. Bras. de Arborização Urbana REVSBAU, Piracicaba – SP, v.8, n.3, p 58-74, 2013
61
MATERIAL AND METHODSStudy site
The municipality of Ouro Preto is located in the central region of Minas Gerais State, surrounded by the municipalities of Catas Altas of Noruega, Itaverava, Ouro Branco and Congonhas, to the South; Belo Vale and Moeda to the West ; Mariana, to the East; Itabirito and Santa Barbara, to the North. The municipality covers as area of 1,245.9 km2 and has a total population
of 70,281 inhabitants, with 40,214 inhabitants residing the urban area and corresponding to a PD of 56.41 inhab/km2 (IBGE, 2010).
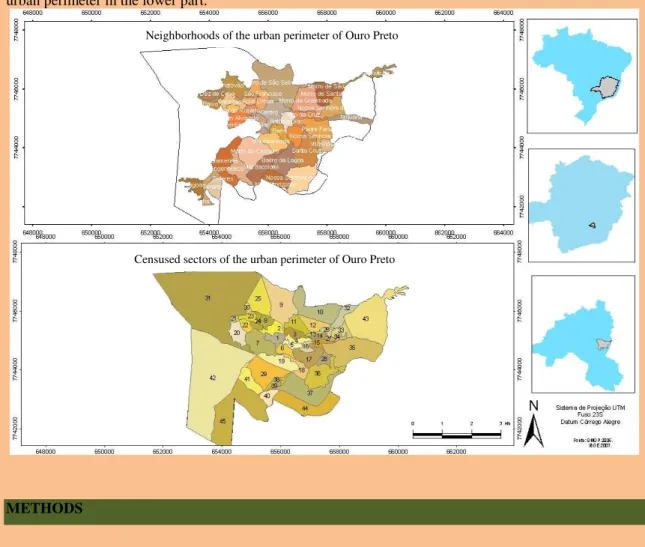
The study area, where were the PGA and GAI were calculated, comprises the entire urban perimeter amounting 27.71 Km2 distributed over 45 censused sectors (IBGE, 2007) and 38 neighborhoods (Figure 1). We observed that much of the urban periphery is not located in neighborhoods, but within the local censused sectors.
Figure 1: Map of Ouro Preto City with the districts in the upper part and the censused sectors within the urban perimeter in the lower part.
METHODS
Neighborhoods of the urban perimeter of Ouro Preto
Thiago Nogueira Lucon et al.
Soc. Bras. de Arborização Urbana REVSBAU, Piracicaba – SP, v.8, n.3, p 58-74, 2013
62
In this study, we used and calculated different urban indexes as follows:
• Population density (PD), expressed in inhab/ m2;
• Percentage of Green Areas (PGA), expressed in percentage (%);
• Green Areas Index (GAI), expressed m2 of green area per inhabitant (inhab/m2).
To calculate the PD in the urban perimeter, we superimposed the following cartographic bases:
• Limit of Urban Perimeter of Ouro Preto (LUPOP) and
• Survey of the population censused for the censused sector of 2007 (IBGE).
For the calculations, we used census data from 2007, because it is arranged by censused sectors. The new data generated from the IBGE census of 2010 were not used in this study, because that institute is still processing them. The censused sectors are demarcated by IBGE, obeying the criteria of operationalization for data collection, in such a way that they cover an area that can be covered by a single census collector in a month, comprising around 250 to 350 households (in urban areas). To carry out the demographic census of 2007, the IBGE divided the Brazilian territory into 159,821 censused sectors of which 18,799 belonged to the Minas Gerais State.
For statistical purposes, the boundaries of censused sectors must respect territorial limits legally defined and established, such as the urban perimeter of the city, but do not have any relationship with the boundaries of the city neighborhoods. They should only be contained within the urban perimeter, which makes it
difficult to obtain reliable statistical data, such as the PD, of each city neighborhood.
To obtain the values of PGA, we overlapped the following cartographic bases:
• Map of green areas located in the urban perimeter (LUCON, 2011).
• Map of the delimitation of urban perimeter and neighborhoods of Ouro Preto (Municipal Secretary of Public Heritage of Ouro Preto - SMPOP).
After overlapping the bases, we obtained the values for PGA of the urban perimeter and for each censused sector.
The PGA is obtained by the simple three rule, where:
Study Site __________100 % Green Areas____________X %
The method used to calculate the GAI considers the product of the division between the sum of the green areas by the number of inhabitants, resulting in a simplified calculation, and this index is always dependent on demographic factors.
To obtain the GAI, it was necessary to overlap the following cartographic bases:
• Map of green areas located in the urban perimeter (LUCON, 2011).
• Map of the delimitation of urban perimeter and neighborhoods of Ouro Preto (Municipal Secretary of Public Heritage of Ouro Preto - SMPOP). • Map with the demographic distribution
INDEX AND PERCENTAGE OF GREEN AREAS IN THE URBAN…
Soc. Bras. de Arborização Urbana REVSBAU, Piracicaba – SP, v.8, n.3, p 58-74, 2013
63
After overlapping the bases, we obtained theGAI for the urban perimeter and the censused sectors of Ouro Preto. In this study, it was not possible to obtain the GAI in every neighborhood of Ouro Preto City, due to the incongruity of cartographic bases with the
delineation of neighborhoods and censused sectors. According to the IBGE (2007), the city has 45 censused sectors, but according the Municipal Secretary of Public Heritage of Ouro Preto (SMPOP), there are 38 neighborhoods in the urban perimeter.
RESULTS
To obtain the indexes, it was necessary to identify the location and size of green areas in urban area, the boundaries of the urban periphery and neighborhoods of the city and the demographic distribution of each censused sector, according to the IBGE census (2007).
Population and PD of censused sectors of Ouro Preto
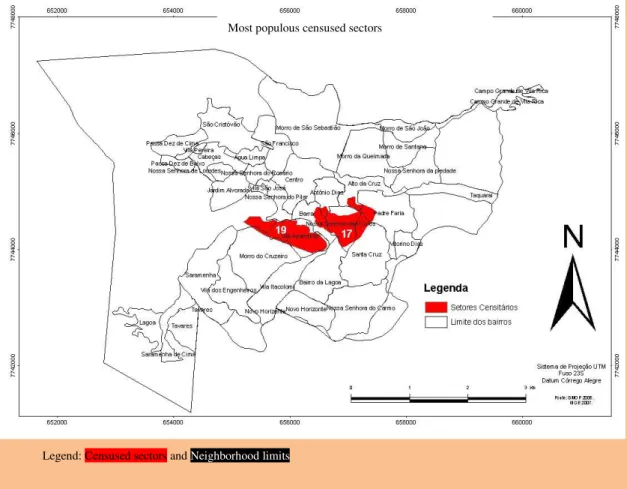
According with the overlapping of cartographic bases described, the urban periphery of Ouro Preto has a total population of 37,918 inhabitants (IBGE, 2007) distributed in 45 censused sectors. Using data of the Pro-rectory of undergraduate studies (PROGRAD) and obtained from the Sector of Diplomas and certificates of the Rectory of Research and Graduate Studies (PROPP) from the Universidade Federal de Ouro Preto (UFOP), the number of students enrolled in undergraduate courses in 2011 offered at Campus Morro do Cruzeiro and Historic Campus is 5,962, while 646 are graduate students. In addition, the population of students enrolled at Instituto Federal de Minas Gerais (IFMG) totals 1,361 students, of which 577 come from other cities.
Thus, based on the hypothesis that students from UFOP and IFMG are mostly from other
cities, 7,187 students are considered by the IBGE as floating population of Ouro Preto; therefore, they are not counted in the city census, which can generate false interpretations of the PD of the city and of their respective censused sectors.
Thiago Nogueira Lucon et al.
Soc. Bras. de Arborização Urbana REVSBAU, Piracicaba – SP, v.8, n.3, p 58-74, 2013
64
Figure 2: Map of the urban area of Ouro Preto showing the location of the two most populous censused sectors of the city (IBGE, 2007).
Table 1: Population by censused sector of Ouro Preto City. Censused
Sector Population (inhab.) Censused Sector Population (inhab.) Censused Sector Population (inhab.),
1 397 16 951 31 1,088
2 743 17 1,371 32 1,330
3 871 18 683 33 1,090
4 754 19 1,442 34 597
5 687 20 999 35 593
6 589 21 67 36 999
7 1,114 22 682 37 1,108
8 750 23 633 38 1,099
9 745 24 683 39 606
10 454 25 966 40 990
11 549 26 662 41 587
12 854 27 753 42 879
13 495 28 1,239 43 845
14 782 29 916 44 958
15 1,324 30 850 45 1,124
Most populous censused sectors
INDEX AND PERCENTAGE OF GREEN AREAS IN THE URBAN…
Soc. Bras. de Arborização Urbana REVSBAU, Piracicaba – SP, v.8, n.3, p 58-74, 2013
65
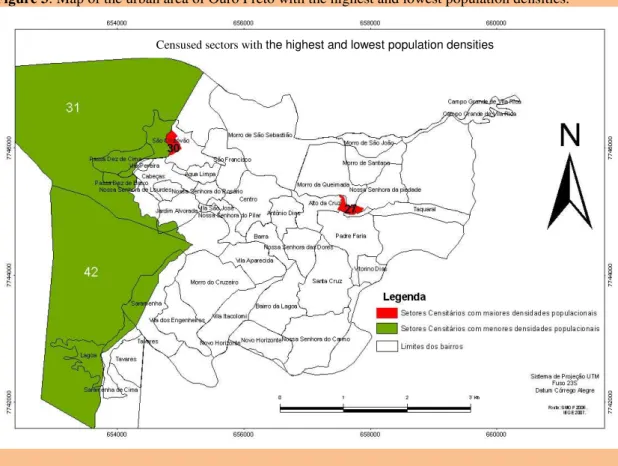
The values for greater and lower PD arepresented in Figure 3 and Table 2. The censused sectors with a higher PD were sector 27 with 9.457 inhab/m2, and sector 30 with 15.060
inhab/m2. Censused sector 27 is located in Bairro Alto da Cruz neighborhood and sector 30, in the São Cristóvão neighborhood.
Figure 3: Map of the urban area of Ouro Preto with the highest and lowest population densities.
Legend: Censused sectors with the highest population densities; Censused sectors with the lowest population densities; Neighborhood limits
The censused sectors with the lowest PD are 42 and 31. The first comprises the Lagoa neighborhood and parts Saramenha and the
second comprises the neighborhoods Passa Dez de Cima, Passa Dez de Baixo and São Cristóvão.
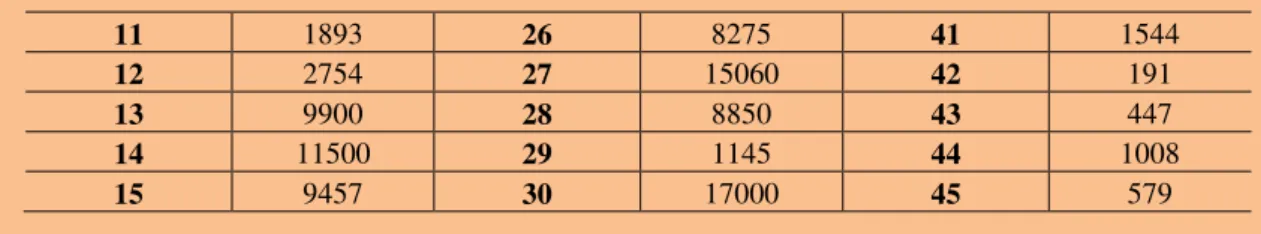
Table 2: Population densities by censused sector in the city of Ouro Preto. Censused
Sector PD
Censused
Sector PD
Censused
Sector PD
1 1804 16 7925 31 197
2 3377 17 3115 32 4925
3 4838 18 2845 33 5736
4 5026 19 3353 34 8528
5 6870 20 3027 35 452
6 3272 21 1155 36 1407
7 1826 22 5246 37 1045
8 5000 23 4521 38 9158
9 723 24 4878 39 10100
10 498 25 1590 40 4714
Thiago Nogueira Lucon et al.
Soc. Bras. de Arborização Urbana REVSBAU, Piracicaba – SP, v.8, n.3, p 58-74, 2013
66
11 1893 26 8275 41 1544
12 2754 27 15060 42 191
13 9900 28 8850 43 447
14 11500 29 1145 44 1008
15 9457 30 17000 45 579
Percentage of green areas (PGA)
To calculate the PGA, all the green areas of the city are considered, whether they are composed of herbaceous, shrubby, arboreal vegetation or if they are reforested areas with eucalyptus trees, while the other typologies namely built-up areas, streets and bare soil were classified as urbanized areas.
The urban perimeter of Ouro Preto has 75.84% of green areas and 24.16% of urbanized areas, corresponding respectively to 21.16 km2 and
6.74 km2. Importantly, the population data are from 2007, while the map of green areas of the urban perimeter is 2010.
The values of the PGA of the 45 censused sectors range from 7.13% to 94.41% (Table 3). Figure 4 shows the best and worst values of PGA.
Figure 4: Map showing the distribution of the best and worst values of the PGA.
Legend: Censused sectors with the best PGA; Censused sectors with the worst PGA; Neighborhood limits
INDEX AND PERCENTAGE OF GREEN AREAS IN THE URBAN…
Soc. Bras. de Arborização Urbana REVSBAU, Piracicaba – SP, v.8, n.3, p 58-74, 2013
67
The worst result for the PGA was for thecensused sector 39, inserted into Vila Itacolomi neighborhood, with 7.13% of green areas. The best result was observed in the censused sector 31, which comprises a large part of areas not belonging to any neighborhood (located in the
Northwest of the urban perimeter of Ouro Preto) and encompasses the neighborhoods Bairro Passa Dez de Cima and part of São Cristóvão and Passa Dez de Baixo, with 94% of green areas.
Table 3: Percentage of green areas by censused sector in the city of Ouro Preto. Censused
Sector PGA (%) Censused Sector PGA (%) Censused Sector PGA (%)
1 24.33 16 33.41 31 94.41
2 52.56 17 77.27 32 42.23
3 46.74 18 61.67 33 47.23
4 30.28 19 55.97 34 21.13
5 29.56 20 76.17 35 76.31
6 51.81 21 40.45 36 68.93
7 79.4 22 48.84 37 59.09
8 44.74 23 35.24 38 11.29
9 83.46 24 40.99 39 7.13
10 85.37 25 81.44 40 39.79
11 78.36 26 45.94 41 64.3
12 74.18 27 24.57 42 84.56
13 33.43 28 38.92 43 88.83
14 13.92 29 48.21 44 73.82
15 22.41 30 14.15 45 80.5
Green Areas Index (GAI)
To calculate the GAI, we used the following formula:
GAI= Green areas (m2) Inhabitants
Where: green areas = herbaceous, shrubs, arboreal vegetation and replanting with eucalyptus trees.
In an attempt to obtain GAI values that better represented the reality of Ouro Preto, we simulated three situations. In the first, we considered all the green areas of the urban
perimeter and the urban population censed by IBGE (2007).
∴GAI = Green areas = 21,161,215 = 556.697 m2 of green area/ inhabitant.
Inhabitants 37,918
In the second situation, we considered all the green areas of the urban perimeter, adding the floating population of 7,185 inhabitants to the population of 37,918 inhabitants censed by IBGE (2007). (IAV = green areas = 21,161,215 = 469.175 m2 of green area per inhabitant.
∴GAI = Green areas = 21,161,215 = 469.175 m2 of green area/ inhabitant.
Thiago Nogueira Lucon et al.
Soc. Bras. de Arborização Urbana REVSBAU, Piracicaba – SP, v.8, n.3, p 58-74, 2013
68
In the third situation, we included the green areas inserted into the areas occupied by the neighborhoods with the floating population (students) along with population provided by the IBGE (2007).
∴GAI = Green areas = 8,679,545 = 192.438 m2 of green area/ inhabitant.
Inhabitants 45,103
We observed that the first situation exhibits the highest GAI value, for having included areas that are within the urban perimeter of Ouro Preto City and its censused sectors, but it did not include areas within the city neighborhoods in its formulation. In contrast, the third situation presented the lowest GAI value for having excluded from its calculation the areas not
inserted into the city neighborhoods and included the floating population.
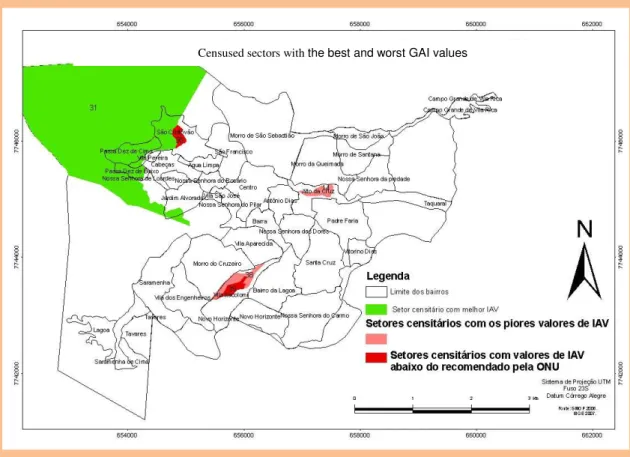
Figure 5 shows the location of the best and worst values for GAI. We can observe in Table 4 the four censused sectors (38, 14, 30 and 39) comprising part of São Cristovão, Vila Itacolomi and Alto da Cruz neighborhoods, where the GAI is below the recommended values by the Brazilian Society of Urban Afforestation (SBAU), which is 15 m2 of green area per inhabitant. Two censused sectors (30 and 39) are below the recommended values by the UN, which is 12 m2 of green area per inhabitant.
Figure 5: Map showing the distribution of the worst and best values of the GAI.
Legend: Neighborhood limits; Censused sectors with the best GAI; Censused sectors with the best GAI; Censused sectors with the worst GAI values below recommendations of the UN
INDEX AND PERCENTAGE OF GREEN AREAS IN THE URBAN…
Soc. Bras. de Arborização Urbana REVSBAU, Piracicaba – SP, v.8, n.3, p 58-74, 2013
69
The worst value of GAI was obtained for thecensused sector 39, inserted into part of Vila Itacolomi, with 7.5 m2 of green area per inhabitant. The best GAI was observed in sector 31, which comprises the neighborhood Bairro Passa Dez de Cima and parts São Cristóvão and
Passa Dez de Baixo, with 4797 m2 of green area per inhabitant. Part of this censused sector is outside the areas of neighborhoods, according to the Municipal Secretary of Public Heritage of Ouro Preto, which has a small population that reflects directly on the high GAI value.
Table 4: GAI values by censused sectors of Ouro Preto City. Censused
Sector GAI Censused Sector GAI Censused Sector GAI
1 135.46 16 44.05 31 4797.08
2 15.2 17 253.04 32 88.47
3 99.7 18 220.32 33 83.75
4 60.9 19 168.71 34 25.67
5 46.03 20 255.67 35 1688.78
6 164.93 21 353.48 36 496.72
7 419.2 22 97.25 37 569.18
8 94.74 23 78.5 38 12.44
9 1124.6 24 86.48 39 7.5
10 1726.29 25 517.52 40 87.4
11 428.12 26 57.19 41 421.12
12 275.46 27 17.77 42 4425.68
13 34.05 28 46.56 43 1997.1
14 12.24 29 426.13 44 738.61
15 23.88 30 9.19 45 1391.83
DISCUSSION
For statistical purposes of IBGE, limits for censused sectors must respect territorial limits legally defined and established as the urban perimeter of the city, but they do not have any relation with the boundaries of neighborhoods and are contained within the urban perimeter, which makes it difficult to obtain statistical data such as PD and GAI of city neighborhoods. There is no census conducted on the local population in the neighborhoods of the city.
Population and PD of censused sectors of Ouro Preto
Thiago Nogueira Lucon et al.
Soc. Bras. de Arborização Urbana REVSBAU, Piracicaba – SP, v.8, n.3, p 58-74, 2013
70
are aggravated due to the irregular occupation of risk areas, such as the Areas of Permanent Protection (APPs) with declivities higher than 45°. In addition to inadequate construction practices, occupation of former mining areas and residue dumps of those past activities, improper disposal of construction waste and debris, lack of basic sanitation (sewage clearance), precarious drainage systems, low quality of residential buildings, among other problems.
We observed that the neighborhoods with greater PD, São Cristóvão and Alta Cruz, were reported by Castro (2006) as those with numerous accidents with landmass movements, caused by the misuse of physical space and its high PD.
Information related to the population and PD per censused sector is of paramount importance for the management of the municipality, because it indicates the need for further demand for monitoring and planning, to meet the needs of the local population and to ensure the conservation and recovery of remaining of APPs. Also, it helps to prevent issues related to the irregular occupation of possible risk areas.
Percentage of green areas (PGA)
For Cavalheiro et al. (1999 apud Buccheri Filho & Nucci, 2006), vegetation and permeable urban land should account for at least 70% of the area, offering various uses and environmental services to the population. However, we observed that 31 of the 45 censused sectors of the urban perimeter of Ouro Preto have PGA lower than 70% and eight have PGA lower than 25%, considered critical levels, demonstrating the pressure exerted by tree
removal from these areas over the years, reflecting directly on suppression of urban APPs.
Green Areas Index (GAI)
According to Caporusso & Matias (2008), lack of consensus regarding the term “green urban areas” reflects, among other consequences, the difficulty for mapping and classification/categorization of these areas, in addition to the useless attempts of comparison between different GAI obtained with the use of different methodologies for different cities. The need of knowledge of these areas in the urban environment is mainly due to the functions that they play in the improvement of environmental and living conditions of the population, in the built-up landscape diversification, in psychological and landscaping aspects, among other benefits. The results of GAI for Ouro Preto city were very high in relation to other Brazilian cities such as Curitiba (Paraná State), with 9.55 m2 (considered an ecological city of Brazil); Bauru (São Paulo State), with 6.29 m2 (OLIVEIRA et
INDEX AND PERCENTAGE OF GREEN AREAS IN THE URBAN…
Soc. Bras. de Arborização Urbana REVSBAU, Piracicaba – SP, v.8, n.3, p 58-74, 2013
71
In some studies, the green areas are mappedwithout criteria for classification or categorization, showing only public and/or private areas, but in others, we observe the concern with the most appropriate classification of the study area, with the different definitions of green areas.
Jesus & Braga (2005) obtained for the urban area of the resort of Águas de São Pedro (SP), the GAI of 936.095, in which the high values observed are due to small population size and the small territory of the city.
In Ouro Preto, the GAI is considered high in certain censused sectors, not only because of the amount of green areas still available, but also due to the reduced population in these censused sectors, which display local particularities considered difficult for occupation either by extremely rugged topography, precarious urban infrastructure and general land instability, due to its geological and geotechnical characteristics. Censused sector 30, which is formed by a large part of São Cristóvão Neighborhood, has the highest PD in Ouro Preto City, with 17,000 inhabitants/km2, an index that directly influences the PGA, (14.15%), reflecting on the GAI, with 9.19 m2 of green area/inhab.
Censused sector 14 is formed by a part Alto da Cruz neighborhood, and sectors 38 and 39, both located in Vila Itacolomi, deserve special attention, as they have the worst values of PD, PGA and GAI; therefore, the municipal
government needs to intensify inspection of land use in these places and better plan future growth.
The interpretation of the indexes showed that the censused sectors with the worst values of PD, PGA and GAI are sectors 14, 30, 38 and 39, which are inserted in the neighborhoods Alto da Cruz, Vila Itacolomi and São Cristovão, therefore the most critical in the city.
We observed that these indexes tend to the same result, since in all of them, the population is considered, even in the GAI, which does consider the population directly, but the number of built-up areas and streets in its calculation. The GAI can be an important index to guide the urban “re” planning, informing the highly anthropized areas and showing the balance or imbalance regarding the occupation of the censused sectors and neighborhoods of a city. According to Jesus & Braga (2005), environmental quality indexes report the conditions of the environment, establishing targets, evaluating temporal variations, and the GAI should be calculated for each category, as it identifies its abundance or scarcity.
CONCLUSION
The calculation of the population, the PD, PGA and GAI can be regarded as another tool to guide the planning, or “re” planning of urban
environments, indicating highly populated areas or areas with little remaining green.
Thiago Nogueira Lucon et al.
Soc. Bras. de Arborização Urbana REVSBAU, Piracicaba – SP, v.8, n.3, p 58-74, 2013
72
censused sectors; however, lack of scientific consensus with regard to the term “green areas” and the lack of criteria for their categorization affect comparisons with the GAI obtained in different urban areas.
We hope that the Municipal, State and Federal governments use the results of this research in deliberations regarding effective planning of urban environments.
ACKNOWLEDGMENTS
The authors wish to thank Master’s Program of Environmental Engineering – PROAGUA/UFOP and CNPq/Capes for the grants and Secretary of Public Heritage of the
City of Ouro Preto and the Brazilian Institute of Geography and Statistics (IBGE) for the supplying the data for the research.
REFERENCES
ANDRADE, R. V. O processo de produção dos parques e bosques públicos de Curitiba. Dissertação (Mestrado em Geografia). Setor de Ciências da Terra, Universidade Federal do Paraná, Curitiba, 127p. 2001.
BUCCHERI FILHO, I. A. T.; NUCCI, J. C. Espaços livres, áreas verdes e cobertura vegetal no bairro alto da XV, Curitiba/PR, Revista do Departamento de Geografia, nº18, p 48-59, 2006.
CAPORUSSO, D. & MATIAS, L. F. Áreas verdes urbanas: avaliação e proposta conceitual. In: 1° Simpósio de Pós-Graduação em Geografia do Estado de São Paulo. SIMPGEO-SP. VIII SEMINÁRIO DE PÓS-GRADUAÇÃO EM GEOGRAFIA DA UNESP - Rio Claro, SP. Anais... Campus Bela Vista – UNESP. 17-19 de novembro de 2008.
CARVALHO, L. M. Áreas verdes da cidade de Lavras/MG: caracterização, usos e necessidades. Dissertação (Mestrado) – Universidade Federal de Lavras. 115 p.2001.
CASTRO, J. M. G. Pluviosidade e movimentos de massa nas encostas de Ouro Preto. Dissertação (Mestrado em Engenharia Civil), Universidade Federal de Ouro Preto - UFOP, 114p. 2006.
CAVALHEIRO, F. & DEL PICCHIA, P. C. D. Áreas Verdes: Conceitos, objetivos e diretrizes para o planejamento. In: CONGRESSO BRASILEIRO SOBRE ARBORIZAÇÃO URBANA, 1, 1992. Anais... p. 29-38, Vitória - ES, 1992.
CAVALHEIRO, F.,NUCCI, J.C.; GUZZO, P.; ROCHA, Y.T. Proposição de terminologia para o verde urbano. Boletim Informativo. Rio de Janeiro: Sociedade Brasileira de Arborização Urbana - SBAU, ano VII, n.3, jul/ago/set-1999, p.7.
DALCIN, E. Arborização de vias públicas. Rio de Janeiro: Light, 2000.
HARDER, I. C. F.; RIBEIRO, R. C. S. & TAVARES, A. R. Índices de área verde e cobertura vegetal para as praças do município de Vinhedo, SP. Revista Árvore, v.30, n.2: 277-282. 2006.
DI FIDIO, M. Architettura del paesaggio. 3.ed. Milano: Pirola Editores, 1990.
INDEX AND PERCENTAGE OF GREEN AREAS IN THE URBAN…
Soc. Bras. de Arborização Urbana REVSBAU, Piracicaba – SP, v.8, n.3, p 58-74, 2013
73
GUZZO, P. Estudos dos espaços livres de uso público e da cobertura vegetal em área urbana dacidade de Ribeirão Preto, SP. 106 pág. Dissertação (Mestrado em Geociências). Instituto de Geociências e Ciências Exatas, Universidade Estadual Paulista, Rio Claro. 1999.
HENKE-OLIVEIRA, C. Planejamento ambiental da cidade de São Carlos (SP) com
ênfase nas áreas públicas e áreas verdes: diagnósticos e propostas. Dissertação (Mestrado em Ecologia) – Universidade Federal de São Carlos. UFSCAR, São Carlos,
181p. 1996.
IBGE– INSTITUTO BRASILEIRO DE GEOGRAFIA E ESTATÍSTICA. Censo demográfico 2007. Disponível em: <http://www.ibge.gov.br/cidadesat/topwindow.htm
Acessado em Novembro de 2010.
IBGE – INSTITUTO BRASILEIRO DE GEOGRAFIA E ESTATÍSTICA. Censo Demográfico 2010. Disponível em: http://www.ibge.gov.br/cidadesat/topwindow.htm?
Acessado em Maio de 2011.
JESUS, S. C. & BRAGA, R. Analise espacial das áreas verdes urbanas da estância de Águas de São Pedro – SP. Revista Caminhos da Geografia 18 (16) 207 – 224. 2005.
LIMA NETO, E.M.; RESENDE, W.X.; SENA, M.G.D.; SOUZA, R.M. Análise das áreas verdes das praças do bairro centro e principais avenidas da cidade de Aracajú-SE. Revista da Sociedade Brasileira de Arborização Urbana, v.2, p.17-33, 2007.
LIMA, A. M. L. P. Análise da arborização viária na área central e em seu entorno.
1993. 238f. Tese (Doutorado em Fitotecnia - USP) – Escola Superior de Agronomia “Luiz de Queiroz”, Piracicaba, 1993.
LLARDENT, L. R. A. Zonas verdes y espaços livres en la ciudad. Madrid: Closas. Orcoyen, 1982.
LOMBARDO, M. A. Ilha de calor nas metrópoles. São Paulo: Hucitec, 1985.
LUCON, T. N. Análise espacial das áreas verdes do perímetro urbano de Ouro Preto (MG). Dissertação (Mestrado) - Universidade Federal de Ouro Preto. Instituto de Ciências Exatas e Biológicas. Programa de Pós-Graduação em Engenharia Ambiental. 169 f. 2011.
MATIAS, L. F.; CARVALHO, J.C.B.; MARGUTI, B.O.; FARIAS, F.O. Mapeamento do uso da terra na cidade de Paulínia (SP): desenvolvimento de aspectos metodológicos para detalhamento intra-urbano. Anais... XV ENCONTRO NACIONAL DE GEÓGRAFOS, São Paulo, 2008.
MILANO, M. S. Planejamento da arborização urbana: relação entre áreas verdes e ruas arborizadas. In: ENCONTRO BRASILEIRO SOBRE ARBORIZAÇÃO URBANA, 4,
1990. Curitiba. Anais... Curitiba: Sociedade Brasileira de Arborização Urbana, 1990.
MILANO, M. S. A cidade, os espaços abertos e a vegetação. In: CONGRESSO BRASILEIRO SOBRE ARBORIZAÇÃO URBANA, 1, 1992. Vitória. Anais... Vitória: Sociedade Brasileira de Arborização Urbana, p.3-13. 1992.
MILANO, M. S. Arborização urbana: Plano Diretor. In: CONGRESSO BRASILEIRO SOBRE ARBORIZAÇÃO URBANA, 2, 1994. São Luis. Anais... São Luis: Sociedade Brasileira de Arborização Urbana, 613p. p.207-215. 1994.
MILANO, M. S. Arborização urbana. Curitiba: UFPr, Apostila. 1995.
OLIVEIRA, C.H.; SANTOS, J.E. ; PIRES, J.S.R. Indicadores de arborização urbana da cidade de São Carlos (SP) com o uso do SIG-IDRISI. Brazilian Journal of Ecology, ano 03, n.1, p. 01-09. 1999.
Thiago Nogueira Lucon et al.
Soc. Bras. de Arborização Urbana REVSBAU, Piracicaba – SP, v.8, n.3, p 58-74, 2013
74
SOCIEDADE BRASILEIRA DE ARBORIZAÇÃO URBANA – SBAU. “Carta a Londrina e Ibiporã”. Boletim Informativo, v.3, n.5, p.3, 1996.
ZANIN, E. M.; ROSSET, F.; DALAVALE, L. C. Índice de áreas verdes públicas para o município de Getúlio Vargas, RS. In: Anais do VIII Congresso de Ecologia do Brasil. Caxambu, MG. 23 a 28 de Setembro de 2007.
Thiago Nogueira Lucon
Avenida das Andorinhas nº 177 i – Morro São João – Ouro Preto – Minas Gerais - Brasil.