*Correspondence
Serviço de Endocrinologia do Hospital de Clínicas de Porto Alegre
Rua Ramiro Barcelos 2350, Prédio 12, 4º andar, 90035-003, Porto Alegre, RS, Brasil.
[email protected] Phone: + 55 51 21018127 Fax: + 55 51 2101 8777
Summary
risk factors for micro and macrovascular disease in black and white patients with type 2 Diabetes mellitus
Background. The prevalence of chronic complications in type 2 diabetes mellitus (DM) is higher in
black patients. The reason for this inding is still unknown. The objective of this study was to analyze the micro and macrovascular risk factor proile of type 2 DM patients without advanced diabetic
nephropathy according to ethnicity.
Methods. A cross-sectional multicentric regional study was conducted evaluating 780 patients. All
patients were submitted to clinical and laboratory evaluation. Ethnicity was self-reported as white (n
= 585) or black (n = 195).
results. Black patients had lower triglycerides [115 (35-892) vs. 152 (34-1236) mg/dl; P <0.001]
and higher HDL-cholesterol levels than whites (48.3 ± 13.5 vs. 44.8 ± 12.1 mg/dl; P = 0.002).
White and black patients did not differ regarding fasting plasma glucose, A1c test, total and LDL
cholesterol, blood pressure levels, insulin and HOMA-IR. There were no differences between groups regarding medication in use (statin: 18.5 vs. 19.3%, P = 1.000; ibrates: 1.5 vs. 0.7%, P = 0.680; angiotensin converting enzyme inhibitors: 39.5 vs. 43.8%, P = 0.375; acetylsalicylic acid: 29.9 vs. 27.7%, P = 0.673).
conclusions. There were no differences in the prevalence of the classic micro and macrovascular risk
factors between ethnic groups. The study of non-conventional risk factors and genetic factors is essen
-tial to understand determinants of the worst outcomes presented by the African-Brazilian population.
Keywords: Diabetes mellitus. Ethnicity. Chronic complications. Risk factors.
risk
factors
for
Micro
and
Macrovascular
disease
in
Black
and
white
patients
with
type
2
diaBetes
Mellitus
caroline kaercher kraMer1, cristiane BauerMann leitão2, lana catani pinto3, patricia Bolson4, Juliana Boza4, sandra pinho silveiro5, Jorge luiz gross6, luis henrique canani*7
Trabalho realizado no Serviço de Endocrinologia do Hospital de Clínicas de Porto Alegre, RS, Brasil
1. Médica Endocrinologista, aluna do programa de doutorado em Endocrinologia da Universidade Federal do Rio Grande do Sul - UFRGS, Porto Alegre, RS 2. Médica do Serviço de Endocrinologia do Hospital de Clínicas de Porto Alegre, Porto Alegre, RS
3. Acadêmica de Medicina do Serviço de Endocrinologia do Hospital de Clínicas de Porto Alegre, Porto Alegre, RS 4. Médicas Residentes do Hospital de Clínicas de Porto Alegre, Porto Alegre, RS
5. Professora Adjunta do Serviço de Endocrinologia do Hospital de Clínicas de Porto Alegre, Porto Alegre, RS 6. Professor Titular e Chefe do Serviço de Endocrinologia do Hospital de Clínicas de Porto Alegre, Porto Alegre, RS 7. Professor Adjunto do Serviço de Endocrinologia do Hospital de Clínicas de Porto Alegre, Porto Alegre, RS
i
ntroductionDiabetes mellitus (DM) is associated with vascular complica
-tions that lead to a major increase in mortality and morbidity1.
The rate of chronic complications of DM varies among popula-tions2. Ethnic origin of the individuals might be involved in this
difference. The most consistent data concern advanced diabetic nephropathy (DN). Prevalence of end-stage renal failure is higher
in patients of African ancestry, compared with individuals of
European ancestry, either in studies performed in the United States3-10, Europe11 or in Brazil12. Moreover, this ethnic group
appears to be more affected by the proliferative form of diabetic retinopathy (DR)12 and by ischemic heart disease (IHD)3, 4.
The traditional risk factors for onset and progression of chronic complications of DM are hyperglycemia, hypertension and dyslipidemia13. The few studies in non-Brazilian populations
suggest that individuals of African ancestry present a higher prevalence of hypertension14, 15, insulin resistance and metabolic
syndrome16 when compared to individuals of European ancestry. These changes might explain the increase in the advanced forms
of DN and DR in this ethnic group. However, there are few descriptions of these characteristics in the Brazilian population
related to ethnicity.
The purpose of this study was to evaluate the risk factors for
micro and macrovascular DM chronic complications in patients
with type 2 DM, without advanced DN, according to ethnicity.
M
ethodsA cross-sectional study was performed on type 2 DM outpa
Endocrine Division of Hospital de Clínicas de Porto Alegre, the Endocrine Division of Hospital Nossa Senhora da Conceição, Hospital São Vicente de Paula in Passo Fundo and Hospital da
Fundação Universitária de Rio Grande. Type 2 DM was diagnosed
in the absence of previous episodes of diabetic ketoacidosis, a
diagnosis of DM after the age of 30 years, without any need for insulin during the irst 5 years after diagnosis.
Patients answered a standard questionnaire about age, DM
duration, smoking habit and medication currently used. Ethnicity
was self-deined as white, black, mulatto or others, according to the methodology adopted by the Brazilian Institute of Geog
-raphy and Statistics (IBGE - Instituto Brasileiro de Geograia e
Estatística) 17. Initially, a total of 1276 patients were identiied. Patients who classiied themselves as mulatto (n = 158) and others (n = 62) were excluded from the study. One hundred and ninety-ive of the 1056 remaining patients were black. These patients were paired randomly and according to age of the white patients at a proportion of 1:3 (whites: n = 585). Physical examination and laboratory evaluation were performed in order to analyze risk factors for chronic complications. Weight and height were measured on an anthropometric scale without shoes and wearing light clothes. Body mass index (BMI) was calculated as weight (kg)/height2(m2) ratio. Waist circumfer-ence was obtained at the mid-point between the last rib and the antero-superior iliac spine, parallel to the loor, with a non-distensible measuring tape. Blood pressure (BP) was measured twice with a 5-minute interval, in a seated position on the left upper arm, with a mercury column sphygmomanometer (phases I and V of the Korotkoff sounds). Hypertension was deined by
BP >140/90 mm Hg (average of two measurements) and/or the use of antihypertensive drugs.
The study protocol was approved by hospital research ethics committees and informed consent was obtained from
all patients.
Laboratory evaluation
The urinary albumin excretion (UAE) was measured using the immunoturbidimetry technique on 24h urine samples with
recorded time, or in a random sample of sterile urine. Presence
of microalbuminuria (UAE 20-200 µg/min or 17-174 mg/l) or macroalbuminuria (UAE >200 µg/min or >174 mg/l) was conirmed by at least two measurements during a three to
six-month interval18.
Metabolic parameters were analyzed in the morning, after 12 hours of fasting. Glucose levels were determined by the glucose
oxidase method and creatinine by the Jaffé reaction. A1c test was measured by HPLC (high performance liquid chromatography) in a Merck-Hitachi 9100 apparatus, using the column method
with cation exchange and reference values of 4-6%. The lipid proile was measured by an enzymatic method and LDL-choles
-terol was calculated by the Friedewald equation. Serum insulin was dosed by radioimmunoassay (Elecsys R. Systems 1010 / 2010 / modular analysis E170 - ROCHE). Insulin resistance was estimated calculating the Homeostasis Model Assessment [HOMA-IR = (fasting insulin (mU/ml) x fasting plasma glucose (mg/dl) /18)/ 22.5]19.
Glomerular iltration rate (eGFR)was estimated by the equa -tion recommended by the National Kidney Foundation (NKF)
based on Modiication of Diet in Renal Disease study (MDRD): (ml x min-1 x 1.73m-2) = 186 x [serum creatinine - 1,154 x age-0,203 x 0.742 (if female) x 1.212 (if African ethnicity)] 4. Patients with stage 4 chronic kidney disease or worse (eGFR <30 ml/min/1.73
m2) were excluded to avoid clinical and laboratory alterations
secondary to uremia20.
For analytical purposes, each risk factor for vascular disease
was considered present according to the following criteria: waist
>88 cm for women and >102 cm for men; systolic BP (SBP) >135 mm Hg, diastolic BP (DBP) >85 mm Hg; total cholesterol
>200 mg/dl; LDL cholesterol >100 mg/dl; HDL cholesterol <50 mg/dl for women and <40 mg/dl for men; triglycerides >150 mg/dl and; A1c >7.0%, fasting plasma glucose >110 mg/dl.
Since the reference values for HOMA among diabetic subjects is not well established, the upper tertile of the entire group was
considered abnormal.
Statistical analysis
Data were described as mean ± standard deviation or absolute and percentage numbers. Qualitative variables were compared using the Chi-square test. Means were compared using the Student t test. Continuous variables without normal distribution were log-transformed. P <0.05 was considered to be signiicant.
r
esultsA total of 780 patients with type 2 DM (273 males, 585 whites) were included.
No differences were found between white and black patients, respectively, in DM duration (9.6 ± 7.7 vs. 8.8 ± 7.3 years, P = 0.201), BMI (29.7 ± 5.5 vs. 29.9 ± 5.0 kg/m2, P = 0.182), waist circumference (women: 97.3 ± 12.6 vs. 98.4 ± 13.1 cm, P = 0.482; men: 100 ± 11.2 vs. 98.9 ± 9.6 cm, P = 0.484), levels of systolic or diastolic BP (systolic: 139.9 ± 22.7 vs. 139.6 ± 22.1 mm Hg, P = 0.854; diastolic: 86.2 ± 12.5 vs. 86.2 ± 12.9 mm Hg, P = 0.956) and prevalence of hypertension (62.1% vs. 67%, P = 0.284) (Table 1).
Black patients presented lower levels of triglycerides [115 (35-892) vs. 152 (34-1236) mg/dl; P <0.001] and a higher HDL (48.3 ± 13.5 vs. 44.8 ± 12.1 mg/dl; P = 0.002) than whites. Fasting glycemia (180.7 ± 74 vs. 167.5 ± 80.9 mg/ dl, P = 0.070), A1c test (7.2 ± 2.2 vs. 7.3 ± 2.5 %, P = 0.840), total cholesterol (212.7 ± 46.5 vs. 209.2 ± 51.7 mg/ dl, P = 0.428) and LDL levels (133.2 ± 43.8 vs. 136.9 ± 48.8 mg/dl, P = 0.402), serum insulin values and HOMA-IR were no different between groups. Figure 1 presents the frequency of each vascular risk factor dichotomized. White subjects more often had high fasting plasma glucose (83.6% vs. 76.4%, P = 0.004) and triglycerides (47.8% vs. 31.0%, P <0.001) when compared to black subjects. All other characteristics were similar between groups (P >0.05).
No differences were found regarding medication used
(statins: 18.5 vs. 19.3%, P = 1.000; fibrates: 1.5 vs. 0.7%,
P = 0.680; angiotensin converting enzyme inhibitors: 39.5 vs.
43.8%, P = 0.375 and acetylsalicylic acid: 29.9 vs. 27.7%,
P = 0.673) as well as the number of anti-hypertensive drugs
Traditionally, higher levels of systolic and diastolic BP and more severe hypertension have been described in black
indi-viduals compared to whites, both in diabetic14,15 and non-diabetic
individuals21, 22. In the present sample, BP levels were similar between groups. This discrepancy in the indings can be attrib
-uted to the fact that in previous studies, individuals with kidney disease were not excluded. Since black patients present a higher
prevalence of DN, the higher pressure levels reported may result from hypertension secondary to nephropathy, falsely increasing prevalence and severity of hypertension in black individuals. In
this study only patients with 1, 2 and 3 stages of renal disease (>30 ml/min/1,73m2) according to NKF were assessed. Unfor
-tunately, data about the dose of anti-hypertensive medications is not available. We could suppose that a higher dose of such
medications among black subjects could obscure a difference. On the other hand, number of classes of medication used was similar between white and black subjects.
We have previously shown that black individuals present a
higher prevalence of end-stage renal disease and severe DR12.
In order to identify possible risk factors for these complications,
patients at advanced stages of these complications were not
included. The evaluation of a population free of renal disease
enables identiication of risk factors present in the earliest stage
of the disease. As such, the similar prevalence of the main risk
factors for DM complications in this sample shows the marked
role of ethnicity as a risk factor for micro and macrovascular disease in diabetic patients.
Studies of European and American populations suggest a
higher frequency of obesity5 6, metabolic syndrome6 and worse
glycemic control 7 in the black population, which might explain
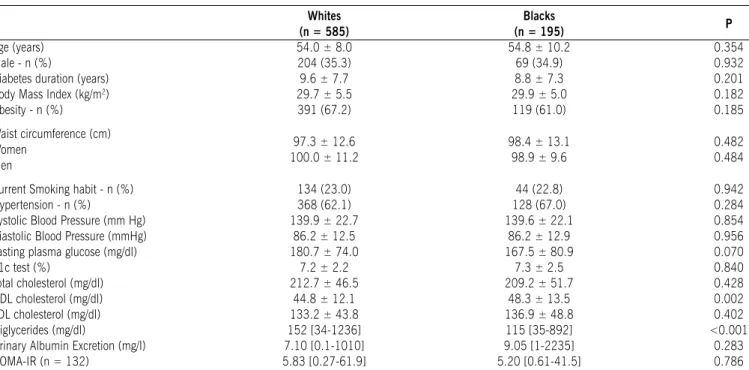
Table 1 - Clinical and laboratory characteristics of patients with type 2 diabetes mellitus according to ancestry Whites
(n = 585)
Blacks
(n = 195) P
Age (years) 54.0 ± 8.0 54.8 ± 10.2 0.354
Male - n (%) 204 (35.3) 69 (34.9) 0.932
Diabetes duration (years) 9.6 ± 7.7 8.8 ± 7.3 0.201
Body Mass Index (kg/m2) 29.7 ± 5.5 29.9 ± 5.0 0.182
Obesity - n (%) 391 (67.2) 119 (61.0) 0.185
Waist circumference (cm) Women
Men
97.3 ± 12.6
100.0 ± 11.2 98.4 ± 13.198.9 ± 9.6 0.4820.484
Current Smoking habit - n (%) 134 (23.0) 44 (22.8) 0.942
Hypertension - n (%) 368 (62.1) 128 (67.0) 0.284
Systolic Blood Pressure (mm Hg) 139.9 ± 22.7 139.6 ± 22.1 0.854 Diastolic Blood Pressure (mmHg) 86.2 ± 12.5 86.2 ± 12.9 0.956
Fasting plasma glucose (mg/dl) 180.7 ± 74.0 167.5 ± 80.9 0.070
A1c test (%) 7.2 ± 2.2 7.3 ± 2.5 0.840
Total cholesterol (mg/dl) 212.7 ± 46.5 209.2 ± 51.7 0.428
HDL cholesterol (mg/dl) 44.8 ± 12.1 48.3 ± 13.5 0.002
LDL cholesterol (mg/dl) 133.2 ± 43.8 136.9 ± 48.8 0.402
Triglycerides (mg/dl) 152 [34-1236] 115 [35-892] <0.001
Urinary Albumin Excretion (mg/l) 7.10 [0.1-1010] 9.05 [1-2235] 0.283
HOMA-IR (n = 132) 5.83 [0.27-61.9] 5.20 [0.61-41.5] 0.786
HOMA-IR = Homeostasis Model Assessment
Data are expressed as means ± SD or number of cases (%).
Figure 1 - Frequency of risk factors according to the ethnic group. Gray bars = white subjects, Black bars = black subjects. Waist = waist circumference; SBP = systolic blood pressure; DBP = diastolic blood pressure; FPG = fasting plasma glucose;
a1c = glycohemoglobin; TG = triglycerides; TC = Total cholesterol; LDLc = low density lipoprotein cholesterol; HDLc = high-density lipoprotein cholesterol. DN = diabetic
nephropathy, HOma (HOma-r) = Homeostasis model assessment. * P <0.05 (Chi- square test)
d
iscussionPrevalence of classic micro- and macrovascular risk factors,
the higher prevalence of chronic complications of DM and
worse evolution of DN and DR in this population. Recently, in a meta-analysis performed in American patients with type 2 DM, patients of African ethnicity had worse metabolic control than whites23. Black patients presented a mean A1c 0.65% higher than whites23. Data on the Brazilian population are scarce and, in the present sample, the glycemic control was similar among the ethnic groups. With regard to the lipid proile, white patients had higher triglyceride levels and lower HDL values, showing a better cardiovascular proile of patients with African ancestors. These indings agree with studies made with African-Americans who also presented a better lipid proile than whites1, 15.
A possible limitation of this study was the method used for the ethnic classiication of individuals. Deinition of ethnicity followed that advocated by IBGE, which classiies individuals as black, white and mixed, by self-deinition. The evaluation
of ethnic ancestry should ideally be performed using molecular markers. In a study evaluating molecular markers of African
ancestry in individuals from several regions of Brazil, Parra et at. 24 demonstrated that the analysis of ethnic ancestry according to skin color is not reliable in the Brazilian population in general, especially in the Northeast and Southeast, where there is greater miscegenation. However, in the Southern region of Brazil there was a better correlation between skin color and genetic markers
of ancestry24. However, this methodology would have a high cost, making its use dificult in studies with a large number of individuals. In order to minimize possible classiication errors, we evaluated only black or white individuals.
Socioeconomic status and level of access to medical services
were described in previous studies as possible factors responsible
for the higher prevalence and greater severity of DM complica-tions in black patients7. However, patients evaluated in this study population are part of the same health care system with the same
access to diagnostic methods and medication.
c
onclusionIn this sample of patients from Southern Brazil with type 2 DM and preserved renal function, there were no differences among
the ethnic groups concerning classic metabolic and clinical risk factors. The study of non-conventional risk factors and genetic aspects is essential to better understand the determinants of the
worst outcomes presented by the African-Brazilian population and enable the planning of preventive measures and/or intensi
-ication of DM treatment in black patients.
Conlict of interest: none
r
esuMocoMparação de fatores de risco para coMplicações Micro e Macro-vasculares eM pacientes coM diaBetes Mellitus tipo 2 negros e Brancos
ObjetivO. A prevalência das complicações crônicas do
Diabetes mellitus (DM) é maior nos negros. A razão para esse achado é desconhecida. O objetivo desse estudo é analisar os fatores de risco para doença micro e macrovascular em pacientes com DM tipo 2 de acordo com a etnia.
MétOdOs. Foi realizado estudo transversal avaliando 780
pacientes. Todos pacientes realizaram avaliação clinico/
laboratorial. A etnia foi autoreferida em branca (n = 585) ou negra (n = 195).
ResultadOs. Os pacientes negros apresentaram níveis
menores de triglicerídeos [115 (35-892) vs. 152 (34-1236) mg/dl; P <0.001] e maiores de HDL colesterol que os brancos (48.3 ± 13.5 vs. 44.8 ± 12.1 mg/dl; P = 0.002). Não houve diferença entre os grupos quanto à glicemia de jejum, teste A1c, LDL e colesterol total, níveis pressóricos, insulina e Homa-ir. Não houve diferença no uso de medicações (esta-tinas: 18.5 vs. 19.3%, P = 1.000; fibratos: 1.5 vs. 0.7%, P = 0.680; inibidores da enzima conversora da angiotensina: 39.5 vs. 43.8%, P = 0.375; acido acetilsaliscílico: 29.9 vs. 27.7%, P = 0.673).
COnClusãO. Não houve diferença na prevalência dos fatores
de risco convencionais para doença micro e macrovascular entre os grupos étnicos. O estudo de fatores não-convencionais e genéticos é essencial para a elucidação dos determinantes dos piores desfechos apresentados pela população diabética afrobrasileira. [Rev Assoc Med Bras 2009; 55(3): 308-12]
unitermos: Diabetes mellitus. Etnia. Complicações crônicas.
Fatores de risco.
r
eferences1. Organization WHO. WHO Study Group. Diabetes Mellitus. Geneve: WHO; 1985. p.727. [Technical Report Series]
2. Ethnicity and cardiovascular disease. The incidence of myocardial infarction in
white, South Asian, and Afro-Caribbean patients with type 2 diabetes (U.K.
Prospective Diabetes Study 32). Diabetes Care. 1998;21:1271-7. 3. Karter AJ, Ferrara A, Liu JY, Moffet HH, Ackerson LM, Selby JV. Ethnic
disparities in diabetic complications in an insured population. JAMA. 2002;287:2519-27.
4. Young BA, Maynard C, Boyko EJ. Racial differences in diabetic nephropathy, cardiovascular disease, and mortality in a national population of veterans.
Diabetes Care. 2003;26:2392-9.
5. McClellan WM. Epidemiology and risk factors for chronic kidney disease. Med Clin North Am. 2005;89:419-45.
6. Krop JS, Coresh J, Chambless LE, Shahar E, Watson RL, Szklo M, et al.. A
community-based study of explanatory factors for the excess risk for early
renal function decline in blacks vs whites with diabetes: the Atherosclerosis
Risk in Communities study. Arch Intern Med. 1999;159:1777-83. 7. Perneger TV, Whelton PK, Klag MJ. Race and end-stage renal disease.
Socio-economic status and access to health care as mediating factors. Arch Intern Med. 1995;155:1201-8.
8. Powers DR, Wallin JD. End-stage renal disease in speciic ethnic and racial groups: risk factors and beneits of antihypertensive therapy. Arch Intern Med.
1998;158:793-800.
9. US Renal Data System. USRDS Annual Data Report Md: National Institute of Diabetes and Digestive and Kidney Diseases. Washigton: National Institutes of Health; 1995.
10. Brancati FL, Whittle JC, Whelton PK, Seidler AJ, Klag MJ. The excess incidence of diabetic end-stage renal disease among blacks. A population-based study
of potential explanatory factors. JAMA. 1992;268:3079-84.
11. Vaccaro O, Stamler J, Neaton JD. Sixteen-year coronary mortality in black and
white men with diabetes screened for the Multiple Risk Factor Intervention Trial (MRFIT). Int J Epidemiol. 1998;27:636-41.
12. Gerchman F, Burttet L, Nabinger G, Picon P, Zanatta C, Lisboa H, et al. High prevalence of macrovascular and microvascular disease among black patients
with type 2 diabetes mellitus. Diabetes. 2005;(Suppl 1):A548.
13. Gross JL, Azevedo MJ, Silveiro SP, Canani LH, Caramori ML, Zelmanovitz T.
Diabetic nephropathy: diagnosis, prevention, and treatment. Diabetes Care.
2005; 28:164-76.
14. Park YW, Zhu S, Palaniappan L, Heshka S, Carnethon MR, Heymsield SB. The metabolic syndrome: prevalence and associated risk factor indings in
the US population from the Third National Health and Nutrition Examination
Survey, 1988-1994. Arch Intern Med. 2003;163:427-36.
15. Davis TM, Cull CA, Holman RR. Relationship between ethnicity and glycemic control, lipid proiles, and blood pressure during the irst 9 years of type 2
diabetes: U.K. Prospective Diabetes Study (UKPDS 55). Diabetes Care.
16. Lteif AA, Han K, Mather KJ. Obesity, insulin resistance, and the metabolic syndrome: determinants of endothelial dysfunction in whites and blacks.
Circulation. 2005;112:32-8.
17. IBGE. Instituto Brasileiro de Geograia e Estatística; 2006. [citado set 2006]. Disponível em: http:// www.ibge.gov.br.
18. Zelmanovitz T, Gross JL, Oliveira JR, Paggi A, Tatsch M, Azevedo MJ. The
receiver operating characteristics curve in the evaluation of a random urine specimen as a screening test for diabetic nephropathy. Diabetes Care.
1997;20:516-9.
19. Matthews DR, Hosker JP, Rudenski AS, Naylor BA, Treacher DF, Turner RC.
Homeostasis model assessment: insulin resistance and beta-cell function from fasting plasma glucose and insulin concentrations in man. Diabetologia. 1985; 28:412-9.
20. Levey AS, Coresh J, Balk E, Kausz AT, Levin A, Steffes MW, et al.. National
Kidney Foundation practice guidelines for chronic kidney disease: evaluation,
classiication, and stratiication. Ann Intern Med. 2003;139:137-47. 21. Rosner B, Prineas R, Daniels SR, Loggie J. Blood pressure differences between
blacks and whites in relation to body size among US children and adolescents.
Am J Epidemiol. 2000;151:1007-9.
22. Cushman WC, Reda DJ, Perry HM, Williams D, Abdellatif M, Materson BJ. Regional and racial differences in response to antihypertensive medication use
in a randomized controlled trial of men with hypertension in the United States.
Department of Veterans Affairs Cooperative Study Group on Antihypertensive
Agents. Arch Intern Med. 2000;160:825-31.
23. Kirk JK, DAgostino RB Jr, Bell RA, Passmore LV, Bonds DE, Karter AJ,
et al. Disparities in HbA1c Levels Between African-American and Non-Hispanic White Adults With Diabetes: A meta-analysis. Diabetes Care. 2006; 29:2130-6.
24. Parra FC, Amado RC, Lambertucci JR, Rocha J, Antunes CM, Pena
SD. Color and genomic ancestry in Brazilians. Proc Natl Acad Sci USA.
2003;100:177-82.