NORMALITY TESTS OF TEMPORAL RESOLUTION:
RANDOM GAP DETECTION TEST AND GAPS-IN-NOISE
Critérios de normalidade dos testes de resolução temporal:
random gap detection test e gaps-in-noise
Bárbara Heloíse Colcerniani Braga (1), Liliane Desgualdo Pereira (2), Karin Ziliotto Dias (3)
(1) Universidade Federal de São Paulo UNIFESP, São Paulo,
SP, Brasil.
(2) Departamento de Fonoaudiologia da Universidade Federal
de São Paulo – UNIFESP, São Paulo, SP, Brasil.
(3) Curso de Fonoaudiologia da Universidade Federal de São
Paulo, São Paulo, SP, Brasil.
Source of support: CNPq – Scientiic Initiation Conlict of interest: non-existent
Central auditory processing (CAP) is a set of
speciic abilities that allow individuals to perform the analysis of sound events and interpret what you hear, such abilities are: auditory discrimination;
location and lateralization of sound; auditory pattern
recognition; auditory performance in the presence
of competing acoustic signals and temporal aspects
of hearing1,2.
The temporal aspects of hearing consist of four sub-processes that include temporal resolution,
temporal ordering, integration and temporal
masking. The integrity of these sub-processes are essential for the auditory perception of verbal and non-verbal sounds, for the perception of music, rhythm and punctuation to pitch discrimination and perception of duration of speech sounds 3.
The temporal resolution, one of the sub-processes of the temporal processing, deined as the ability of the auditory system to detect rapid and abrupt changes in the sound stimulus and discriminate the shortest time interval between two acoustic stimuli are functions that participate in continuous speech
INTRODUCTION
Hearing is an important sensory function that provides and facilitates the individual communi
-cation and interaction with society.
To hear and decipher the sounds we observe the relationship between the peripheral auditory system and central auditory system, so even when a person has hearing thresholds sensitive enough to detect tenuous sounds, may have dificulty under
-standing what people say, due to dysfunctions in neural sensory pathways that transmit sound to the cerebral cortex¹.
ABSTRACT
Purpose: to evaluate temporal resolution of normal hearing individuals from 20 years old to 60 years
old. Methods: individuals of both genders from 20 to 60 years old have been separated by age in four
groups of ten individuals per group. Group I: from 20 years old to 30 years old. Group II: from 31 years old to 40 years old. Group III: from 41 years old to 50 years old. Group IV: from 51 years old to 60 years
old. All individuals were submitted to procedures of audiological routine in order to evaluate the central and peripheral hearing. After those tests, they were included in the sample and submitted to temporal
resolution tests: Randon-gap-detection-test and Gaps-in-noise. Results: the average values obtained
for the gap detection threshold on Gaps-in-noise were around 6ms at Group I and II. For the Group III and IV these values were around 8ms. Regarding the gap detection threshold obtained on Random-gap-detection-test the average values were 10ms at Group I and II. At Group III and IV these values were between 10ms and 15ms. Conclusion: the temporal resolution ability worsens with increasing
age. The normal values of tests with noise segments (GIN test - Gaps In Noise) and pure tone (test
RGDT - Random Gap Detection Test) are increasing according to age range studied.
The collected data in normal hearing individuals will provide a better understanding of temporal resolution ability in the age group studied, will
generate an increased use of tests evaluated in audiological assessments to aid in auditory
processing, and expand the ield for research and
disorders of temporal resolution and temporal
aspects of hearing disorders.
This study aims to evaluate the temporal resolution of normal hearing individuals from 20
years old to 60 years old.
METHODS
Study approved the Institutional Ethics
Committee, Federal University of São Paulo under
number 1404/10. The evaluated participants signed the Informed Consent and, after receiving infor
-mation about the objectives and the methodology of the proposed study.
We adopted as inclusion criteria for the study, aged between 20 and 60 years, no otologic history; absence of learning disabilities; absence of psycho
-logical diseases audiogram within the normal range (ASHA) and have a higher hit rate than or equal to 95% in the dichotic digits test. Any individual who did not show one or more of the selection criteria was excluded from the sample.
The sample was composed of 40 individuals
aged 20 to 60 years.
• Group 1: 10 individuals with 20-30 years; • Group 2: 10 individuals with 31-40 years; • Group 3: 10 individuals with 41-50 years; • Group 4: 10 individuals with 51-60 years.
General Procedures
All subjects underwent anamnesis, which aims to investigate the clinical history, developmental and family; the neuro-perceptual-motor and language development; historical and educational level; and auditory behavior in different listening situations 10.
To evaluate the peripheral hearing was held to pure tone audiometry by air in the sound frequencies from 250 Hz to 8000 Hz, made in a soundproof booth and having been based on the criteria of normality of the American Speech-Language-Hearing Association (ASHA) thresholds tonal smaller or equal to 20 dBHL11.
In order to evaluate the physiological auditory mechanism of dichotic listening of verbal sounds through binaural integration, dichotic of digits test was performed, which is the submission of a list where each item has four familiar words that
represent digits, and presented different overlapping
two in each ear simultaneously, as proposed by recognition and the isolated segments. Disorders
in hearing can lead to losses in language devel
-opment, insuficient learning and dificulty under
-standing what is said, and with or without changes in peripheral hearing 4.
For such importance, temporal resolution has been studied in psychoacoustic paradigms since the 70’s and had its commercially available tests in the 90s. Currently there are two temporal resolution tests available for clinical use: the Random Gap Detection Test (RGDT) and the Gaps-in-Noise (GIN) both have good performance in terms of sensitivity and speciicity 5.
In Brazil, the use of temporal resolution tests in
audiological evaluation is relatively minor compared
to other auditory processing tests, concurrently professionals recognize the importance of both the audiological evaluation. This deicit is due to the
RGDT and GIN still lacking of some normative data
in normal hearing people in different age groups. This shortage has also been identiied by Shinn, Chermak and Musiek, 2009 3.
Some studies of Brazilian populations have been conducted, one was the Schochat, Rabelo
and Marculino (2011)6, in order to establish the
normal criteria for the GIN test in children 9 years of age with normal hearing, found that there is no statistically signiicant difference in the right ear and left and gender, the mean values were 4.4 ms for the right ear and 4.2 for the left ear, the authors suggested this as the normality in children 9 years.
The study of Samelli and Schochat (2008)7, in
order to obtain the average gap detection threshold GIN the four lists in adults with normal hearing revealed that the mean gap detection threshold for four lists is of 4.9 ms and the percentage of 67.25% right, the authors suggested this value as a cutoff
criterion.
studied the performance of children aged 11 and 12 years in GIN test, found that the average temporal acuity threshold was 5.05 ms and the average percentage of correct answers of 71.70%. There were no differences in results in relation to gender and the right and left ear 8.
Liporaci (2009)9 applied the GIN test in elderly
All steps were performed at the outpatient clinic of the Department of Hearing Disorders in neuro-audiology department of the Federal University of
São Paulo.
Statistical method
Nonparametric statistical tests were used, as the distribution of the data did not allow the use of non-parametric tests given to homogeneity. The signiicance level was 0.05 (5%). These results were obtained with the help of a professional.
The statistical tests used were the Wilcoxon test to compare the auditory responses between the ears of the same individual; Kruskal-Wallis test was used to compare auditory responses between the various groups, Mann-Whitney test was used to compare the auditory responses between two groups. Still, we calculated descriptive statistics values to represent them: mean, median, standard deviation, irst and third quartile, and the conidence interval for the average, with 95% statistical conidence. The variables studied were age, years of education, gap detection threshold obtained through the GIN test, and abbreviated GIN_LI, temporal acuity threshold obtained through RGDT, and abbreviated RGDT_LI and identifying gaps percentage, abbreviated GIN_% of hit. Right and left ears studied these auditory responses, by age group, and between
tests.
RESULTS
The results will be initially presented on the characteristics of the sample by age and years of schooling, and later by procedures used to evaluate, GIN, and RGDT and inally to compare the responses obtained by age groups in both hearing
tests.
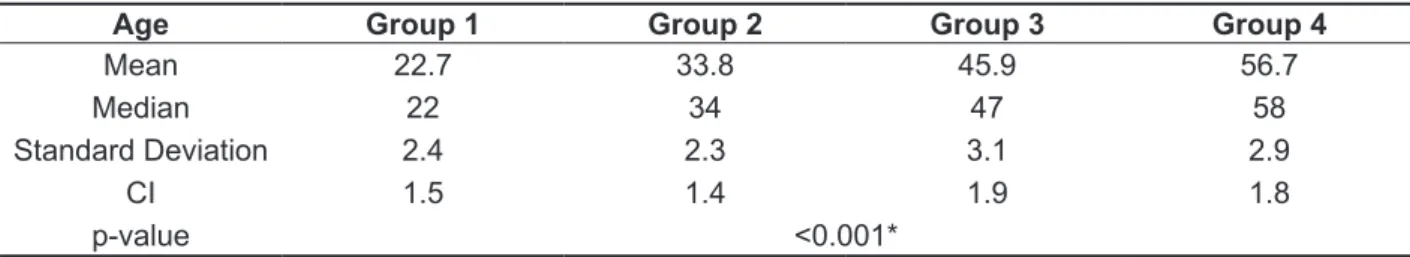
In Table 1, descriptive statistics for age in each age group found that age groups are aged (years) signiicantly different between them, as planned. Group 1 was composed of individuals aged 20-30 years, mean age of 22 years; G2 by individuals 31-40 years, mean age 33.8; G3 by individuals 41-50 years, mean age of 45.9 and the G4 by individuals
51-60 years, mean age of 56.7.
In Table 2, descriptive statistics for years of schooling per group. The age groups show an average of 13 years of education with a conidence interval less than two years. There were no differ
-ences between the groups in terms of years of schooling.
of 20 pairs of digits whose recognition is evaluated through verbal repetition of the same by the subject.
Speciic Procedures
The volunteers underwent two temporal resolution tests proposed in the study, RGDT and the GIN presented 50 dBSL, based on the average of the hearing thresholds obtained in the
sound frequencies of 500, 1000 and 2000 Hz tone
audiometry test. In both tests, the individual is asked to identify the silence segments of sounds, and noise segment in the GIN and pauses between pure tones in RGDT. There is a gap threshold in milliseconds. For the tests, we used a MP3 player connected to the audiometer for availability of tests in multimedia.
The RGDT aims to determine the shortest time interval that can be detected by the individual, that is, determines the temporal acuity threshold. The test consists of pairs of pure tones presented at the frequencies 500, 1000, 2000 and 4000 Hz with intervals of silence between each pair of tones which increases and decreases in length at random, ranging between 2, 5, 10, 15, 20, 25, 30 and 40 ms. The volunteer was instructed to respond with a hand movement if you heard one or two tones, and the irst stimuli presented comprised the training stage and the other stimuli the test. This test was applied binaurally. After obtaining the temporal acuity threshold for each measured sound frequency arithmetic mean was performed to obtain the inal temporal acuity threshold RGDT, called RGDT_LI 13.
GIN (Noise-In-Gap) has segments 6 seconds of white noise containing no three silent intervals, which have different lengths ranging from 2, 3, 4, 5, 6, 8, 10, 12, 15 and 20 ms, are presented six times throughout each list. The intervals of silence or
“gaps” are inserted at positions in noise and varying
durations in order to decrease the probability of the individual deduction and obtain statistically relevant information. The GIN lists for training and four test lists, each list is presented in one ear. The test is monaural and presented to 50dBSL considering the thresholds of audibility average of 500Hz, 1000Hz and 2000Hz. Subjects were asked to lift the index inger when detect a ‘gap’ or silence. At the end of this test, two measures were taken: the gap detection threshold, called GIN_LI and the percentage gap of recognition, called GIN_% correct. It was named gap detection threshold to a minimum value (in milli
-seconds) that the volunteer noticed pause or silent interval of at least four of the six stimuli presented, as proposed by Musiek et al. (2005)5. It was named
recognition, the amount, in percentage, for the
Table 1 - Descriptive statistics of age in years for each age group
Age Group 1 Group 2 Group 3 Group 4
Mean 22.7 33.8 45.9 56.7
Median 22 34 47 58
Standard Deviation 2.4 2.3 3.1 2.9
CI 1.5 1.4 1.9 1.8
p-value <0.001*
Legend: Kruskal- Wallis Test; CI= conidence interval; p-value:0.05; *statistically signiicant.
Table 2 - Descriptive statistics of years of schooling for each age group and p-value calculated
Schooling Group 1 Group 2 Group 3 Group 4
Mean 13.0 13.5 13.1 12.0
Median 13 15 15 11
Standard Deviation 2.1 2.5 2.6 2.8
CI 1.3 1.6 1.6 1.8
p-value 0.583
Legend: Kruskal-Wallis Test.
Table 3 - Descriptive statistics of gap detection thresholds by age group and the p-value calculated for comparison of responses by ear
GIN threshold Group 1 Group 2 Group 3 Group 4
RE LE RE LE RE LE RE LE
Mean 4.9 4.8 5.7 5.5 7.3 6.6 7.0 6.3
Median 5 5 6 6 6 6 7 6
Standard
Deviation 0.7 1.2 0.9 0.7 2.2 1.8 2.7 1.9
CI 0.5 0.8 0.6 0.4 1.4 1.1 1.7 1.2
p-value1 0.739 0.480 0.176 0.066#
Legend: Wilcoxon Test. GIN threshold: Gaps-in-noise threshold, CI= conidence interval, RE= right ear, LE= left ear.
p-value: 0.05; # tendency to signiicance.
As for the results of the GIN test, it was found that the GIN_LI and GIN_% calculated for comparison between right ear and left answers got a statistically signiicant difference only in a variable (Group 2),
Then, in Table 6 were shown the descriptive measures of the responses of the groups in relation to the value of GIN_%. There was statistically signif
-icant difference between the groups and the same occurred between group 1 and all others.
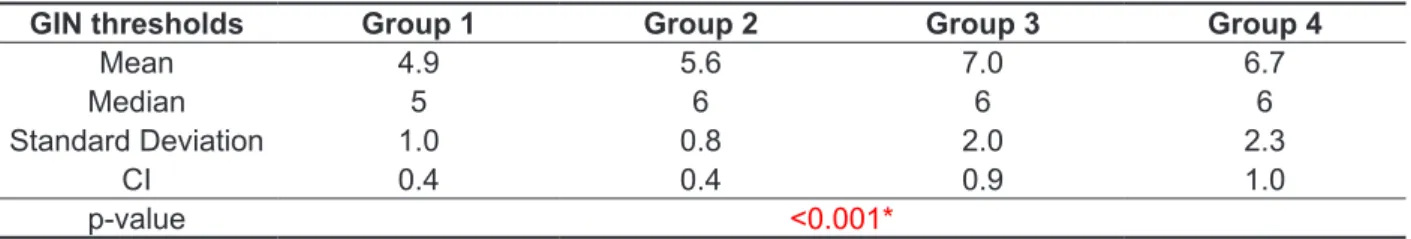
Table 5 presents the descriptive statistics and the p-value calculated to compare the GIN_LI responses between groups. There were signiicant differences between the G1 compared to G2, G3 and G4, ie, it became clear that the average increase respectively in the 4 study groups.
Table 4 - Descriptive statistics of identifying gaps percentage in the Gaps-in-noise test, obtained by age group and the calculated p-value for comparison between the responses by ear
GIN Total hit Group 1 Group 2 Group 3 Group 4
RE LE RE LE RE LE RE LF
Mean 45.2 45.8 38.1 40.2 33.0 36.0 36.2 38.8
Median 47 47 38 40 35 36 35 37
Standard Deviation 5.1 4.7 3.9 3.2 5.1 6.4 8.6 7.1
CI 3.1 2.9 2.4 2.0 3.2 4.0 5.3 4.4
p-value 0.622 0.014* 0.106 0.125
Legend: Wilcoxon Test; CI= conidence interval, RE= right ear, LE= left ear *statistically signiicant.
Table 5 - Descriptive statistics of gap detection thresholds in the Gaps-in-Noise test obtained by age group and the p-value calculated for comparison of responses by group
GIN thresholds Group 1 Group 2 Group 3 Group 4
Mean 4.9 5.6 7.0 6.7
Median 5 6 6 6
Standard Deviation 1.0 0.8 2.0 2.3
CI 0.4 0.4 0.9 1.0
p-value <0.001*
Legend: Kruskal-wallis Test; CI= conidence interval, p-value: 0.05. *statistically signiicant.
Table 6 - Descriptive statistics of the percentage of correct answers in the gaps Gaps-in-noise test, obtained by age group and the p-value calculated for comparison of responses by group
GIN % of hit Group 1 Group 2 Group 3 Group 4
Mean 73.6% 63.5% 56.2% 64.1%
Median 74.2% 62.9% 58.1% 59.8%
Standard Deviation 7.6% 5.7% 10.0% 12.8%
CI 3.3% 2.5% 4.4% 5.6%
p-value <0.001*
Legend: Kruskal-wallis Test; GIN % of hit: percentage of correct gaps in test.
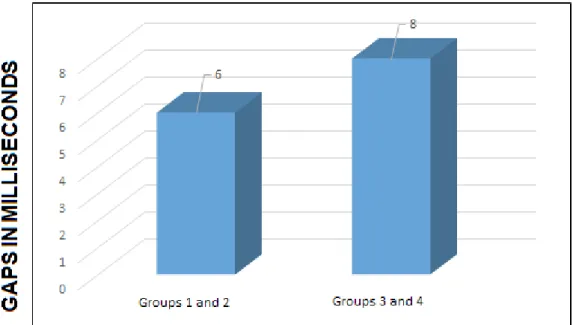
and 2 that evaluated individuals 20 to 40 years and about 8 ms to groups 3 and 4, subjects rated 41 to
60 years.
Regarding the gap recognition value, the mean value plus a conidence interval is about 76.9% for
G1 (20 to 30 years) and 68.4% in G2, G3 and G4
(31 60 years) shown in Figure 2.
In Figure 3, the RGDT_LI and its the mean value with a conidence interval is less than 10 ms in groups 1 and 2 and for the groups 3 and 4 is between 10 and 15 ms.
Table 7 shows the measurements of RGDT_LI
in all groups separately and P-values calculated to
compare the groups together. There were signiicant differences between groups, and the difference occurs between group 1 compared to group 3 and 4. Group 1 had the lowest mean RGDT_LI than the other groups.
Given the values used in clinical practice for both tests, it is apparent from Figure 1 that the mean values for the gap detection threshold plus a conidence intervals are at about 6 ms for groups 1
Table 7 - Descriptive statistics of temporal acuity threshold test Random Gap Detection Test by group
RGDT_LI Group 1 Group 2 Group 3 Group 4
Mean 6.0 8.0 8.8 10.1
Median 6 8 9 9
Standard Deviation 2.3 1.5 2.4 3.6
CI 1.4 0.9 1.5 2.2
p-value 0.032*
Legend: RGDT_LI: temporal acuity threshold RGDT. Kruskal-wallis Test; CI= conidence interval, p-value: 0,05 *statistically signiicant.
Figure 2 - Mean values of the total identiied gaps in the Gaps-in-Noise test in percent for clinical
application
Figure 3 - Values of temporal acuity threshold test Random Gap Detection Test for clinical application
DISCUSSION
a) Discussion on the characterization of the age groups in age, in years, and for the years of schooling.
Comparing the groups G1, G2, G3 and G4 in age, the results showed a statistically signiicant difference among the four groups (Table 1), as planned for the study, with the objective of assisting in the establishment of normal patterns of according
to age group.
For the years of schooling, there was no statis
-tically signiicant difference between the groups
(Table 2) which shows that the four groups are similar in terms of the written language exposure
level.
b) Discussion of gap detection thresholds and the gaps identiication percentage obtained in the GIN test.
In the GIN test, as the gap detection threshold,
hearing loss, moderate or moderately severe, symmetrical sensorineural hearing loss, individuals with right temporal lobe lesion and left and elderly (between 60 and 79), and the value of these studies is below GIN_% of 59% 5,9,14,16.
c) Discussion of gap detection thresholds obtained through RGDT
The gap detection thresholds obtained through RGDT called RGDT_LI, according to the calculated P-values were no statistical differences between the groups. Group 1 had the lowest value of RGDT_LI on the other 3 groups. It can be concluded that the RGDT_LI increases with age, as observed in the
groups studied.
In this study, we consider RGDT_LI in G1 and G2 being younger sampling, the mean value plus the conidence interval, we obtained a value of less than 10ms in both groups. This gap detection threshold is similar to those obtained by other authors who studied this age group and they are Zaidan et al.
(2008)4, Balen et al. (2008)10 and Gallo (2012)14.
Studies show children with similar RGDT_LI to our study and they are Chermak, Lee (2005)15 e Muluk,
Yalçinkaia and Keith (2010)20.
The analysis of the groups G3 and G4 RGDT_LI to have a mean value plus a conidence interval is between 10 and 15ms for both groups. This gap detection threshold is found in studies by Queiroz et
al. (2009)21 containing sample similar to this study regarding age, average acuity and female group
study of Zaidan et al. (2008)4 with younger women.
Results did not corroborate studies Balen et al.
(2008)10 and Gallo (2012)14, studies to be relatively
younger age groups, when compared to age 40 to 60 years contained in the groups G3 and G4 in this
study.
The results across the sample, ie, the 4 groups (G1, G2, G3 and G4) differ from works done in individuals with: language delay, injury of the right and left temporal lobe, changes in central auditory processing, loss mild sensorineural hearing symmetrical sensorineural hearing loss 13,14,20 .
CONCLUSION
The temporal resolution ability worsens with increasing age. The normal values of the noise
segments (GIN - Gaps in Noise) and pure tone (RGDT - Random Gap Detection Test) are increasing according to age range studied.
ACKNOWLEDGEMENT
and Schochat (2008)7, Zaidan and cols (2008)4 and Gallo (2012)14, which had no statistically signiicant
difference between the ears for the GIN test. These results obtained in this study suggest that the noise test can be applied binaurally in clinical practice.
The GIN_LI (Table 5) and the GIN_% of hit (Table 6) were better and statistically signiicant in G1 and G2 when compared to G3 and G4, ie, the best thresholds are in the younger groups of sampling. Moreover, between the G3 and G4 values show no change, demonstrating that among this age group the gap identiication threshold does not undergo major changes.
In this study, it was found that the mean values for the gap detection threshold and a conidence
interval lying around 6ms for groups 1 and 2 (Figure
1). This value is similar to that described in other studies in the literature and they are Musiek et
al., (2005)5, Chermak, Lee (2005)15, Zaidan et al., (2008)4, Rabelo (2008)16, Samelli, Schochat (2008)7, Helfer, Vargo (2009)17, Shinn (2009)3, Perez, Pereira (2010)8, Sanches et al., (2010)18 e Gallo14 (2012).
Supporting information that the lowest values for GIN_LI are found in groups of young adults with normal hearing.
In this study, it was found that when analyzing the mean gap detection thresholds plus a conidence interval, in groups 3 and 4 (Figure 1) was obtained an approximate value of 8ms. In the literature, there are no studies similar to this study, which is, consid
-ering the age groups 40-60 years in normal hearing
individuals.
This study suggested that there is a worsening of the temporal resolution ability in individuals over the age of 41, which differs from the study of Helfer,
Vargo (2008)17 and Sanches et al. (2010)18, studies
performed with aged individuals similar to this study and with normal hearing individuals, because these studies the gap detection thresholds were found
around 4 to 5 ms, on mean values.
Regarding the percentage of correct answers in the G1 GIN_% mean was 73.6% plus a conidence
interval is around 76.9% (Figure 2), a value similar
to those described by other authors who studied hearing individuals normal, but in different age groups, they are Musiek et al. (2005)5, Weihing et al. (2007)19, Rabelo (2008)16, Samelli, Schochat (2008)7, Helfer, Vargo (2009)17 and Perez, Pereira (2010)8.
Continuing with the analysis, G2, G3 and G4 with a mean of 61.2% plus a conidence interval of 68.4% (Figure 2), a value similar to those described by Gallo (2011)14 for a group of normal hearing individuals.
10. Balen AS. Resolução temporal de crianças: comparação entre audição normal, perda auditiva
condutiva e distúrbio do processamento auditivo.
Rev Bras Otorrinolaringol. 2009;75(1):123-9.
11. American Speech Language-Hearing Association. Manual pure-tone threshold audiometry
- ASHA. 1978;20(4):297-301.
12. Santos MFC, Pereira LD. Escuta com dígitos. In: Pereira LD, Schochat E (edits) Processamento
auditivo central: manual de avaliação. São Paulo:
Lovise; 1997. P. 147-50.
13. Keith RW. Manual of the random gap detection test. St. Louis: Auditec; 2000.
14. Gallo J. Resolução temporal em perdas
auditivas neurossensoriais e lesões cerebrais.
Rev. Soc. Bras. Fonoaudiol. [Periódico na internet].
Dez 2012 [acesso em 2013 jan];17(4);[1p.]. Disponível em: http://dx.doi.org/10.1590/
S1516-80342012000400025
15. Chermak JD, Lee J. Comparasion of childresn’s
performance on four tests of resolution temporal. J Acad Am Audiol. 2005;16:554-63.
16. Rabelo CM. Avaliação eletroisiológica e
comportamental do processamento temporal [tese]. São Paulo (SP): Faculdade de Medicina, Universidade de São Paulo; 2008.
17. Helfer KS, Vargo M. Speech Recognition and
Temporal Processing in Middle-Aged Women. J Am Acad Audiol. 2009;20:264-71.
18. Sanches SGG, Samelli AG, Nishiyama AK, Sanchez TG, Carvallo RMM. Teste GIN (Gaps-in-Noise) em ouvintes normais com e sem zumbido. Pró-Fono R Atual Cientíica. 2010;22(3):257-62.
REFERENCES
Alvarez AMMA, Caetano AL, Nastas SS.
Processamento auditivo central. O que é isto? Fono Atual. 1997;1(1):17-8.
2. Pereira LD, Schochat E. Processamento Auditivo
Central, manual da avaliação. São Paulo: Editora
Lovise; 1997.
3. Shinn JB, Chermak GD, Musiek FE. GIN (Gaps-In-Noise) performance in the pediatric population.
USA: J Am Acad Audiol. 2009;20(4):229-38.
4. Zaidan E, Garcia AP, Tedesco MLF, Baran JA.. Desempenho de adultos jovens normais em dois
testes de resolução temporal. Pró-Fono R Atual
Cientíica. 2008;20(1):19-24.
5. Musiek FE, Shinn JB, Jirsa R, Bamiou DE, Baran JA, Zaida E. GIN (gaps in noise) test performance in subjects with conirmed central auditory
nervous system involvement. Ear e Hearing. 2005;26(6):08-18.
6. Schochat E, Rabelo CM, Marculino CF. O teste
Gaps-In-Noise: limiares de detecção de gap em crianças de 9 anos com audição normal. J.Soc. Bras. Fonoaudiol. 2011;23(4):364-7.
7. Samelli AG, Schochat E. Estudo da vantagem da orelha direita em teste de detecção de gap. Rev
Bras Otorrinolaringol. 2008;74(2):235-40.
8. Perez AP, Pereira LD. O Teste Gap in Noise
em crianças de 11 e 12 anos. Pró-Fono R Atual
Cientíica. 2010;22(1):07-12.
9. Liporaci FD. Estudo do Processamento Auditivo
Temporal (resolução e ordenação) em idosos [Dissertação]. Rio de Janeiro (RJ): Universidade Veiga de Almeida; 2009.
RESUMO
Objetivo: avaliar a resolução temporal em indivíduos audiologicamente normais entre 20 e 60 anos. Métodos: 40 indivíduos de ambos os sexos, de 20 aos 60 anos de idade, divididos em quatro grupos
etários contendo 10 indivíduos em cada grupo: Grupo I de 20 a 30 anos; Grupo II de 31 a 40 anos; Grupo III de 41 a 50 anos e Grupo IV de 51 a 60. Todos foram submetidos a procedimentos que
fazem parte da rotina audiológica para caracterizar a audição periférica, e central com destaque nos testes de resolução temporal com tons puros, o Randon-gap-detection-test, e com ruído o Gaps-in-noise. Resultados: os valores médios obtidos para o limiar de detecção de gap no teste
Gaps-in-noise encontram-se em torno de seis milissegundos para os grupos 1 e 2 e de oito, nos grupos 3 e 4.
Veriicou-se limiar de detecção de gap obtido no teste Random-gap-detection-test com valor médio de
10 milissegundos para os grupos 1 e 2 e entre 10 e 15ms nos grupos 3 e 4. Conclusão: a habilidade
de resolução temporal piora com o aumento da idade. Os valores de normalidade dos testes com
seg-mentos de ruído (teste GIN – Gaps In Noise) e tom puro (teste RGDT – Random Gap Test Detection) são crescentes de acordo com a faixa etária avaliada.
21. Queiroz DS, Branco-Barreiro FCA, Momensohn-Santos TM. Desempenho do Teste de Detecção
de Intervalo Aleatório- Random Gap Detection
Teste (RGDT): estudo comparativo entre mulheres jovens e idosas. Rer. Soc. Bras. Fonoaudiol.
2009;14(3):503-7.
19. Weihing JA, Musiek FE, Shinn JB. The effect of presentation level on the Gaps-In-Noise (GIN) test.
J Am Acad Audiol. 2007;18(2):141-50.
20. Muluk NB, Yalçinkaya F, Keith RW.. Random
gap detection test and random gap detection
test-expanded: Results in children with previous language delay in early childhood. Auris Nasus Larynx. 2010;38:6-13.
Received on: March 23, 2014 Accepted on: November 18, 2014
Mailing address:
Bárbara Heloíse Colcerniani Braga.
Rua Santa Cruz, 805, apartamento 102, Vila Mariana