UNIVERSIDADE FEDERAL DO RIO GRANDE DO NORTE PRÓ-REITORIA DE PÓS-GRADUAÇÃO
PROGRAMA REGIONAL DE PÓS-GRADUAÇÃO EM DESENVOLVIMENTO E MEIO AMBIENTE - PRODEMA
Tendências da exploração pesqueira na costa do Rio Grande do
Norte
A BIOTECNOLOGIA VEGETAL COMO ALTERNATIVA PARA A COTONICULTURAFAMILIAR SUSTENTÁVEL
A BIOTECNOLOGIA VEGETAL COMO ALTERNATIVA PARA A COTONICULTURA FAMILIAR SUSTENTÁVEL A BIOTECNOLOGIA VEGETAL COMO ALTER PARA A COTONICULTURA FAMILIAR SUSTENTÁVELAAA
Ludmila de Melo Alves Damasio
2015 Natal – RN
Ludmila de Melo Alves Damasio
Tendências da exploração pesqueira na costa do Rio Grande do
Norte
A BIOTECNOLOGIA VEGETAL COMO ALTERNATIVA PARA A COTONICULTURAFAMILIAR SUSTENTÁVEL
A BIOTECNOLOGIA VEGETAL COMO ALTERNATIVA PARA A COTONICULTURA FAMILIAR SUSTENTÁVEL A BIOTECNOLOGIA VEGETAL COMO ALTER PARA A COTONICULTURA FAMILIAR SUSTENTÁVELAAA
Dissertação apresentada ao Programa Regional de Pós-Graduação em Desenvolvimento e Meio Ambiente, da Universidade Federal do Rio Grande do Norte (PRODEMA/UFRN), como parte dos requisitos necessários à obtenção do título de Mestre.
Orientador:
Prof.ª Dr.ª Adriana Rosa Carvalho
2015 Natal – RN
Catalogação da Publicação na Fonte. UFRN / Biblioteca Setorial do Centro de Biociências
Damasio, Ludmila de Melo Alves.
Tendências da exploração pesqueira na costa do Rio Grande do Norte / Ludmila de Melo Alves Damasio. –
Natal, RN, 2015. 57 f.: il.
Orientadora: Profa. Dra. Adriana Rosa Carvalho.
Dissertação (Mestrado) – Universidade Federal do Rio Grande do Norte. Centro de Biociências. Programa Regional de Pós-Graduação em Desenvolvimento e Meio Ambiente/PRODEMA.
1. Pesca de pequena escala – Dissertação. 2. Conhecimento ecológico dos pescadores. – Dissertação. 3. Eficiência tecnológica barcos. – Dissertação. I. Carvalho, Adriana Rosa. II. Universidade Federal do Rio Grande do Norte. III. Título.
AGRADECIMENTOS
Não se faz um mestrado sozinho. Apesar de aparecer apenas meu nome na capa dessa dissertação, foi preciso muita gente pra ela ficar do jeito que está. E é meu dever agradecer a todos. Primeiro quero agradecer aos meus pais, os melhores que alguém pode ter. Muito obrigada por sempre me incentivar a seguir meu caminho, por me apoiar e puxar minha orelha quando necessário.
Ao Rafa, por estar sempre presente e por compartilhar todas as alegrias e dificuldades. À Adriana por aceitar, de novo, ser minha orientadora. Aqui também vale agradecer pelos puxões de orelha e pela insistência para eu aprender estatística! E junto com o agradecimento à Adriana vai o agradecimento à Priscila, pelos comentários sempre pertinentes, pela ajuda sempre que necessário e pelas valiosas correções.
Às queridas Adrianetes: Ana, Nat, Pocas e a mais nova Adrianete: Maria! Vocês são demais! Sem vocês o mestrado não teria a mesma graça, companhias para todas as horas, inclusive no campo. Sempre prontas para uma fofoca ou uma discussão séria. O mesmo agradecimento vale para a Clara, Rosemberg e Lenice, amizades mais que especiais, que com certeza ficarão para a vida toda.
Um agradecimento especial a todos os pescadores que participaram desse trabalho, principalmente o Zé e o Ademário que além de ajudar sempre que necessário foram ótimas companhias.
A FAPERN pelo financiamento concedido ao projeto “Conhecimento local, estado da pesca artesanal e resiliência socioecológica no Rio Grande do Norte” no qual minha dissertação está inserida e permitiu as idas mensais ao campo.
RESUMO
Tendências da exploração pesqueira na costa do Rio Grande do Norte
Apesar de toda importância, a pesca de pequena escala vive em uma condição de poucos dados. Para gerar conhecimento científico sobre estas pescarias, os pesquisadores têm usado, cada vez mais, o conhecimento ecológico local (CEL) dos pescadores. A grande vantagem no uso do CEL para avaliação da pesca de pequena escala é poder acessar informações do passado não relatadas pela literatura e que requereriam investimento considerável em tempo e recursos financeiros para serem amostradas, quando isto fosse possível. Nessa dissertação buscamos aumentar as informações disponíveis sobre a pesca de pequena escala no estado do Rio Grande do Norte. No primeiro artigo usamos as informações dos pescadores para estimar a Captura por Unidade de Esforço (CPUE) das capturas atuais, de 10 e de 20 anos atrás e identificar as espécies mais capturadas nesse mesmo período e comparamos essas informações com registros de desembarque e dados obtidos com os informantes – chave (pescadores mais velhos e reconhecidos pela comunidade). No segundo artigo analisamos as informações dos barcos utilizados na pesca artesanal para verificar se existe uma frota atuando sobre as mesmas espécies exploradas ou se são frotas diferentes atuando sobre espécies diferentes. No primeiro artigo tal como afirmado pelos pescadores, os resultados não sugerem qualquer alteração na CPUE entre 2003 e 2013. Além de serem bons informantes para estabelecer ordenações de abundância das espécies para as espécies alvo, os pescadores também forneceram estimativas acuradas para a CPUE das melhores capturas no período atual (2013). A abordagem usada nesse estudo mostrou, mais uma vez, que os pescadores possuem importantes e algumas vezes únicas informações. Entretanto, quando esse conhecimento foi comparado com dados formais, apareceram divergências importantes. Esta heterogeneidade de informantes e fontes de dados (dados dos pescadores e dados oficiais) pode ser a única e melhor fonte de informações para a pesca em áreas onde há falta de dados científicos e abundância de pescadores habilidosos. No segundo artigo, os resultados indicam que existem duas frotas diferentes atuando sobre as mesmas espécies. A divisão entre barcos pequenos e grandes mostrou que os barcos pequenos são a melhor opção para os pescadores de pequena escala. Isto se daria porque não foi observada diferença na quantidade capturada das espécies e nos rendimentos obtidos; além disso, as embarcações menores apresentam menores gastos, gerando mais lucros e menos impactos do que os barcos grandes.
Palavras – chave: Pesca de pequena escala; Série temporal; Reconstrução dados;
ABSTRACT
Trends in fisheries exploitation in Rio Grande do Norte coast
Despite all importance, the small-scale fisheries lives in a condition of limited data. To generate scientific knowledge of these fisheries, the researchers have used increasingly, the local ecological knowledge. The great advantage in using the LEC for evaluation of small-scale fishing is able to access past information not reported in the literature and require considerable investment in time and financial resources to be sampled. In this dissertation sought to increase information available on small-scale fishing in Rio Grande do Norte. In the first article we use information of the fishers to estimate the CPUE of current catches of 10 and 20 years ago and identify the species most captured in the same period and compare this information with landing records and data obtained from expert fishers. In the second article we analyze the information of the boats used in artisanal fisheries to check for a fleet operating on the same species exploited or are different fleets operating on different species. In the first article as stated by fishers, the results do not suggest any change in CPUE between 2003 and 2013. In addition to being good informants to establish ranks of species abundance for the target species, fishers also provided accurate estimates for the CPUE of the best catches in the current period (2013). The approach used in this study showed, once again, that fishers have an important and sometimes unique information. However, when this knowledge was compared with formal data, showed major differences. This heterogeneity of informants and data sources (data of fishermen and official data) may be the single best source of information for fishing in areas where there lack of scientific data and abundance of skilled fishers. In the second article, the results indicate that there are two different fleet acting on the same species. The division between small and large boats showed that small boats are the best option for small-scale fishers. Since there is no difference in the amount of captured species and obtained income and expenses of the vessels these categories are much smaller, generating more profits than the big boats.
LISTA DE FIGURAS
Capítulo 1
Figura 1. Study area ... nº pág. 21
Figura 2. Research outline ... nº pág. 26
Figura 3. Difference between mean CPUE informed by fishers and mean CPUE of formal data. ... nº pág.
29
Figura 4. Difference between maximum CPUE informed by fishers and maximum CPUE of scientific data ... nº pág. 30
Figura 5. Difference between maximum CPUE informed by fishers and maximum CPUE of governmental data ... nº pág. 30
Figura 6. Correlation of the rank of species abundance according to fishers from the South with the rank of species abundance according to formal data ... nº pág. 31
Capítulo 2
Figura 1. Study area ... ...nº pág. 43
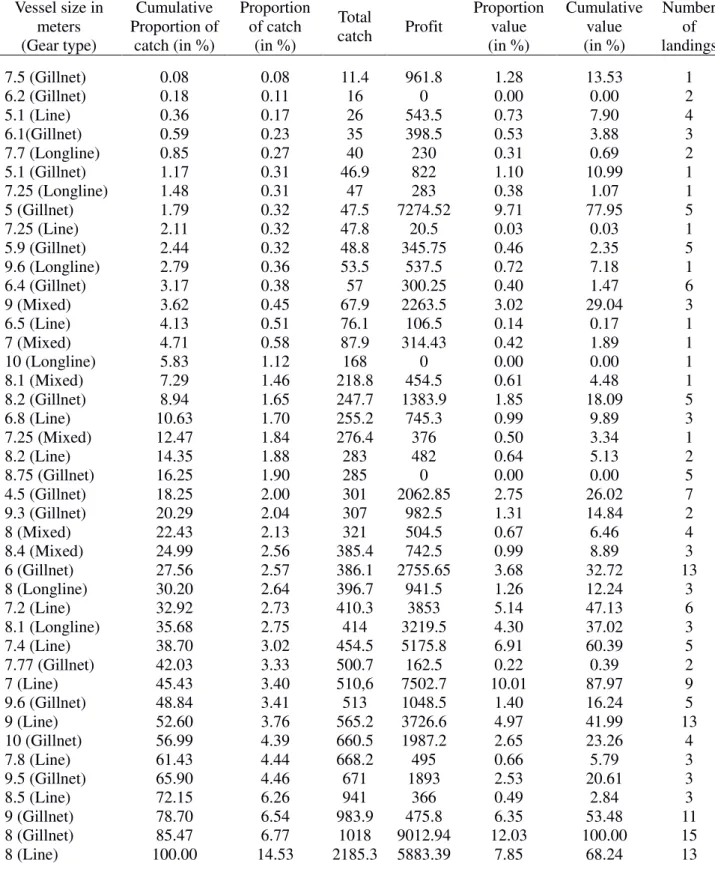
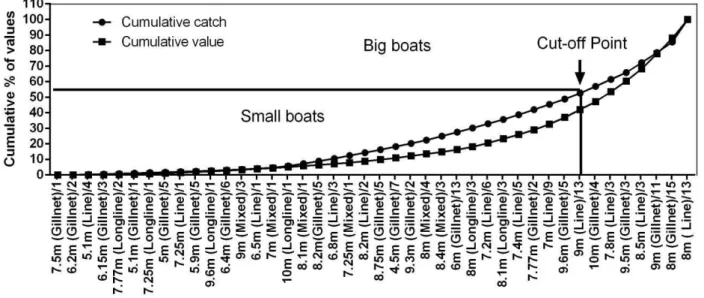
Figura 2. Gear type/vessel size against cumulative percentage of landed value and landed weigth ... nº pág. 49
LISTA DE TABELAS
Capítulo 1
Tabela 1- List of the species registered in landings and/or mentioned by the interviewees. (Appendix). ... ...nº pág. 37
Capítulo 2
Tabela 1- Data on volume (kg) and value of landings ...nº pág. 48
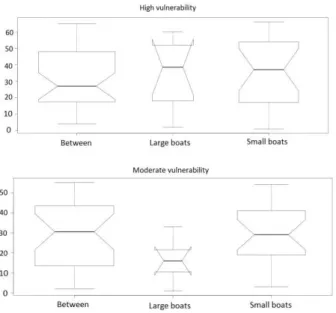
Tabela 2 –Vulnerability and catch os species ...nº pág. 50
SUMÁRIO
INTRODUÇÃO GERAL E REVISÃO DA LITERATURA ...nº pág. 11
METODOLOGIA GERAL ... nº pág. 13
REFERÊNCIAS GERAIS ...nº pág. 15
CAPÍTULO 1 – Desembarques de pesca e reconstrução de dados com informação dos pescadores para auxiliar o manejo pesqueiro...nº pág. 18
INTRODUÇÃO GERAL E REVISÃO DA LITERATURA
Pesca é a captura da vida selvagem aquática, assim como a caça nos ambientes terrestres (PAULY et al., 2002). A relação dos homens com a pesca é tão antiga quanto a própria história, antes mesmo de desenvolver técnicas de criação de animais e agricultura, o homem primitivo tinha a pesca como fonte de alimentos. A princípio, os peixes eram capturados com arpões, no final do paleolítico surgiu o anzol e o início do uso da rede é atribuído ao final do neolítico (DIEGUES, 1983).
No Egito e no Império Romano a pesca já era uma atividade importante e o consumo de pescado era considerável, a atividade era realizada por escravos e o comércio controlado por negociantes especializados. O surgimento do cristianismo impulsionou o consumo de peixe já que passou a ser considerado uma refeição nobre. Além disso, a forma de conservação do pescado também melhorou, enquanto que no Egito apena o sal era utilizado os romanos introduziram a conservação no azeite (DIEGUES, 1983).
Na Idade Média o uso do peixe e óleo de peixe como pagamento entre os camponeses e os senhores feudais e a confecção de redes nos mosteiros proporcionaram um grande avanço da atividade pesqueira, fazendo com que o peixe entrasse definitivamente na alimentação popular (DIEGUES, 1983).
No final do século XI surgiram as corporações de comerciantes empenhados no comércio de pescado, uma vez que o consumo só aumentava, devido principalmente à expansão do cristianismo. Com o aumento da escala de produção o poder de captura dos petrechos e das embarcações também aumentou, a princípio em quantidade. No fim do século XV os holandeses utilizavam redes com 300 pés de comprimento e nove pés de altura cada uma e depois os barcos de pesca acompanharam as inovações da engenharia naval (DIEGUES, 1983).
O processo de pesca se tornou industrializado com a operação dos barcos a vapor e com poderosos guinchos, no início do século XIX e posteriormente com os barcos à óleo após a 1ª Guerra Mundial. O freezer a bordo, radar acústico e localizadores de peixes foram acrescentados após a 2º Guerra dando mais autonomia ainda para as embarcações (PAULY et al., 2002).
Em 2010 a captura de pescado foi de 88,6 milhões de toneladas e quando somados à produção da aquicultura, a pesca produziu 148 milhões de toneladas no mundo todo (com um valor total de US$ 217,5 bilhões). Destes, 128 milhões de toneladas foram utilizadas como alimento para pessoas, possibilitando o acesso a uma fonte de proteína animal de excelente qualidade. Além disso, essa atividade proporciona meios de subsistência e renda para aproximadamente 54,8 milhões de pessoas no mundo todo (FAO, 2012).
Deste total de pescado produzido, estima-se que metade é proveniente da pesca de pequena escala, que apesar de ocorrer no mundo todo é predominante nos trópicos em países subdesenvolvidos (FAO, 2004) (BERKES et al., 2006). A classificação da pesca de pequena escala, também chamada de pesca artesanal (FAO, 2008) depende do contexto de cada localidade (JOHNSON, 2006), mas geralmente é caracterizada como espécies, multi-artes e com quase toda captura de peixe utilizada como alimento (BÉNÉ ET AL., 2007). Essa pesca é uma estratégia de sobrevivência essencial para milhões de famílias e possui uma contribuição significativa no sustento, bem estar e segurança alimentar em comunidades costeiras e rurais nos países mais pobres do mundo (FAO, 2004) (BÉNÉ et al., 2007).
Apesar de toda importância, a pesca de pequena escala vive em uma condição de poucos dados (ANDREW et al., 2007) (FAO, 2008) (TESFAMICHAEL ET AL., 2014) o que leva à desvalorização, falta de investimento, monitoramento e gestão, comprometendo a conservação e manutenção da pesca (GILLETT, R.; LIGHTFOOT, C, 2002) (ZELLER ET AL., 2006a). Em um provável cenário de esgotamento de recursos pesqueiros, já que é reconhecido que pescarias não regulamentadas são mais susceptíveis à sobrepesca (FAO, 2007), as consequências serão muito mais graves, pois, nessas localidades há poucas alternativas de subsistência (FAO, 2008).
Nestes casos, uma alternativa é realizar o manejo “com poucos dados”, usando todas as informações disponíveis (JOHANNES, 1998). Para gerar conhecimento científico sobre estas pescarias, os pesquisadores têm usado, cada vez mais, o conhecimento ecológico local (CEL) (JOHANNES ET AL., 2000) (ROCHET et al., 2008), coletando informações históricas ou atuais sobre processos ecológicos (CARVALHO, 2002), comportamentais (SILVANO, 2001), de tamanho e distribuição dos estoques ou de espécies (AINSWORTH ET AL., 2008) (BENDER et al., 2013) ou sobre regras locais de uso (AMARAL, 2004).
Um dos primeiros estudos a analisar o conhecimento ecológico local dos pescadores sobre peixes marinhos é de MORRIL (1967). Este trabalho foca no conhecimento dos pescadores do Caribe sobre o comportamento dos peixes. O trabalho de (BEGOSSI E GARAVELLO, 1990), que aborda o conhecimento dos pescadores do rio Tocantins, foi o precursor dos estudos sobre conhecimento dos pescadores aqui no Brasil (COSTA-NETO ET AL., 2002) (COSTA-NETO E MARQUES, 2000). Até então, os trabalhos sobre comunidades pesqueiras no Brasil ressaltavam a homogeneidade social e a tradição (DIEGUES, 2005).
A grande vantagem no uso do CEL para avaliação da pesca de pequena escala é poder acessar informações do passado não relatadas pela literatura e que requereriam investimento considerável em tempo e recursos financeiros para serem amostradas (BEGOSSI, 1993) (DIEGUES, 2005) (JOHANNES ET AL., 2000) além de permitir que se avalie o potencial dos pescadores para reportar o passado ecológico da pesca local (HALLWASS et al., 2013).
Os objetivos principais deste estudo são: (1) reconstruir o cenário de explotação de 10 e de 20 anos atrás utilizando informações etnoictiológicas fornecidas pelos pescadores e validar esses dados com dados formais de desembarque; (2) verificar se existe uma frota atuando sobre as mesmas espécies exploradas ou se são frotas diferentes atuando sobre espécies diferentes.
Em atendimento aos objetivos e conforme padronização estabelecida pelo Programa, esta Dissertação se encontra composta por esta Introdução geral, uma Caracterização geral da Área de estudo, Metodologia geral empregada para o conjunto da obra (dissertação) e por dois capítulos que correspondem a artigos científicos a serem submetidos à publicação. O Capítulo 1, intitulado “Matching reconstructed and landing data to overcome data missing in small -scale fisheries”, está submetido ao periódico Plos One e, portanto, está formatado conforme este periódico. O Capítulo 2, intitulado “É possível subdividir a pesca de pequena escala?”, será submetido ao periódico Fisheries Research e, portanto, está formatado conforme este periódico.
CARACTERIZAÇÃO GERAL DA ÁREA DE ESTUDO
Locais de estudo
O litoral do RN divide-se em setentrional e oriental, tendo Touros como o município divisório. Esta separação é baseada em aspectos climáticos, geomorfológicos, fitogeográficos e tectônicos que afetam a direção dos ventos e padrão de circulação oceânicos.
1) Litoral setentrional (Touros e Macau)
Nos últimos anos, estes dois municípios são os que mais se destacam, aparte de Natal, na produção da pesca artesanal. Touros, por exemplo, detinha em 2006, a maior frota pesqueira potiguar somando 403 embarcações (10,7%) (IBAMA, 2007). Touros destaca-se pela produção de lagosta, enquanto Macau destaca-se pela maior produção de sardinhas (Clupeidae) e voador (Hirundichthys affinis) do estado. Estudos recentes mostram uma certa discrepância nas espécies alvos entre os municípios, com a região de Macau destacando-se com a captura de tainha (Mugil curema) e voador (H. affinis), principalmente, e a região de Touros destacando-se com a produção de serra (Scomberomus brasiliensis) e ariocó (Lutjanus
synagris) (SILVA, 2010).
2) Região central (Natal - Canto do Mangue)
De fato, esta região enquadra-se no litoral oriental, mas está separada aqui por diferir grandemente em termos de atividade pesqueira e por estar em uma posição intermediaria entre as outras duas regiões de estudo. O município de Natal responde pela maior parte da captura da pesca artesanal do estado (34% entre 1996 e 2006) (SILVA ET AL., 2009). Apesar da existência de vilas espalhadas pelo município que também praticam a pesca artesanal, boa parte do desembarque dá-se na região do Canto do Mangue, um bairro à beira do Rio Potengi e próximo à estrutura portuária a qual atende especialmente a pesca industrial. Destacam-se a produção de tainhas (Mugil curema) e vermelhos (Lutjanidae).
3) Litoral oriental (Tibau do Sul e Baia Formosa)
Tibau do Sul e Baía Formosa são os dois municípios que mais se destacam no litoral oriental em termos de produção pesqueira, cada um tendo capturado 3.6% e 2.3% da produção pesqueira artesanal estadual entre 1996 e 2006 (SILVA ET AL., 2009). Embora com uma produção menor que as outras regiões descritas, este litoral destaca-se na captura da albacorinha (Thunnus atlanticus) especialmente em Baía Formosa e de tainha em Tibau do Sul (SILVA ET AL., 2009).
Foram escolhidas duas comunidades pesqueiras, que são importantes portos de desembarques do estado, para o estudo: Baía Formosa localizada no litoral sul, e no litoral norte a comunidade de Caiçara do Norte.
REFERÊNCIAS GERAIS
AINSWORTH, C. H.; PITCHER, T. J.; ROTINSULU, C. Evidence of fishery depletions and shifting cognitive baselines in Eastern Indonesia. Biological Conservation, v. 141, n. 3, p. 848–859, mar. 2008.
AMARAL, B. D. DO. Fishing territoriality and diversity between the ethnic populations Ashaninka and Kaxinawá ,Breu river, Brazil/Peru. Acta Amazonica, v. 34, n. 1, p. 75–88, jan. 2004.
ANDREW, N. L. et al. Diagnosis and management of small-scale fisheries in developing countries. Fish and Fisheries, v. 8, n. 3, p. 227–240, 2007.
BEGOSSI, A. Ecologia Humana: Um Enfoque Das Relacões Homem-Ambiente. Interciencia, v. 18, n. 1, p. 121 – 132, 1993.
BEGOSSI, A.; GARAVELLO, J.C. Notes on the ethnoichthyology of fishermen from the Tocantins River (Brazil). Acta Amazonica, v. 20, p. 341–351, 1990.
BENDER, M. G. et al. Biogeographic, historical and environmental influences on the taxonomic and functional structure of Atlantic reef fish assemblages: Taxonomic and functional structure of reef fish assemblages. Global Ecology and Biogeography, v. 22, n. 11, p. 1173–1182, nov. 2013.
BÉNÉ, C.; MACFADYEN, G.; ALLISON, E. H. Increasing the contribution of small-scale fisheries to poverty alleviation and food security. [s.l.] Food and Agriculture Organization of the United Nations, 2007.
BERKES, F. et al. Gestão da pesca de pequena escala: diretrizes e metodos alternativos. Rio Grande: Editora Furg, 2006.
CARVALHO, A. R. Conhecimento ecológico no “varjão” do alto rio Paraná: alterações antropogênicas expressas na linguagem dos pescadores. Acta Scientiarum. Biological Sciences, v. 24, n. 0, p. 581–589, 13 maio 2008.
DIEGUES, A. C. El mito moderno de La natureza intocada. Sao Paulo: NUPAUB: USP, 2005.
DIEGUES, A. C. S. Pescadores, camponeses, trabalhadores do mar. [s.l.] Ed. Àtica, 1983.
DULVY, N. K.; POLUNIN, N. V. C. Using informal knowledge to infer human-induced rarity of a conspicuous reef fish. Animal Conservation, v. 7, n. 4, p. 365–374, nov. 2004.
COSTA-NETO, E.M; DIAS, C.V; DE MELO, M.N. O conhecimento ictiológico tradicional dos pescadores da cidade de Barra, região do Médio São Francisco, estado da Bahia,Brasil. Acta Scientarium, v. 24, n. 2, p. 561–572, 2002.
COSTA-NETO, E. M; MARQUES, J. G.W. Etnoecologia dos pescadores artesanais de Siribinha, município de Conde (Bahia): aspectos relacionados a etologia dos peixes. Acta Scientarium, v. 22, n. 2, p. 553–560, 2000.
FAO. The State of World Fisheries and Aquaculture 2006. Rome: FAO, 2007.
FAO. Small-scale capture fisheries – a global overview with emphasis on developing countries. A preliminary report of the Big Numbers Project. [s.l.] FAO, 2008.
FAO. The state of word fisheries and aquaculture 2011. Rome: FAO, 2012.
GILLETT, R.; LIGHTFOOT, C. The Contribution of Fisheries to the Economies of Pacific Island Countries. Pacific Studies Series. Manila: Asian Development Bank, 2002.
HALLWASS, G. et al. Fishers’ knowledge identifies environmental changes and fish abundance trends in impounded tropical rivers. Ecological Applications, v. 23, n. 2, p. 392– 407, 1 mar. 2013.
IBAMA. Estatistica da Pesca 2007, Brasil - Grandes regioes e unidades da Federacao. Estatistica da Pesca, p. 1–151, 2007.
JOHANNES, R. The case for data-less marine resource management: examples from tropical nearshore finfisheries. Trends in Ecology & Evolution, v. 13, p. 243–246, 1998.
JOHANNES, R.; FREEMAN, M. M. R.; HAMILTON, R. J. Ignore fishers’ knowledge and miss the boat. Fish and Fisheries, v. 1, p. 257–271, 2000.
JOHNSON, D. S. Category, narrative, and value in the governance of small-scale fisheries. Marine Policy, v. 30, n. 6, p. 747–756, nov. 2006.
MORRIL, W.T. Ethnoichthyology of the Cha-Cha. Ethnology, 1967.
PAES, E.T.; MARINHO,N. In: Biologia Marinha. 1. Rio de Janeiro: Pereira R. C and Soares G., 2002.
PAULY, D. et al. Towards sustainability in world fisheries. Nature, v. 418, n. 6898, p. 689– 695, 8 ago. 2002.
RAMIRES, M.; MOLINA, S. M. G.; HANAZAKI, N. Etnoecologia caiçara: o conhecimento dos pescadores artesanais sobre aspectos ecológicos da pesca. Biotemas, v. 20, n. 1, p. 101– 113, 1 jan. 2007.
ROCHET, M. J. et al. Ecosystem trends: evidence for agreement between fishers’ perceptions and scientific information. ICES Journal of Marine Science, v. 65, n. 6, p. 1057–1068, set. 2008.
SILVA, A. C. A pesca de pequena escala nos litorais setentrional e oriental do Rio Grande do Norte. Fortaleza: Universidade Federal do Ceara, 2010.
SILVA, A. F.; MEDEIROS, T. H. L.; SILVA, V. P. Pesca artesanal - conflito, cultura e identidade: o caso potiguar (CCHL, Ed.). In: XVII SEMANA DE HUMANIDADES.
CCHL, UFRN, 2009Disponível em:
<http://www.cchla.ufrn.br/humanidades2009/Anais/anais.html>
TESFAMICHAEL, D.; PITCHER, T. J.; PAULY, D. Assessing Changes in Fisheries Using Fishers’ Knowledge to Generate Long Time Series of Catch Rates: a Case Study from the Red Sea. Ecology and Society, v. 19, n. 1, 2014.
Matching fishers’ knowledge and landing data to
overcome data missing in small-scale fisheries
Ludmila de Melo Alves Damasio¹*, Priscila Fabiana Macedo Lopes²,3, Rafael Dettogni Guariento4, Adriana Rosa Carvalho²
1 Graduation Program in Development and Environment at Federal University of Rio Grande do Norte/UFRN, Natal, Brazil
2 Department of Ecology at Federal University of Rio Grande do Norte/UFRN, Natal, Brazil 3 Fisheries and Food Institute, Santos, Brazil
4 Center of Biological and Health Sciences University of Mato Grosso do Sul/ UFMS, Campo Grande, Brazil *ludmila.damasio@hotmail.com
Abstract
Background: In small-scale fishery, information provided by fishers has been useful to complement current and past lack of knowledge on species and environment.
Methodology: Through interviews, 82 fishers from the largest fishing communities on the north and south borders of a Brazilian northeastern coastal state provided estimates of the catch per unit effort (CPUE) and rank of species abundance of their main target fishes for three time points: current day (2013 at the time of the research), 10, and 20 years past. This information was contrasted to other available data sources, respectively: scientific sampling of fish landing (2013), governmental statistics (2003), and information provided by expert fishers (1993).
Principal findings: Fishers were more accurate when reporting information about their maximum CPUE for 2013, but their maximum CPUE differed than the highest landing records in the governmental data (2003). Fishers were also accurate at establishing ranks of abundance of their main target species for all periods. Fishers' beliefs that fish abundance has not changed over the last 10 years (2003–2013) was corroborated by governmental and scientific landing data. Except for three species, fishers overestimated their mean CPUE per species.
Conclusions: The comparison between official and formal landing records and fishers' perceptions revealed that fishers are accurate when reporting maximum CPUE, but not when
Introduction
Small-scale fisheries (SSFs) provide food security, welfare, and livelihood sustenance
for many coastal communities in the poorest countries in the world [1]. Despite and also due
to their relevance, fishing resources have been intensively exploited, causing large effects on
marine ecosystems worldwide [2].
Fisheries, including marine, continental fishing, and aquaculture, are estimated to have
produced 154 million tons of fish worldwide in 2011 [3]. About 55 million direct jobs are
generated by these activities, of which up to 90% are occupied by small-scale fishers who end
up supplying half of the world's fish [4]. Brazil produced 1.4 million tons of fish in 2011,
including aquaculture, marine, and continental fishing. Following the world trend, an
estimated 45% of the continental and marine fish in Brazil are caught by small-scale fishers.
Most of these fisheries are located at the northeastern coast, which alone provides 32% of the
Brazilian production. The Brazilian small-scale fishing sector employs 957,000 people,
showing its social and economic relevance [5].
Nevertheless, the Brazilian SSFs are highly overlooked, which also seems to be a
tendency worldwide for SSFs [6] [7]. The lack of public policies for the sector results in
unreported and unregulated activity around the world, for which there are barely any financial
resources, staff, logistics, or skills in management agencies to collect fishery data [8]. What is
known usually comes from a few independent, usually short-term, and research-based
endeavors [9]. In the absence of reliable information, we can only obtain a partial picture of
what is happening to fish stocks and what could be the best management actions to avoid
resource and subsequent societal collapse, as the SSFs are mostly concentrated in the poorest
segments of societies [10].
Therefore, in the absence of data, researchers have increasingly used information
[17]. However, although fishers' knowledge can provide detailed information and helpful
material to management, especially when there is no other data available [18], it is often
difficult to contrast such information with official data. Such comparisons could identify if all
or parts of the information provided by fishers were comparable to what would be obtained
through formal methods. Fishers hold facts and memories that may not be registered
elsewhere [13]; therefore, an understanding of the precision of this information could define
what can and cannot be applied to management in the absence of better data or as a
complement to it. Further, this understanding could avoid costly data sampling procedures
[19] and could complement information over temporal scales [20] [21].
Here, we contrasted two formal datasets (governmental and scientific) with data
provided by fishers to assess the agreement between the different sources. Specifically, we
tested if fishers' perception of past and current catches per unit effort (CPUE) (mean and
maximum catches) and rank of species abundance matched the formal landing data.
Understanding the aspects where information agrees and disagrees could show that not all
information provided by fishers is the same, which could direct future research addressing
unreported but sometimes valuable past and present information to direct management.
Materials and Methods
Sampling site
The coastal fishing area assessed is located on the Brazilian northeast in the Rio
Grande do Norte state (4°49'53''S, 35°58'03''W, and 6°58''57'', 38°36''12''W; Figure 1). This
coastline has 25 towns and 93 fishing communities along 399 km. Most of the fish landings of
this state are done in the capital, Natal (34% of the total landings of the state, mostly
industrial). However, the origin of this fishing is difficult to trace, as Natal harbors boats with
reasons and the impossibility of disaggregating small from large-scale data in Natal,
interviews were conducted at two of the main small-scale fishing ports in their respective
regions: one in the north (Caiçara do Norte—6.9% of all the state landings, herein North) and
one in the south (Baía Formosa—2.3% of all landings, herein South) [22]. Current (scientific
sampling) and past official fish landing data were also registered in these two villages (Fig. 1).
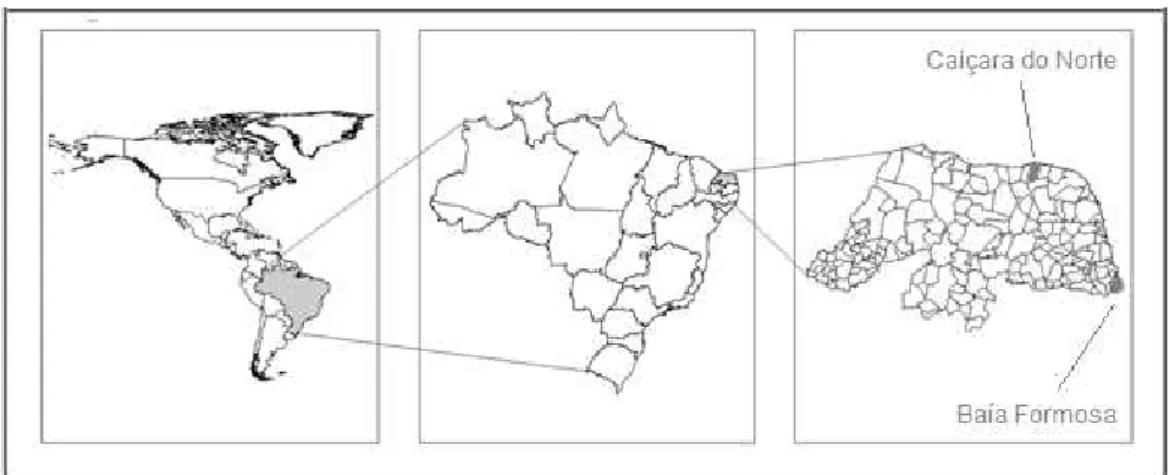
Fig. 1. Study area. Fishing communities sampled in the north (Caiçara do Norte) and in the south (Baía Formosa) of the Rio Grande do Norte State, Brazilian northeast.
Caiçara do Norte is the largest fishing community in the north state, housing 800
active fishers. Since there is no pier or harbor, fishers land anywhere along the only beach (8
km long) in the village. Because there is no communal landing site and because of the extent
of the beach and the history of drug-associated violence in parts of it, the formal sampling
effort was concentrated on a third of the area, where roughly 250 fishers land their catches.
Fortunately, based on what was observed during fieldwork and talks with fishers, this
apparently happens to be the place where most fish landings take place. In Caiçara do Norte,
the main target fishes are Coryphaena hippurus (dolphinfish, locally named dourado) and
Hirundichthys affinis (flying fish, locally named peixe voador) [23].
Baía Formosa has a landing site, the Harbor Beach, where all the formal landings were
sampled. Baía Formosa's main catches are Thunnus atlanticus (blackfin tuna, locally known
as albacora) and Lutjanus analis (mutton snapper, locally known as cioba) [23]. In 2014, the
As it is common in Brazil, the number of registered fishers considered active by the
local fishers’ association does not accurately represent the number of fishers really engaged in
fishing. Although some of these fishers will fish only sporadically, they will make sure they
are permanently registered to have access to social benefits, such as retirement and/or a
minimum wage during specific fish closed season.
Scientific, governmental, and informal data assessed
Scientific and governmental data
A research team recorded fish landing (hereafter referred to as scientific data) from
January 2013 to March 2014, an interval chosen for including a full fishing cycle, from the
blackfin tuna period to black grouper (Mycteroperca bonaci) migration period. Both ports (in
the north and south) were visited simultaneously on two days each month. All landings from 6
am to 6 pm were registered. Information on the amount of species caught, fishing effort, and
fishing gear (types and quantities) were recorded. Fishing effort was measured as hours at sea
and crew size.
The nation's environmental agency, the Brazilian Institute of Environment and
Renewable Natural Resources (IBAMA), provided past landing data for the two studied areas
only for 2003, because neither IBAMA nor any other governmental body did not sample any
data for 1993 or 2013. The governmental data included the same type of information as the
scientific data, as these official samples were done to inform the Food and Agriculture
Organization of the United Nations (FAO). However, the quality of these data has been
questioned before, as have data provided by multiple countries [24].
Informal data to reconstruct catches and fish abundance
The research team also gathered informal data through face-to-face interviews with 82
fishers (North=50; South=32) and nine expert fishers (North=5; South=4). As explained
fishers, fishing rarely. These sporadic fishers were not interviewed, as it was expected that
they would not be able to provide detailed past information. After providing personal
information, such as name, age, and fishing experience, fishers were asked questions that
would allow the reconstruction of catches and the establishment of a rank of abundance of
fish species currently (at the time of the interview: 2013), 10 (2003), and 20 (1993) years ago.
Only fishers older than 18 years and with more than five years of fishing experience were
approached.If the fisher hadless than 20 years of experience, he was interviewed only for the
reconstruction of CPUE and to inform the rank of species abundance for the fishery in 2013.
The interviewees' fishing experience ranged from eight years (in the South) to 48 years (in the
North), and the average age was 43 (range 20–62 y).
Data sampling was approved according to the guidelines of the Committee of Ethics at
the Federal University of Rio Grande do Norte (Protocol of approval
No.19685113.3.0000.5537). Before each interview, fishers were approached and informed
about the research purpose. Only those who gave verbal consent were included in the study.
The ethical committees’ guidelines allow oral consent due to the likelihood of illiterate
interviewees and/or traditional communities not willing to tape recording. Here the verbal
consent was indeed necessary due to the high proportion of illiteracy among fishers and was
always witnessed by a third person from the university but not involved in the research.
Data sampling to reconstruct catches
The interviewed fishers provided information on crew sizes, hours at sea, catches, and
types and quantities of gear used. As in other studies recording fishers' memories (e.g., [7]), a
few questions were adapted to guarantee better understanding by fishers and to elicit their
memories. Accordingly, for each of the three years (2013, 2003, and 1993), fishers were
asked about the fish species they caught (a free list of species) and the species and amounts of
fish caught (kg) in their best catches. For each of the species cited, they were asked to
understand that a mean catch meant their regular catches. Thus, they were asked about those
catches they considered neither good enough to be called great catches nor bad enough to be
considered among the worst. The fishers understood this concept and were able to estimate
mean catches informing species and amount caught.
To avoid the tendency of fishers to believe that past catches were always better than
current catches (called retrospective bias by [25]), the fishers were not asked to provide
information chronologically, but were asked first about 2003, then 1993, and, finally, 2013.
Data sampling to reconstruct fish abundance
The abundance of species (in kg) in 2003 was extracted from the governmental data
supplied by IBAMA for comparison with a rank of species abundance established by the
fishers themselves. These species from the governmental data were categorized as high,
average, and low abundance, and the intervals for each of the categories varied according to
village. This was necessary because the villages tend to focus on different species with very
discrepant abundances.
In the southern community, the intervals were coded following a logarithmic scale
[26]: species that represented more than 7t in the official records for 2003 were considered
highly abundant; species with total catches between 0.3t and 2t were classified as of average
abundance (there were no species between 2.1 and 6.9t); and any species below that level
were classified as low abundance. A random choice of 20 species was made from the final
list, containing high-, average-, and low-abundance species. Then, four species of high-, three
species of average-, and four species of low-abundance were chosen randomly to be discussed
in interviews. Fishers were presented pictures of these 11 species and asked to rank them from
the highest to the lowest abundances in current catches and in catches from 10 and 20 years
past.
However, this approach did not work in the North. Fishers simply did not understand
high-, average-, and low-abundance currently, for 10 years, and 20 years past, regardless of
the pictures. In both areas (North and South) the fishers spontaneously informed when the low
abundance species became scarce or completely disappeared.
Fish species abundance reconstructed by expert fishers
Nine fishers (five in the South and four in the North) were approached as expert
fishers (hereafter EFs), after multiple suggestions of currently active fishers. When summed
up, their fishing experience represented more than 427 years of observations.
Through face-to-face interviews, the EFs were assessed to contrast information
provided by regular fishers regarding the fishing status of 20 years ago (target species,
abundance, and CPUE) because this information was not available elsewhere. EFs are older
and more experienced fishers who are expected to have specific and detailed knowledge on
local fishery issues. Here, EFs included those older than 40 years and who had lived their
entire lives in the same communities; all of the EFs had stopped fishing but still visited the
landing sites daily, mainly because of their influential status as knowledgeable fishers.
The EFs were asked which species were most abundant when they began to fish,
which species decreased or disappeared from the catches since then, and whether any other
species had become fishing targets since they started fishing.
CPUE estimates
The CPUE was defined as catches (kg)/number of fishers × hours fishing; and was
calculated for the best catches (maximum CPUE) and for average catches (mean CPUE) using
official and informal (interviews) datasets. The fishers' data provided information to calculate
CPUE for 1993, 2003, and 2013. However, because the EFs, the only source of information
for 1993, could not provide CPUE data for 1993, the fishers’ CPUE could only be compared
to: 1) governmental data for 2003 (fish landing sampled by IBAMA); and 2) scientific data
(fish landing sampled by researchers) for 2013. Therefore, the CPUE estimated by fishers for
The CPUE was estimated per species and per fishing gear. Only species registered in
at least two landing samplings and mentioned by at least two fishers during the interviews
were used to calculate the estimates. The modal value for the variable hours at sea and crew
size, per gear, was used to fill in the occasional lack of information in the governmental data
for 2003.
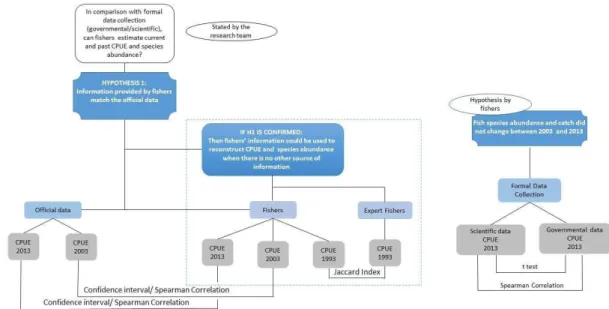
Questions
Two different questions related to catches were statistically tested, as detailed in Fig.
2.
Fig. 2. Research outline. Questions and hypotheses raised by the research team and fishers that guided the statistical analyses performed regarding the CPUE for 1993, 2003, and 2013.(See text for details.)
1. Did the fisheries change between 2003 and 2013?
In the interviews, fishers claimed that the CPUE and rank of species abundance did
not change between 2003 and 2013. To investigate if fishers were correct in their collective
belief, the CPUE from governmental data (2003) and the CPUE from scientific data (2013)
were compared by t-test using GraphPad Prism Version 6.01 for Windows. The data from the
South had to be bootstrapped due to data heteroscedasticity. To test the fishers' perceptions
about the lack of change in the rank of species abundance, all the species were first ranked for
most to least abundant. The two official ranks were then compared by the Spearman's rank
correlation coefficient. This non-parametric test measured the strength of the association
between two ordinal variables using the order in which the species appeared rather than the
observed values.
2. Can fishers provide accurate estimates for past, present, and maximum CPUE and for
changes in the rank of species abundance?
A confidence interval analysis was performed to assess the difference between the CPUE by
species reconstructed by fishers and the CPUE estimated from the governmental data (2003)
and the scientific landing sampling (2013). The difference between the CPUE estimated using
the data provided by fishers and the governmental/scientific data were bootstrapped using
Microsoft Excel and the supplement Pop Tools [27]. Negative confidence interval values
meant that fishers underestimated the CPUE for a given species, while values higher than zero
meant that fishers overestimated the species' CPUE. Values crossing the zero line showed no
difference between the CPUE estimated by fishers and that provided by
governmental/scientific data.
Fishers provided information that allowed the estimation of 1,075 individual CPUE for
43 species caught in 2003 or in 2013. However, for better accuracy, only species quoted by
two fishers and also recorded in the governmental and in the scientific sampling had their
CPUE taken into account, which resulted in 763 individual CPUE for 22 species. A list of
species registered in the landing samplings and mentioned by the interviewees is provided in
S1 Appendix.
For 1993, the information on the rank of species abundance provided by fishers was
compared to information provided by EFs on species that they considered abundant and
species they thought had decreased or disappeared, which was used as a control, assuming
that the experts had better knowledge. In this case, as there was number of citations per
The Spearman's rank correlation coefficient was used to verify whether the rank of
species abundance reported by fishers for 2003 and 2013 in the South and North areas
corresponded to the species that comprised most of landings (in kg), in the same order, in the
governmental and scientific data for the same years respectively.
Results
Reconstructing catches
1. Did the fisheries change between 2003 and 2013?
All fishers said that their fisheries did not change between 2003 and 2013. Confirming
their claim, the CPUE estimated from the governmental landing data (for 2003) did not differ
from the CPUE estimated from the scientific landing data (2013) in both villages (south:
t=0.1, p= 0.202; north: t = 1.6, p = 0.118).
Conversely, the species abundance rank differed between 2003 (governmental data)
and 2013 (scientific data) for the South (Spearman's r=0.38, p= 0.15), but not for the North
(Spearman's r=0.6, p=0.003).
2. Can fishers provide accurate estimates for mean past, mean present, and maximum
CPUE and for changes in the rank of species abundance?
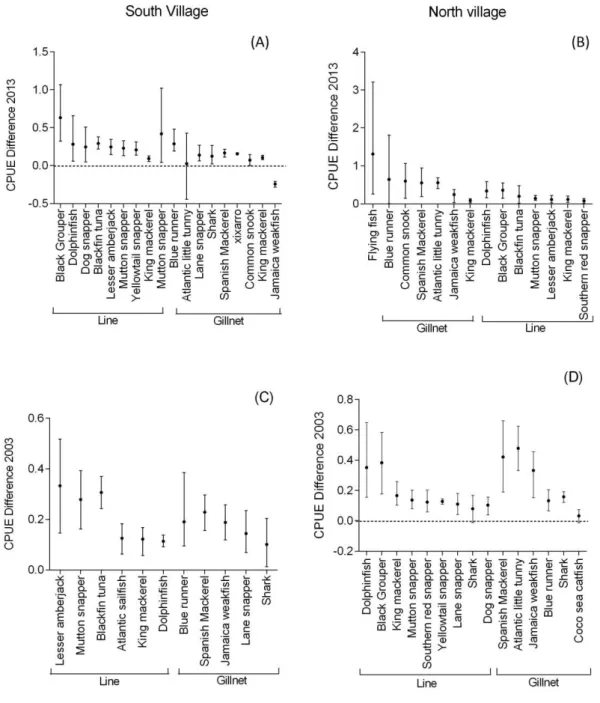
The fishers tended to overestimate the mean CPUE for roughly all species, regardless
of the year or gear used to exploit each species. The fishers' information only matched official
data significantly for three fish species caught by gillnets: Atlantic little tunny (Fig. 3A),
sharks, and coco sea catfish (Fig. 3D). For the other 13 species, fishers' information was close
Fig. 3. Difference between mean CPUE informed by fishers and mean CPUE of formal data. Mean value and confidence interval of the difference between the CPUE provided by fishers (2003 and 2013) and the CPUE calculated from governmental data (2003) and from scientific data (2013). Fig. A: South village in 2013; Fig. B: North village in 2013; Fig. C: South village in 2003, and Fig. D: North village in 2003. Flying fish was not included due to its large confidence interval (CI—
upper: 2.64; lower: 0.23). Dotted line is not shown when the difference between the values was not negative (as in Figs. 3B, 3C).
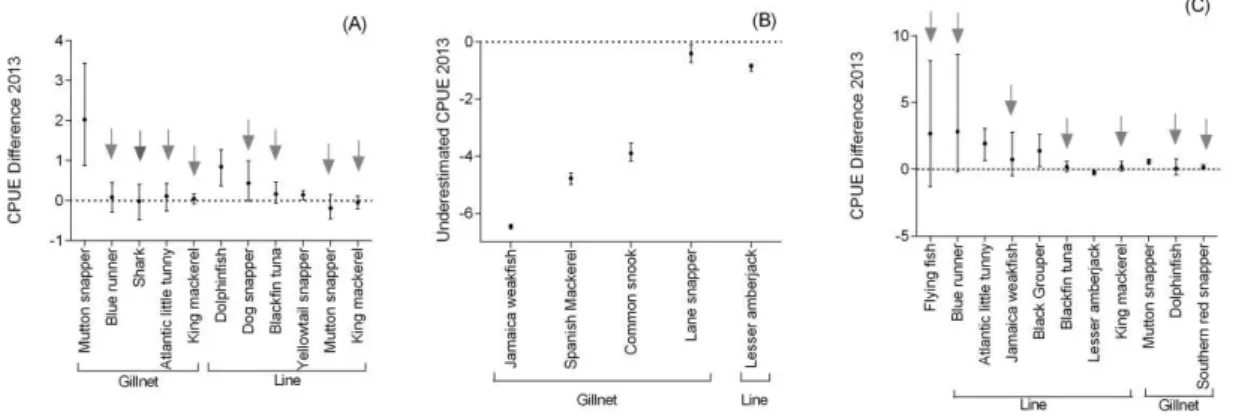
Theinformation provided by fishers on their maximum CPUE allowed the calculation
of 55 CPUE estimated for the years 2003 and 2013 to 18 species caught by handline or
and scientific (2013) data. Of the 55 compared CPUE, 18 were not statistically different (the
significant measures are identified by arrows in Fig. 4). However, of these 18, 16 (eight in
each region) referred to 2013 fishing events, mostly using handlines. The remaining measures
were usually overestimates of the fishers' maximum CPUE.
Fig. 4. Difference between maximum CPUE informed by fishers and maximum CPUE of scientific data. Mean value and confidence interval of the difference between maximum CPUE according to fishers and according to scientific landing data (records for 2013). (A) CPUE overestimated (vertical dotted line) by fishers or similar to the official data (see arrows) in the South village; (B) CPUE underestimated by fishers in the South village. Black Grouper (underestimated) is not shown due to its large confidence interval (mean: -10.489; upper: -9.954; lower: -10.934); (C) CPUE overestimated or similar (arrows) to the CPUE of official data in the North village.
For 2003, fishers' information on their maximum CPUE only matched the maximum
Fig. 5. Difference between maximum CPUE informed by fishers and maximum CPUE of governmental data. Mean value and confidence interval of the difference between the maximum CPUE estimated using fishers' information and the maximum CPUE according to the governmental data (landing records for 2003) in the South village (A) and the North village (B).
The rank of species abundance provided by fishers from the South was highly
correlated with the rank of species abundance estimated from the governmental data for 2003
(r=0.75; p=0.009) and with the rank of species abundance estimated from the scientific data
for 2013 (r=0.88; p=0.000; Fig. 6). Although significant, the correlations for the North
showed worse results (2003: r=0.4, p=0.01; 2013: r=0.3, p= 0.05).
Fig. 6. Correlation of the rank of species abundance according to fishers from the South with the rank of species abundance according to formal data. (A) scientific landing data for 2013 (2013 r=0.88, p=0.000) and (B) ) governmental landing data for 2003 (r=0.75, p=0.009).
The EFs reported the decrease or disappearance of 10 species from the fish landings in
the last 40 years. In fact, four species mentioned by the EFs were not recorded in the landings
for 2013 or 2003 (northern red snapper, Atlantic goliath grouper, and two species of Atlantic
bumper). For the other four species (lesser amberjack, black salmon, great hammerhead, and
queen triggerfish), the EFs reported low catches since 2003. Even though the EFs pointed out
decreased catches of dolphinfish and Spanish mackerel, these species are still among those
most caught in the southern and northern coastal areas. According to the EFs, catches were
higher in the past.
Fishers were able to provide more information on their maximum CPUE than on their
CPUE of average catches. However, this information could not be compared to other
measures due to lack of any source of official data and the difficulties the EFs had reporting
quantitative data.
Both in the South (Jaccard index: 0.33) and North (Jaccard index: 0.37), there were
high similarities in the species composition for 1993 between the information provided by
fishers and the information provided by EFs.
Discussion
Since Johannes' seminal paper in 1981 [28], which suggested the importance of using
fisher's knowledge, different studies have supported his claims, showing the consistency of
data provided by fishers with direct use in fishery management [7] [21] [11]. Recently, some
researches have shown that fishers' knowledge, if combined with scientific data, could also be
useful in filling the gaps required to understand fisheries [17] [13]. Here, official data was
compared to information provided by fishers regarding CPUE and target species.
Additionally, one hypothesis raised by the fishers themselves (i.e., that the CPUE did not
change in the last decade) was tested using only official data. If proved correct, this last
hypothesis could also give support to fishers' knowledge. Indeed, as claimed by fishers, the
findings did not show any change in the CPUE from 2003 to 2013. In addition to being good
informants to establish ranks of abundance for their target species, the fishers also provided
accurate estimates of their maximum CPUE in the most recent period (2013).
However, the fishers tended to overestimate mean CPUE. Some research has
suggested that fishers can have trouble perceiving trends in catch variability along time series
[29], which could make it difficult to measure this variability in relation to fishing effort. This
could explain the difficulties fishers had when informing CPUE. On the other hand, some
usually underestimates catches, mainly in small-scale fisheries [30] [31] [32]. Therefore, at
least in 2003, the fishers' information cannot be completely disregarded. Such discrepancies
between the data sources has yet another implication. While management will be based on
official data sources, fishers will keep believing in their perceptions of higher values of
CPUE, threatening the success of any management actions due to lack of compliance [33].
Thus, assessing the agreement between governmental and scientific CPUE with the CPUE
perceived by fishers can guide managers on how to address the lack of acceptance among
fishers, who do not understand why such measures are necessary if fisheries, according to
their beliefs, have not changed.
The fact that the CPUE did not change between 2003 and 2013 does not necessarily
imply no changes in the fish stock, as fishers probably changed the proportions and sizes (for
nets) of gears used. This can also be a source of confusion for the fishers, as they may not
perceive changes in their catches or even time spent fishing due to the adoption of more
efficient gears. This also means that for some fishers, especially the younger ones, this may
suggest safe and productive stocks, which disagrees with the opinion of expert fishers. The
experts indicated lower catches for multiple species, including those more commonly caught
currently, such as dolphinfish and Spanish mackerel. The different views between older and
younger fishers qualify for what the literature refers to as the shifting baseline syndrome [34].
The good precision of fishers when reporting their maximum CPUE has been
registered recently in other studies (e.g., [7]). Fishers may better remember their best catches
because such memories are associated with uncommon and pleasant fishing events [35] and
are likely the recollections fishers talk about most. However, it is worth noting that, here, their
memories of maximum CPUE and the most abundant species referred mainly to migratory
target fishes. Therefore, when attempting to reconstruct data from fishers' recollections, it
may be important to notice if a species is a main target. Fishers may be less precise the less
The approach used is this study showed, once again, that fishers hold important and
sometimes unique information. However, different than other studies, when such knowledge
was compared to more formal data, it also showed important divergences, mainly suggesting
that fishers tend to overestimate their CPUE and are more accurate in reporting CPUE on
recent best catches. This should be seen as a caution sign when using fishers' information: not
everything can be taken for granted, as fishers, just like the rest of us, may forget or mix
information. Finally, the use of official data combined with information provided by expert
fishers allowed the reconstruction of CPUE for two periods using two different sources of
data. This heterogeneity of informants and data sources may be the only and best source of
information for fisheries in areas where there is shortage of scientific data but abundance of
skillful fishers.
Acknowledgements
We thank the fishers for their kindness and patience. Special thanks to Ana Helena, Natalia
and Clarice for helping in the fieldwork. We are also very grateful to IBAMA, especially Mr.
José Airton de Vasconcelos, for kindly providing the data on fish landings for 2003.
References
1. Teh LSL, Teh LCL, Sumaila UR. Quantifying the overlooked socio-economic contribution of small-scale fisheries in Sabah, Malaysia. Fish Res. 2011;110: 450–458. doi:10.1016/j.fishres.2011.06.001
2. Pauly D, Hilborn R, Branch TA. Fisheries: Does catch reflect abundance? Nature. 2013;494: 303–306. doi:10.1038/494303a
3. FAO. The state of world fisheries and aquaculture - 2012. Rome; 2012 p. 209.
4. Béné Christophe. Small-scale fisheries: Assessing their contribution to rural livelihoods in developing countries. Rome: FAO; 2005 p. 46.
6. Zeller D, Booth S, Pauly D. Fisheries contributions to the gross domestic product: underestimating small-scale fisheries in the Pacific. Mar Resour Econ. December 2006a;21: 355+.
7. Tesfa i hael D, Pit her TJ, Paul D. Assessi g Cha ges i Fisheries Usi g Fishers’
Knowledge to Generate Long Time Series of Catch Rates: a Case Study from the Red Sea. Ecol Soc. 2014;19. doi:10.5751/ES-06151-190118
8. Béné C, Hersoug B, Allison EH. Not by Rent Alone: Analysing the Pro-Poor Functions of Small-Scale Fisheries in Developing Countries. Dev Policy Rev. 2010;28: 325–358. doi:10.1111/j.1467-7679.2010.00486.x
9. Vasconcelos EMA, Lins JE, Matos JA, Junior W, Tavares MM. Perfil socio-economico dos produtores da pesca artesanal maritima do Estado do Rio Grande do Norte. Bol Tec Cient CEPENE. 2003;11: 277–292.
10. Andrew NL, Béné C, Hall SJ, Allison EH, Heck S, Ratner BD. Diagnosis and management of small-scale fisheries in developing countries. Fish Fish. 2007;8: 227–240. doi:10.1111/j.1467-2679.2007.00252.x
11. Carvalho AR, Williams S, January M, Sowman M. Reliability of community-based data monitoring in the Olifants River estuary (South Africa). Fish Res. 2009;96: 119–128. doi:10.1016/j.fishres.2008.08.017
12. Le Fur J, Guilavogui A, Teitelbaum A, Rochet M-J. Contribution of local fishermen to improving knowledge of the marine ecosystem and resources in the Republic of Guinea, West Africa. Can J Fish Aquat Sci. 2011;68: 1454–1469. doi:10.1139/f2011-061
13. Rosa R, Carvalho AR, Angelini R. Integrating fishermen knowledge and scientific analysis to assess changes in fish diversity and food web structure. Ocean Coast Manag. 2014;102: 258–268. doi:10.1016/j.ocecoaman.2014.10.004
14. Poizat,G, Bara ,E. Fisher e ’s k o ledge as a kgrou d i for atio i tropi al fish ecology: a quantitative comparison with fish sampling results. Environ Biol Fishes. 1997;50: 435–449.
15. García-Allut, A, Freire, J, Barreiro, A, Losada, D.E. Methodolog for i tegratio of fisher’s ecological knowledge in fisheries biology and management using knowledge
represe tatio artifi ial i tellige e . The Value of A e dote Fishers’ K o ledge i
Fisheries Science and Management, Coastal Management Sourcebooks. Paris: UNESCO Publishing,; 2007. pp. 227–237.
16. Willia s, A., Ba , N. I tegrati g fisher’s k o ledge ith sur e data to u dersta d the structure, ecology and use of a seascape off south-eastern Australia. Fishers’ K o ledge in Fisheries Science and Management, Coastal Management Sourcebooks,. Paris: UNESCO Publishing; 2007. pp. 41–58.
18. Joha es R, Free a MMR, Ha ilto RJ. Ig ore fishers’ k o ledge a d iss the oat. Fish Fish. 2000;1: 257–271.
19. Johannes R. The case for data-less marine resource management: examples from tropical nearshore finfisheries. Trends Ecol Evol. 1998;13: 243–246.
20. Eddy TD, Gardner JPA, Pérez-Matus A. Appl i g Fishers’ E ologi al K o ledge to Construct Past and Future Lobster Stocks in the Juan Fernández Archipelago, Chile. PLoS ONE. 2010;5: 1–12. doi:10.1371/journal.pone.0013670
21. Hall ass G, Lopes PF, Juras AA, Sil a o RAM. Fishers’ k o ledge ide tifies environmental changes and fish abundance trends in impounded tropical rivers. Ecol Appl. 2013;23: 392–407. doi:10.1890/12-0429.1
22. Silva AF, Medeiros THL, Silva VP. Pesca artesanal - conflito, cultura e identidade: o caso potiguar. In: CCHL, editor. CCHL, UFRN; 2009. p. 1. Available: http://www.cchla.ufrn.br/humanidades2009/Anais/anais.html
23. MMA. Relatório final do projeto de monitoramento da atividade pesqueira no litoral do Brasil. Projeto ESTATPESCA. Brasília; 2006 p. 328.
24. Zeller D, Harper S, Zylich K, Pauly D. Synthesis of underreported small-scale fisheries catch in Pacific island waters. Coral Reefs. 2014; doi:10.1007/s00338-014-1219-1
25. Daw TM. Shifting baselines and memory illusions: what should we worry about when inferring trends from resource user interviews?: Shifting baselines and memory illusions. Anim Conserv. 2010;13: 534–535. doi:10.1111/j.1469-1795.2010.00418.x
26. Forti uo i T, Li ralato S, Rai e i h S, Gio a ardi O, Solidoro C. Codi g Earl Naturalists’ Accounts into Long-Term Fish Community Changes in the Adriatic Sea (1800–2000). Thrush S, editor. PLoS ONE. 2010;5: e15502. doi:10.1371/journal.pone.0015502
27. Hood, G. M. PopTools. Available on the internet; 2010.
28. Johannes RE. Working with Fishermen to Improve Coastal Tropical Fisheries and Resource Management. Bull Mar Sci. 1981;31: 673–680.
29. Johnson TR, Van Densen WLT. Benefits and organization of cooperative research for fisheries management. ICES J Mar Sci J Cons. 2007;64: 834–840. doi:10.1093/icesjms/fsm014
30. Leitão F, Baptista V, Zeller D, Erzini K. Reconstructed catches and trends for mainland Portugal fisheries between 1938 and 2009: implications for sustainability, domestic fish supply and imports. Fish Res. 2014;155: 33–50. doi:10.1016/j.fishres.2014.02.012
31. Cisneros-Montemayor AM, Cisneros-Mata MA, Harper S, Pauly D. Extent and
i pli atio s of IUU at h i Me i o’s ari e fisheries. Mar Poli . ; : –288.
doi:10.1016/j.marpol.2012.12.003
33. Karper MAM, Lopes PFM. Punishment and compliance: Exploring scenarios to improve the legitimacy of small-scale fisheries management rules on the Brazilian coast. Mar Policy. 2014;44: 457–464. doi:10.1016/j.marpol.2013.10.012
34. Papworth SK, Rist J, Coad L, Milner-Gulland EJ. Evidence for shifting baseline syndrome in conservation. Conserv Lett. 2009; doi:10.1111/j.1755-263X.2009.00049.x
35. Matlin, M.W. Cognition. NY, USA: Hoboken; 2004.
S1. Appendix.
List of the species registered in landings and/or mentioned by the interviewees.
Common name - Portuguese
Scientific name Common name -
English
Agulha Hemirhamphus brasiliensis Ballyhoo
Agulhão chato
Agulhão de vela/Agulhão Istiophorus albicans Atlantic sailfish
Albacora Thunnus atlanticus Blackfin tuna
Arabaiana Seriola fasciata Lesser amberjack
Arabaiana chata Seriola rivoliana Longfin yellowtail
Ariacó Lutjanus synagris Lane snapper
Bagre Bagre bagre Coco sea catfish
Bejupirá Rachycentron canadum Black salmon
Boca mole Larimus breviceps Silver snapper
Bonito Euthynnus alletteratus Atlantic little tunny
Cação
Many sharks species from
different families Shark
Cação cavala Isurus oxyrinchus
Shortfin mako shark
Cambuba Haemulon parra Sailor's grunt
Camurim Centropomus undecimalis Common snook
Cavala branca/Cavala Scomberomorus cavalla King mackerel
Cavala preta/Cavala Acanthocybium solandri Wahoo
Cioba Lutjanus analis Mutton snapper
Corá Lutjanus campechanus Northern red
snapper
Cururuca Micropogonias furnieri
Whitemouth croaker
Curvina Pareques acuminatus High-hat
Dentão Lutjanus jocu Dog snapper
Dorminhoco Lobotes surinamensis Tripletail
Dourado Coryphaena hippurus Dolphinfish
Espada Trichiurus lepturus Largehead hairtail
Galo do alto Alectis ciliaris African pompano
Garacimbora Caranx latus Horse-eye jack
Garajuba/ Garaxumba Caranx crysos Blue runner
Guaiuba Ocyurus chrysurus Yellowtail snapper
Judeu Menticirrhus americanus
Southern kingcroaker
Mero Epinephelus itajara Atlantic goliath
grouper
Palombeta açu/Palombeta
chata Chloroscombrus sp Atlantic bumper
Pargo Lutjanus purpureus
Southern red snapper
Pescada Cynoscion jamaicensis Jamaica weakfish
Salema Anisotremus virginicus Porkfish
Sardinha Opisthonema oglinun
Atlantic thread herring
Sirigado Mycteroperca bonaci Black Grouper
Tainha Mugil curema White mullet
Voador Hirundichthys affins Flying fish
Xaréu Caranx lugrubis Black Jack
Size matters: fishing less and yielding more in smaller-scale fisheries
.Ludmila de Melo Alves Damasio¹*, Priscila Fabiana Macedo Lopes²,3, Maria Grazia Pennino2, Adriana Rosa Carvalho²
1Graduate Program in Development and Environment at Federal University of Rio Grande do
Norte/UFRN, Natal, RN, Brazil.
2Department of Ecology at Federal University of Rio Grande do Norte/UFRN, Natal, RN, Brazil. 3 Fisheries and Food Institute, Santos,SP, Brazil.
Abstract
Several factors influence catches and the sustainability of fisheries, and such factors might be different depending on the scale such fisheries work. Small-scale fisheries (SSF) are usually regarded as more sustainable and more relevant for food security and maintenance of livelihoods than large or industrial scale ones, which by no means have assured SSF more attention from science or policies. Here we investigated the existence of possible variations and sub-divisions within small-scale fisheries themselves, regarding their economic performance and relative social and environmental impacts in order to understand which categories of the fleet are best positioned to ensure sustainability. By doing so, we intended to investigate if it is worth in the first place for the small-scale fisheries to aim to grow towards larger scales. We sampled economic and ecological data from small-scale fish landings and information on technological efficiency of this fleet, using a northeastern Brazilian state as a case study. We defined a cut-off point to separate the small-scale fisheries in two categories of boats, according to their size and gear. We then compared their CPUE and the factors affecting it within each category; we also compared economic (number of boats, number of registered landings, jobs created, gears used, data of fishery operations (average capture, travel time and total time of the fishery), revenues, costs, profits, revenue per unit of effort (RPUE) and profit per unit of effort (PPUE) and ecological factors (vulnerability of species caught)) between the two categories. Small boats spent less time fishing and employed comparatively fewer people as crew, however the CPUE and profits of small boats was higher and the both categories explore species with the same vulnerability. Therefore being smaller, even within the SSF category, seems to be a more advantageous strategy, because growing does not guarantee neither better catches nor higher profits. These findings should be taken into account when defining new policies, such as the distribution of subsidies.
Keywords: fishing scale; policy objectives; socioeconomic variables.
Introduction
All fisheries consist in a variety of vessel type that differ greatly in terms of vessel
size, gears used, technology implemented, fishing grounds reached and degree of expertise of
the fishermen. All these factors are also highly dependent on the market characteristics, on the
conditions of the targeted fish stocks, and on a range of social aspects such as local culture