www.rpped.com.br
REVISTA
PAULISTA
DE
PEDIATRIA
ORIGINAL
ARTICLE
Prevalence
of
sedentary
behavior
and
its
correlates
among
primary
and
secondary
school
students
Rodrigo
Wiltgen
Ferreira
a,∗,
Airton
José
Rombaldi
a,
Luiza
Isnardi
Cardoso
Ricardo
b,
Pedro
Curi
Hallal
a,b,
Mario
Renato
Azevedo
aaPhysicalEducationPostGraduationProgram,UniversidadeFederaldePelotas(Ufpel),Pelotas,RS,Brazil
bEpidemiologyPostGraduationProgram,UniversidadeFederaldePelotas(Ufpel),Pelotas,RS,Brazil
Received11February2015;accepted4June2015 Availableonline9October2015
KEYWORDS
Sedentarylifestyle; Adolescentbehavior; Adolescents;
Television; Internet
Abstract
Objective: Todeterminethestudents’exposuretofourdifferentsedentarybehavior(SB) indi-catorsandtheirassociationswith gender,grade,age,economic statusandphysicalactivity level.
Methods: Across-sectionalstudywasconductedin2013.TheSBwascollectedusingtheHELENA instrument,composedbyscreentimequestions(TV,videogamesandinternet)andsitting activ-itiesonschooloppositeshift.Thecutpointof≥2h/daywasusedtocategorizetheoutcome.
ThePoissonregressionwas usedfor associationsbetweentheoutcomeandtheindependent variables(95%significancelevel),controllingforconfoundingvariablesandthepossibledesign effect.
Results: Thesamplewascomposedby8661students.TheoverallprevalenceofSBwas69.2% (CI95%68.1---70.2)onweekdays,and79.6%(CI95%78.7---80.5)onweekends.Femalesweremore associatedwiththeoutcome,excepttoelectronicgames.Advancedgradesstudentsweremore involvedinsittingtaskswhencomparedtotheearlygrades.Olderstudentsweremorelikely tosurfonnetfor≥2h/day.Highereconomiclevelstudentsweremorelikelytoengageinvideo
gamesandinternet.ActiveindividualswerelesslikelytoengageinSBonweekdays.
Conclusions: TheprevalenceofSBwashigh,mainlyonweekends.Theassociationswithsex, age,gradeandphysicalactivitylevelshouldbeconsideredintoelaborationofmoreefficient interventionsonSBcontrol.
©2015SociedadedePediatriadeSãoPaulo.PublishedbyElsevierEditoraLtda.Thisisanopen accessarticleundertheCCBYlicense(https://creativecommons.org/licenses/by/4.0/).
∗Correspondingauthor.
E-mail:[email protected](R.W.Ferreira).
http://dx.doi.org/10.1016/j.rppede.2015.09.002
Prevalenceandassociatedfactorsofsedentarybehaviorinscholars 57
PALAVRAS-CHAVE
Estilodevida sedentário; Comportamentodo adolescente; Adolescentes; Televisão; Internet
Prevalênciadecomportamentosedentáriodeescolaresefatoresassociados
Resumo
Objetivo: Determinaraexposic¸ãodeescolaresaquatroindicadoresdiferentesde comporta-mentosedentário(CS)esuasassociac¸õescomgênero,sérieescolar,idade,condic¸ãoeconômica eníveldeatividadefísica.
Métodos: Um estudo transversal foi realizado em 2013. Os CS foram obtidos utilizando o instrumentoHELENA,compostoporperguntassobretempodetela (TV,videogamese inter-net) eatividades na posic¸ão sentada naescola em relac¸ão ao turno. Oponto de cortede
≥2horas/diafoiusadoparacategorizarodesfecho.AregressãodePoissonfoiutilizadapara
avaliarassociac¸ões entreodesfechoe asvariáveisindependentes(nívelde significânciade 95%),controlandoasvariáveisdeconfusãoeopossívelefeitododesenho.
Resultados: Aamostrafoicompostapor8661alunos.A prevalênciageraldeCSfoide69,2% (IC95%:68,1---70,2)emdiasdesemana,e79,6%(IC95%:78,7---80,5)nosfinsdesemana.Osexo femininomostroumaiorassociac¸ãocomodesfecho,excetoparajogoseletrônicos.Estudantes de séries mais avanc¸adas estavam mais envolvidosem tarefas na posic¸ão sentada, quando comparadoscomassériesiniciais.Osalunosmaisvelhoserammaispropensosanavegarna internet pormaisde duashoraspordia.Estudantescomcondic¸ão econômicamaiselevada erammaispropensosapassarotempoemvideogameseinternet.Indivíduosativoserammenos propensosaseenvolveremCSduranteasemana.
Conclusões: AprevalênciadaCSfoielevada,principalmentenosfinsdesemana.Asassociac¸ões comsexo,idade,sérieescolareníveldeatividadefísicadevemserconsideradasparaelaborar intervenc¸õesmaiseficientesnocontroledosCS.
©2015SociedadedePediatriadeSãoPaulo.PublicadoporElsevierEditoraLtda.Esteéumartigo OpenAccesssobalicençaCCBY(https://creativecommons.org/licenses/by/4.0/deed.pt).
Introduction
SincetheendofWorldWarII,therewasanintensificationin thecommunicationprocess,particularlystimulatedby tele-vision watching.Thereareseveral benefitsof intensifying thecommunicationprocess,butinrecent decadesstudies haveshownthatexcessivesedentarytimecanleadtopoor health, particularlyamongthe newgenerationsthatgrow in an eraof massive technologyuse.1 Sedentary behavior (SB)isbeingconceptualizedintheliteratureasanyactivity withanenergycostequaltoorlessthan1.5METs,1heldin recliningorsittingposture.2
Childhoodandadolescenceareparticularlyrelevantfor the study of SB because the period is characterized by markedphysicalandmentalchanges.3Inthissense,there isevidence thatSBplaysdirectly impactsonmanyhealth outcomes, such as obesity, metabolic syndrome and car-diovascular diseases,4---6 also been described as relatedto reductionsinlifeexpectancy.7Duetoitseffectsonhealth, recommendations on SB were released in 2001, with an updateon2011.8
A recent review study identified 24 Brazilian studies about SB, most of which focusing on digital media or screen time (television, gamesand computer).9 However,
1Unitofphysicalactivityintensityreferredtobasalmetabolism.
OneMETisequivalentto3.5ml/kg/min.or1kcal/kg/h.For exam-ple,vigorouswalkingrequiresfourtimesmoreenergythanbasal metabolism,therefore, 4 METs.The fact of being in a standing positionrequirestwotimesmoreenergythanbasalmetabolism(2 METs),thus,theindividualisnotconsideredonSB.
differencesinmeasurementtools(questionnairestructure), aswellasanalyticalapproaches(SBthresholds,regression types, and possible confounder control) make it difficult tocompare data fromdifferent studies. In addition, it is necessarytoanalyzethepossibleassociationswithsocial, demographicand behavioralvariables inordertoconduct effectiveinterventionsoncontrollingSB.
Theaimofthepresentstudywastoevaluateexposureto fourdifferentindicatorsofSBamongadolescentsofPelotas, Brazil, and itsassociations withgender, grade, age, eco-nomiclevelandphysicalactivity.
Method
This crosssectional study was partof the third follow-up data collection of an intervention called ‘‘Physical Edu-cation +: Practicing health at school’’. This study was conductedin56publicschoolsofthecityofPelotas,Brazil in2012 and2013. The main objectiveof theintervention wastodisseminateinformationrelatedtophysicalactivity andgeneralhealththroughphysicaleducationclasses.Data presentedinthisarticleareasnapshotofexposuretoSB.
random strategy was adopted to selected school in each strata, totaling40 schools in thesample on2012. On the secondyearofthestudy(2013)thesamesamplingstrategy wasadopted, but another18 schools were included. Two schools were removed from the original sample (raffled on2012).One schoolrefused toparticipateonthe study, andanotherwasexcludedbecausealltheeligiblestudents belongtothenightshift.An importantpointis thatafter thedatacollectionbeginning on2013 therewasnoother refuses. The final number of participating schools (n=56) represented67%ofalltheeligibleschoolsonthecity.
An adapted version ofthe ‘‘HELENA’’ instrument,first proposed by Rey-López et al.11 (Kappa coefficient>0.7), wasusedtoassessSB.The instrumentwastranslatedinto Portuguese and then back to Spanish, in orderto ensure informationclarityand meaning.SBis evaluatedby ques-tionsabouttheuseoftelevision,electronicgames,internet andacademic activitiesoninverseshiftclasses.Questions aredone first about week days and then about weekend days.ToquantifythedurationofSB,thereisatimescale whichtheintervieweemustchoosebetweenseventime cat-egories,rangingfrom‘‘none’’to‘‘fourhoursormore’’per day.SBwascategorizedaccordingtotherecommendations oftheAmericanAcademyofPediatrics.8
The data collectionoccurred from 2013 Marchto May. Students fromgrades 5 to12 were invited to participate of the study. The questionnaire was self-administered in theclassroomundertrainedinterviewersupervision. The administration of the questionnaire was collective. The students filled up the questions after the interviewer’s explanationforeveryquestion.Ifastudenthadanydoubt, theinterviewershouldsolveitindividually.
Theindependentvariablesusedinthisanalysisweresex, age(categorizedinfivegroups<12,13,14,15,≥16),grade
(5thto12thgrade),socioeconomicstatusandphysical activ-ity. The socioeconomic status classification was based on an assetsindex later categorizedintoquintiles, following principalcomponentanalysis. Thequestionnaire by Farias etal.12 wasusedtoassessphysicalactivitylevels(validity:
k=0.59 and CCI=0.88/reproducibility: k=0.52 and Spear-man=0.62).Thisinstrumenthasalistofphysicalactivities, inwhichtheintervieweeshouldansweraboutthefrequency and duration of the activities performed on the previous week.Atotalphysicalactivityscorewascalculatedandlater categorizedasmeetingcurrentrecommendationsof300min per week or not.13 As an operational decision, only the leisuretimephysicalactivitysectionwasused.Theoriginal instrumentwastestedinpublicschoolsoftwoclosecities. Datawere doubleentered in EpiData 3.1 program and the analyses were performed using Stata 12.0. Poisson regression wasusedin theadjusted analysis toverifythe association between each typeof sedentary behavior and the independent variables, adjustingfor confounders and the possible design effect. Besides that, onthe adjusted analysis,allindependentvariableswithap-value>0.20were excludedfromthemodel,anda95%significancelevelwas adoptedfortheassociationsbetweentheoutcomeandthe exposures.
The study was approved by the Ethics Committee in Research of the Physical Education School of the Federal UniversityofPelotasundertheprotocol039/2011.Written consentwasrequested fromparents ofstudents under18 yearsof age,and directly fromstudentsaged18 or more years.
Results
The sample comprised 8661 students, representing 57.7% of all eligible individuals. Response rates were 47.6% in secondary school and 59.7% in primary school. Most par-ticipants were females (53.1%), attended primary school (76.8%), were younger than 12 years (28.6%) and were activein leisuretime(57.5%). Thetotal sedentary behav-ior prevalence was 69.2% on weekdays and 79.6% on weekends.
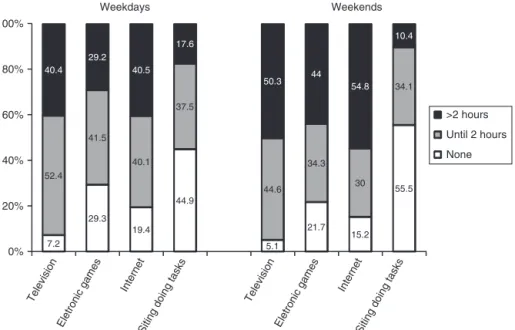
Fig.1describesthetimeusedforeachSBtypeon week-daysandweekenddays.TVviewingfortwoor morehours
7.2 29.3
19.4 44.9
5.1 21.7
15.2 55.5 52.4
41.5
40.1 37.5
44.6 34.3
30 34.1 40.4
29.2 40.5
17.6
50.3 44 54.8 10.4
0% 20% 40% 60% 80% 100%
Weekdays Weekends
>2 hours
Until 2 hours
None
Television
Eletronic games Internet
Siting doing tasks
Television
Eletronic games Internet
Siting doing tasks
Prevalenceandassociatedfactorsofsedentarybehaviorinscholars 59 30.8 29.8 23.5 13.5 2.4 20.4 26.5 28.5 21.3 3.3 30.9 27.2 24 15.2 2.7 19 24.1 28.7 24.7 3.4 30.8 32.2 23 11.9 2 21.7 28.6 28.3 18.2 3.2 0 5 10 15 20 25 30 35
0 1 2 3 4 0 1 2 3 4
Weekdays
All
Boys
Girls Weekends
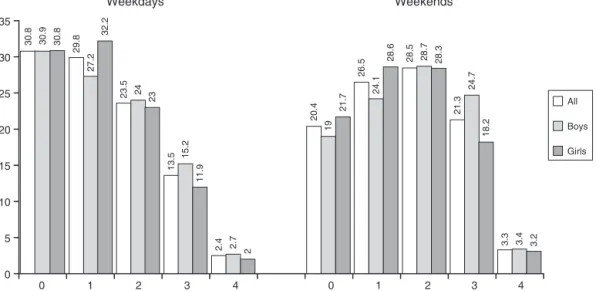
Figure2 Accumulationofsedentarybehaviorontwoormorehoursperdayindifferentindicatorsofsedentarybehavior,Pelotas-RS Brazil,2013,n=8661.
perdaywasreportedby40%oftheadolescentsonweekdays and by50% on weekenddays.The proportion of students usingelectronicgamesfor twoor morehoursperdaywas 29%onweekdaysand44%onweekenddays.Forinternetuse, theseproportionswere41%and55%,respectively.Spending twoormorehoursdoingsitting-tasksattheinverseschool shiftwasreportedby18%oftherespondentsonweekdays andby10%onweekenddays.
Fig.2illustratestheaccumulationofSBfor≥2h/dayon
different types of behaviors measured. For the weekdays period,31%ofthesampleaccumulate≤2h/dayinany
mea-suredSB,30%reported2hormoreperdayinonebehavior, 23%accumulatedintwoSBtypes,14%inthreetypesand2% inthe fourtypesmeasured. On weekendsthe proportions were20%,27%,29%,21%and3%,respectively.
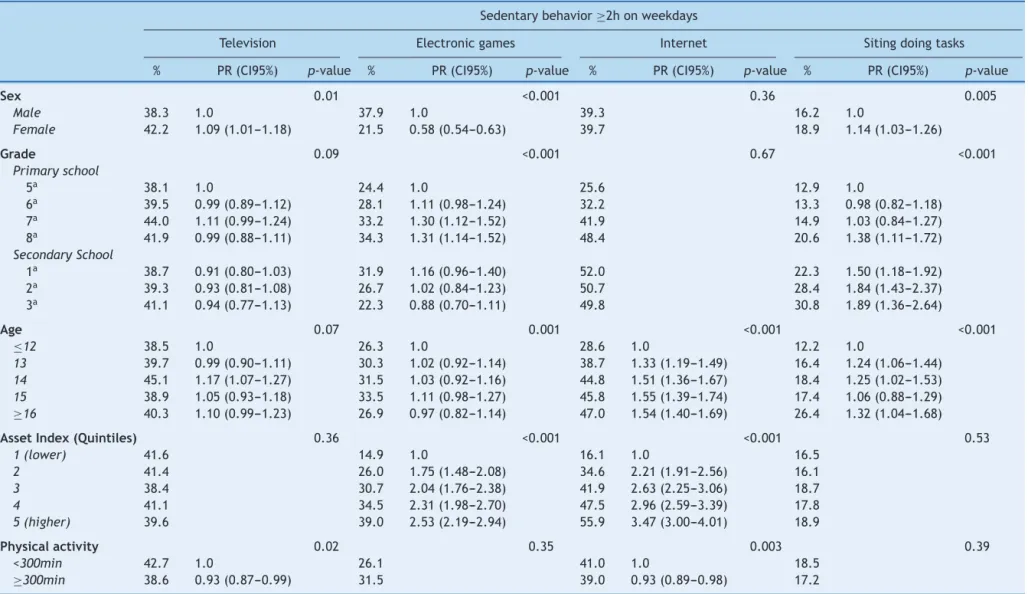
Table 1shows theadjusted analysisbetween excessof SB (≥2h/day) on weekdays according to the independent
variables.GirlsweremorelikelythanboystobewatchTV forlongerperiods,aswellastoperformsittingtasksatthe inverse schoolshift. Boys, onthe other hand, were more likelythangirlstospendtwoormorehoursperdayplaying electronicgames.Nosexdifferenceswerefoundfor com-puteruse.Performingsittingtasksontheinverseschoolshift increasedaccordingtograde.Theuseofelectronicgames andinternetfortwoormorehoursperdaywashigheramong highsocioeconomicleveladolescentsascomparedtothose fromlowersocioeconomicgroups.Activeadolescentswere lesslikelytowatchTVorusetheinternetfortwoormore hoursperdayascomparedtotheirinactivepeers.
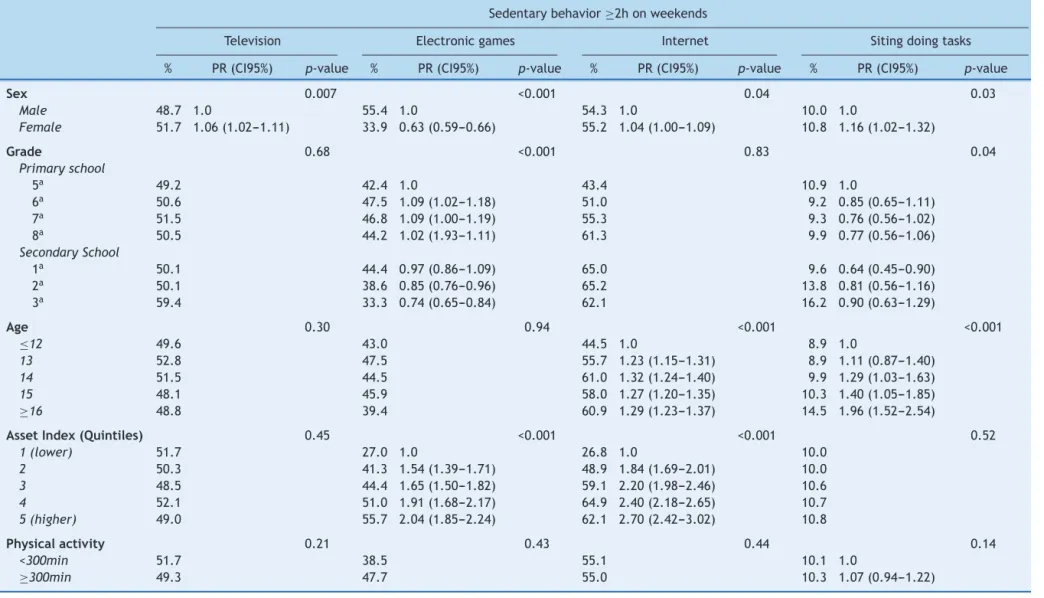
Table2illustratestheadjustedanalysisbetweenexcess ofSB(≥2h/day)onweekenddaysaccordingtothe
indepen-dentvariables.Girlsweremorelikelythanboystospendtwo or morehours inall SB,except playingelectronic games. Those fromhigher grades were less likelyto perform sit-tingtasksonweekends.Thepositiveassociationsbetween socioeconomicstatusand(a)playingelectronicgamesand (b) using the internet were confirmed for weekend days. Physical activity levels did notpredict any type of SB on weekends.
Discussion
This study aimed toevaluate exposure to SB in a city in southernBrazil,aswellastostudyitsassociationwithsex, grade,age,economicstatusandphysicalactivitylevel.The difficultiesencountered by the international and national literatureinestablishingtherealmagnitudeoftheSBand itsassociatedfactors,stemfromdifferentcultures/customs employedin research and SB routineof each population. Thus contributing to SB understanding and its associated factors is important for interventionsto focus onregular populationinteractionwithdigitalmediainsteadofbanning thetechnologyfrompeople’slives.
TherewasaclearupwardtrendinSBin weekenddays ascomparedtoweekdays.Data froma multicenterstudy conducted in seven European countries using the same instrumenttoaccessSBfoundthesamerelationship.14 How-ever,a reviewstudy onSBin children15 and astudyusing accelerometry16 found associations on the inverse direc-tion,pointing touncertainty onthe relationship between SBandweekends.Cultural,environmentalandsocial stan-dardsinherentofeach regionor countrycaninfluence SB andperhapsexplainthedifferencesacrossstudies.
Specifically about the indicators of SB, there is solid evidenceregardingscreentime.The prevalenceof exces-sive time watching television in this study corroborates withotherpublishedstudies.17,18Fortheremaining screen-related behaviors, the prevalence found here was also similartopreviousstudies.19,20Inareviewstudyconducted byBarbosaFilhoetal.,9alargevariationintheprevalence ofSBwasdetectedacrossstudies.Instudiesusingacutoff of2hdaily,theprevalencerangedfrom32%inastudy con-ductedinthecityofFozdoIguac¸uto88%inastudyinOuro Preto,MG.9
Itwaspossible toidentifya large accumulationof dif-ferent types of SB for ≥2h/day, especially on weekend
Ferreira
RW
et
al.
Table1 Adjustedanalysisbetweenexcessofsedentarybehavior(≥2h/day)andsociodemographicandbehavioralvariablesonweekdays,Pelotas-RSBrazil,2013,n=8661.
Sedentarybehavior≥2honweekdays
Television Electronicgames Internet Sitingdoingtasks
% PR(CI95%) p-value % PR(CI95%) p-value % PR(CI95%) p-value % PR(CI95%) p-value
Sex 0.01 <0.001 0.36 0.005
Male 38.3 1.0 37.9 1.0 39.3 16.2 1.0
Female 42.2 1.09(1.01---1.18) 21.5 0.58(0.54---0.63) 39.7 18.9 1.14(1.03---1.26)
Grade 0.09 <0.001 0.67 <0.001
Primaryschool
5a 38.1 1.0 24.4 1.0 25.6 12.9 1.0
6a 39.5 0.99(0.89---1.12) 28.1 1.11(0.98---1.24) 32.2 13.3 0.98(0.82---1.18)
7a 44.0 1.11(0.99---1.24) 33.2 1.30(1.12---1.52) 41.9 14.9 1.03(0.84---1.27)
8a 41.9 0.99(0.88---1.11) 34.3 1.31(1.14---1.52) 48.4 20.6 1.38(1.11---1.72)
SecondarySchool
1a 38.7 0.91(0.80---1.03) 31.9 1.16(0.96---1.40) 52.0 22.3 1.50(1.18---1.92)
2a 39.3 0.93(0.81---1.08) 26.7 1.02(0.84---1.23) 50.7 28.4 1.84(1.43---2.37)
3a 41.1 0.94(0.77---1.13) 22.3 0.88(0.70---1.11) 49.8 30.8 1.89(1.36---2.64)
Age 0.07 0.001 <0.001 <0.001
≤12 38.5 1.0 26.3 1.0 28.6 1.0 12.2 1.0
13 39.7 0.99(0.90---1.11) 30.3 1.02(0.92---1.14) 38.7 1.33(1.19---1.49) 16.4 1.24(1.06---1.44)
14 45.1 1.17(1.07---1.27) 31.5 1.03(0.92---1.16) 44.8 1.51(1.36---1.67) 18.4 1.25(1.02---1.53)
15 38.9 1.05(0.93---1.18) 33.5 1.11(0.98---1.27) 45.8 1.55(1.39---1.74) 17.4 1.06(0.88---1.29)
≥16 40.3 1.10(0.99---1.23) 26.9 0.97(0.82---1.14) 47.0 1.54(1.40---1.69) 26.4 1.32(1.04---1.68)
AssetIndex(Quintiles) 0.36 <0.001 <0.001 0.53
1(lower) 41.6 14.9 1.0 16.1 1.0 16.5
2 41.4 26.0 1.75(1.48---2.08) 34.6 2.21(1.91---2.56) 16.1
3 38.4 30.7 2.04(1.76---2.38) 41.9 2.63(2.25---3.06) 18.7
4 41.1 34.5 2.31(1.98---2.70) 47.5 2.96(2.59---3.39) 17.8
5(higher) 39.6 39.0 2.53(2.19---2.94) 55.9 3.47(3.00---4.01) 18.9
Physicalactivity 0.02 0.35 0.003 0.39
<300min 42.7 1.0 26.1 41.0 1.0 18.5
P
revalence
and
associated
factors
of
sedentary
behavior
in
scholars
61
Table2 Adjustedanalysisbetweenexcessofsedentarybehavior(≥2h/day)andsociodemographicandbehavioralvariablesonweekends.Pelotas-RSBrazil,2013,n=8661.
Sedentarybehavior≥2honweekends
Television Electronicgames Internet Sitingdoingtasks
% PR(CI95%) p-value % PR(CI95%) p-value % PR(CI95%) p-value % PR(CI95%) p-value
Sex 0.007 <0.001 0.04 0.03
Male 48.7 1.0 55.4 1.0 54.3 1.0 10.0 1.0
Female 51.7 1.06(1.02---1.11) 33.9 0.63(0.59---0.66) 55.2 1.04(1.00---1.09) 10.8 1.16(1.02---1.32)
Grade 0.68 <0.001 0.83 0.04
Primaryschool
5a 49.2 42.4 1.0 43.4 10.9 1.0
6a 50.6 47.5 1.09(1.02---1.18) 51.0 9.2 0.85(0.65---1.11)
7a 51.5 46.8 1.09(1.00---1.19) 55.3 9.3 0.76(0.56---1.02)
8a 50.5 44.2 1.02(1.93---1.11) 61.3 9.9 0.77(0.56---1.06)
SecondarySchool
1a 50.1 44.4 0.97(0.86---1.09) 65.0 9.6 0.64(0.45---0.90)
2a 50.1 38.6 0.85(0.76---0.96) 65.2 13.8 0.81(0.56---1.16)
3a 59.4 33.3 0.74(0.65---0.84) 62.1 16.2 0.90(0.63---1.29)
Age 0.30 0.94 <0.001 <0.001
≤12 49.6 43.0 44.5 1.0 8.9 1.0
13 52.8 47.5 55.7 1.23(1.15---1.31) 8.9 1.11(0.87---1.40)
14 51.5 44.5 61.0 1.32(1.24---1.40) 9.9 1.29(1.03---1.63)
15 48.1 45.9 58.0 1.27(1.20---1.35) 10.3 1.40(1.05---1.85)
≥16 48.8 39.4 60.9 1.29(1.23---1.37) 14.5 1.96(1.52---2.54)
AssetIndex(Quintiles) 0.45 <0.001 <0.001 0.52
1(lower) 51.7 27.0 1.0 26.8 1.0 10.0
2 50.3 41.3 1.54(1.39---1.71) 48.9 1.84(1.69---2.01) 10.0
3 48.5 44.4 1.65(1.50---1.82) 59.1 2.20(1.98---2.46) 10.6
4 52.1 51.0 1.91(1.68---2.17) 64.9 2.40(2.18---2.65) 10.7
5(higher) 49.0 55.7 2.04(1.85---2.24) 62.1 2.70(2.42---3.02) 10.8
Physicalactivity 0.21 0.43 0.44 0.14
<300min 51.7 38.5 55.1 10.1 1.0
neighborhoodsafetymakeevenmorechildrenremain reclu-sivein theirhomes, factthatcan fostergreaterexposure toSB.21 Furthermore,theuseofmorethanoneelectronic device simultaneously is becoming common among young people,increasingSBinthispopulation.22,23
Girlswasmorelikelytoexceedthedailyrecommended amountofSBonbothweekdaysandweekendsinalmostall typesofSB,except‘‘playingelectronicgames’’.The asso-ciation between SBand sexis not yet a consensusin the literature.6,24 The study by Atkin and colleagues,25 which usedaccelerometrytomeasureSB,demonstratedthatthe frequentoutdoor activitiesrestrictionimposed byparents wasassociatedwithanincreaseintheirdaughters’ seden-tarytimeafteroneyearoffollow-up.
Agewaspositivelyassociatedwithusingtheinternetin oursample. A study that evaluatedthe compulsiveyouth useofinternetdemonstratedadirectrelationshipwithage aswell.26 The differentways touse the internet andthe interactivitywithdailylifemakeitaversatileandculturally acceptedpractice,withastrongtendencytointensifyeven moreinthenearfuture.27
Specifically regarding associations between grade and types of SB, there was an inverse relationship between spendingtimeonelectronicgamesandbeinginvolvedin sit-tingtasksoninverseschoolshiftonweekdays.Theincreased responsibilitiesovertheyearscanbeamajorfactorinthis relationship.Thesearchforgoodperformancesinselection processesandahighersearchforimprovementtoconquera placeonthelabormarketarecommonamongteenagers,28 which mayexplain the reductionin available time for SB whenthereareactivitiesincounter-turn.
Asfortherelationshipbetweeneconomic levelandSB, there wasa direct relationship among them on weekday and weekends for all the screen related behaviors. Our associations between socioeconomic status and SB were consistentwithpreviousstudies.Theincreasedfamily pur-chasing power is an important facilitator of children and adolescentsSB.5,19,29
A recent meta-analysis conducted by Pearson and coworkers30summarizedtheresultsof163studiespublished since August 2013 about the association between SB and physicalactivity.Thereviewshowedaninverse,butofweak magnitude,association.Herewefoundinverseassociations forTVviewingandinternetusing,around7%.
The present study has some limitations that shouldbe noted. Firstly, exposures and outcomes were based on self-report. The cross-sectional nature of the datamakes it impossible to study the temporality of the associa-tionsbetween SBand physicalactivity.The relatively low responserate,particularlyfor secondaryschool,may also affectourresults.
In conclusion,the prevalence of SBin this sample was high, especially on weekends. SB seems more evident in those from higher socioeconomic status and girls, with theexception ofelectronicgames.Inaddition,individuals belongingtohighergradesandagesseemtobemorelikely toinvolveinsedentarytasksintheinverseschoolshift,and touseinternet.FutureSBstudiesshouldtaketheseresults into account due to the influence of associated factors asage, sex, grade and physical activity on interventions’ strategies. In addition, it is necessary that health and education professionals understand the importance of
alertingyoung peopleandtheircaregivers about therisks ofanoverlysedentaryroutine.
Funding
Wellcome Trust (Pedro Curi Hallal, Inglaterra) e Con-selhoNacionaldeDesenvolvimentoCientíficoeTecnológico (CNPq),Brasil(processon◦474306/2012-7).
Conflicts
of
interest
Theauthorsdeclarenoconflictsofinterest.
References
1.Barr-AndersonDJ,SissonSB.Mediauseandsedentarybehavior inadolescents: whatdo we know,what hasbeendone,and wheredowego?AdolescMedStateArtRev.2012;23:511---28. 2.SedentaryBehaviourResearchNetwork.Lettertotheeditor:
standardizeduse ofthe terms‘‘sedentary’’ and ‘‘sedentary behaviours’’.ApplPhysiolNutrMetab.2012;37:540---2. 3.AlbergaAS,Sigal RJ,Goldfield G, Prud’hommeD,KennyGP.
Overweightandobeseteenagers:whyisadolescenceacritical period?PediatrObes.2012;7:261---73.
4.TremblayMS,LeBlancAG,KhoME,SaundersTJ,LaroucheR, ColleyRC,etal.Systematicreviewofsedentarybehaviourand healthindicatorsinschool-agedchildrenandyouth.IntJBehav NutrPhysAct.2011;8:98.
5.RezendeLF,RodriguesLopesM,Rey-LópezJP,MatsudoVK,Luiz OC.Sedentarybehaviorandhealthoutcomes:anoverviewof systematicreviews.PLOSONE.2014;9:e105620.
6.PateRR,MitchellJA,ByunW,DowdaM.Sedentarybehaviourin youth.BrJSportsMed.2011;45:906---13.
7.KatzmarzykPT,LeeIM.Sedentarybehaviourandlifeexpectancy in the USA: a cause-deleted life table analysis. BMJ Open. 2012;2:e000828.
8.AmericanAcademyofPediatrics;Council onCommunications andMedia.Children,adolescents,obesityandthemedia. Pedri-atrics.2011;128:201---8.
9.BarbosaFilhoVC,CamposW,LopesAS.Epidemiologyof physi-calinactivity,sedentarybehaviors,andunhealthyeatinghabits amongBrazilianadolescents:asystematicreview.CienSaude Colet.2014;19:173---93.
10.SpohrCF,FortesMO,RombaldiAJ,HallalPC,AzevedoMR. Ativi-dadefísicaesaúdenaeducac¸ãofísicaescolar:efetividadede umanodoprojeto‘‘Educac¸ãoFísica+’’.RevBrasAtivFisSaude. 2014;19:300---13.
11.Rey-López JP, Ruiz JR, Ortega FB, Verloigne M, Vicente-Rodriguez G, Gracia-Marco L, et al. Reliability and validity of a screen time-based sedentary behaviour questionnaire for adolescents: the HELENA study. Eur J Public Health. 2012;22(3):373---7.
12.FariasJúniorJC,LopesAS,MotaJ,SantosMP,RibeiroJC, Hal-lalPC.Validade ereprodutibilidade deumquestionário para medida de atividade física em adolescentes. Rev Bras Epi-demiol.2012;15:198---210.
13.WorldHealthOrganization.Globalrecommendationson physi-calactivityforhealth.Geneve:WHO;2010.
14.Rey-López JP, Vicente-Rodríguez G, Ortega FB, Ruiz JR, Martinez-GómezD,DeHenauwS,etal.Sedentarypatternsand mediaavailabilityinEuropeanadolescents:theHELENAstudy. PrevMed.2010;51:50---5.
Prevalenceandassociatedfactorsofsedentarybehaviorinscholars 63
balance-relatedbehavioursinpreschoolchildren:asystematic review.ObesRev.2012;13:13---28.
16.Ramirez-RicoE,HIllandTA,FoweatherL,Férnandez-GarciaE, FaircloughSJ.Weekdayandweekendpatternsofphysical activ-ityandsedentarytimeamongLiverpoolandMadridyouth.Eur JSportSci.2013;14:278---93.
17.CameloLV,RodriguesJF,GiattiL,BarretoSM.Lazersedentárioe consumodealimentosentreadolescentesbrasileiros:Pesquisa NacionaldeSaúdedoEscolar(PeNSE),2009.CadSaudePublica. 2012;28:2155---62.
18.WellsJC,HallalPC,ReichertFF,MenezesAM,AraújoCL,Victora CG.Sleeppatternsandtelevisionviewinginrelationtoobesity andbloodpressure:evidencefromanadolescentBrazilianbirth cohort.IntJObes(Lond).2008;32:1042---9.
19.Dumith SC, Hallal PC, Menezes AM, Araújo CL. Seden-tary behavior in adolescents: the 11-year follow-up of the 1993Pelotas (Brazil) birth cohortstudy. Cad SaudePublica. 2010;26:1928---36.
20.FariasJúniorJC,LopesAS,MotaJ,HallalPC.Práticade ativi-dadefísicaefatoresassociadosemadolescentesnoNordeste doBrasil.RevSaudePublica.2012;46:505---15.
21.CilleroIH,JagoR.Systematicreviewofcorrelatesof screen-viewingamongyoungchildren.PrevMed.2010;51:3---10. 22.JagoR,SebireSJ,GorelyT,CilleroIH,BiddleSJ.‘‘I’monit24/7
at themoment’’: a qualitative examination of multi-screen viewingbehavioursamongUK10-11yearolds.IntJBehavNutr PhysAct.2011;8:85.
23.FerrarK,ChangC,LiM,OldsTS.Adolescenttimeuseclusters: asystematicreview.JAdolescHealth.2013;52:259---70.
24.Uijtdewilligen L, Nauta J, Singh AS, Van MechelenW, Twisk JW, van der Horst K. Determinants of physical activity and sedentary behaviour in young people: a review and quality synthesis of prospective studies. Br J Sports Med. 2011;45: 896---905.
25.AtkinAJ,CorderK,EkelundU,WijndaeleK,GriffinSJ,vanSluijs EM.Determinantsofchangeinchildren’ssedentarytime.PLOS ONE.2013;8:e67627.
26.VanRojiAJ,SchoenmakersTM,vandeEijndenRJ,vandeMheen D.CompulsiveInternetuse:theroleofonlinegamingandother Internetapplications.JAdolescHealth.2010;47:51---7. 27.Jungblut AL. A heterogenia do mundo on-line: algumas
reflexõessobrevirtualizac¸ão,comunicac¸ãomediadapor com-putador e ciberespac¸o. Horizontes Antropológicos. 2004;10: 97---121.
28.Lemos AE, Pinto MC. Empregabilidade dos administradores: quaisosperfisprofissionaisdemandadospelasempresas? Cader-nosEbapeBr.2008;6:1---15.
29.Verloigne M, Van Lippelvelde W, Maes L, Brug J, De Bour-deaudhuij I. Family- and school-based correlates of energy balance-relatedbehavioursin10---12-year-oldchildren:a sys-tematicreviewwithintheENERGY(EuropeaNEnergybalance Research to prevent excessive weight Gain among Youth) project.PublicHealthNutr.2012;15:1380---95.