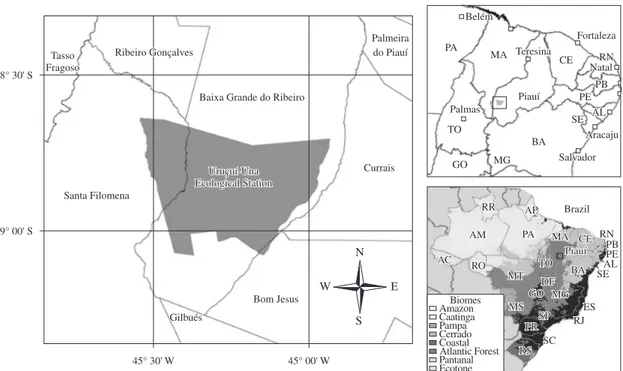
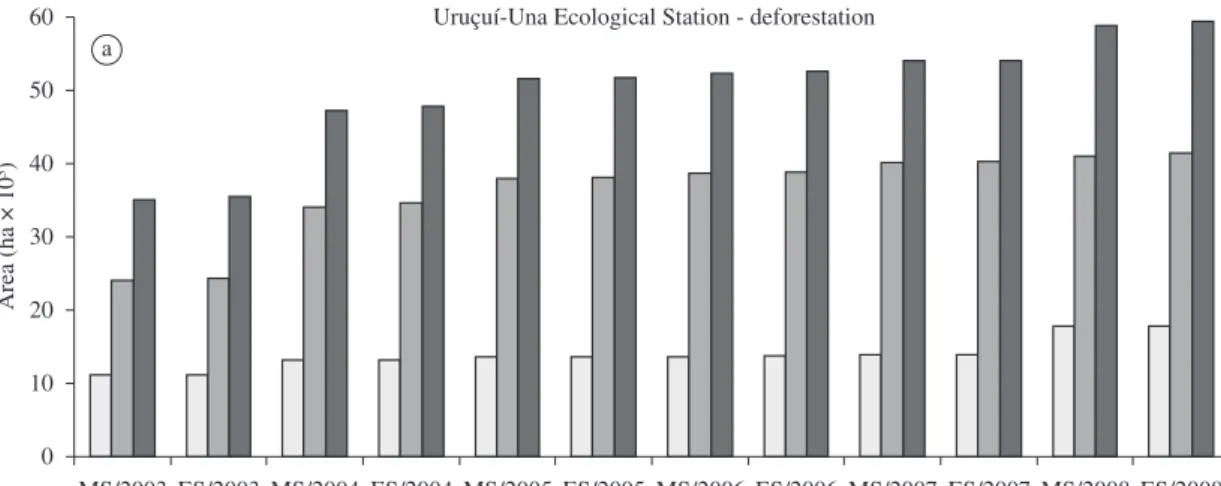
Anthropization on the Cerrado biome in the Brazilian Uruçuí-Una Ecological Station estimated from orbital images
Texto
Imagem
Documentos relacionados
Quando ligar um televisor Sony, a entrada pode ser seleccionada automaticamente carregando no botão de entrada após a configuração (Entrada SYNC) - avance para o passo 5.. 4
The limestone caves in South Korea include a variety of speleothems such as soda straw, stalactite, stalagmite, column, curtain (and bacon sheet), cave coral,
Neste trabalho o objetivo central foi a ampliação e adequação do procedimento e programa computacional baseado no programa comercial MSC.PATRAN, para a geração automática de modelos
Ousasse apontar algumas hipóteses para a solução desse problema público a partir do exposto dos autores usados como base para fundamentação teórica, da análise dos dados
Dentre os principais problemas decorrentes do corte manual da cana-de-açúcar citados, o mais frequente é a dor no corpo em decorrência do trabalho árduo, trabalho sob
Com base no exposto, o objetivo deste artigo é traçar o perfil dos ocupados no mercado de trabalho paranaense por formas de inserção, faixa etária, níveis de
i) A condutividade da matriz vítrea diminui com o aumento do tempo de tratamento térmico (Fig.. 241 pequena quantidade de cristais existentes na amostra já provoca um efeito
Muitas vezes as máquinas disponíveis no mercado podem não atender as expectativas dos produtores de orgânicos, já que são projetadas para grandes lavouras e produção em larga
