SEWAGE SLUDGE APPLICATION ON CULTIVATED
SOILS: EFFECTS ON RUNOFF AND TRACE METAL LOAD
Marcelo Valadares Galdos1; Isabella Clerici De Maria2*; Otávio Antonio de Camargo2; Sonia Carmela Falci Dechen2
1
USP/CENA, Av. Centenário, 303 - 13400-970 - Piracicaba, SP - Brasil.
2
IAC - Centro de Solos e Recursos Ambientais, C.P. 28 - 13020-902 - Campinas, SP - Brasil. *Corresponding author <[email protected]>
ABSTRACT:The use of sewage sludge in agricultural soils as a macro and micronutrient source and as a soil conditioner has been one of the alternatives for its disposal. However, sewage sludge contains trace metals, which are potential sources of pollution. The goal of this study was to evaluate the effect of sewage sludge application on surface water contamination through runoff when it was applied in a soil cultivated with corn. The effect of sludge application on the concentration and load of copper, nickel and zinc and the volume of runoff water and sediment were evaluated. The experiment was set up in plots used to study erosion losses in Campinas, Sao Paulo State, Brazil. The soil is a clayey Rhodic Hapludox. Three treatments were studied: no sewage sludge, sewage sludge to supply the N required by the crop and twice that amount, with four replications. The water and sediment lost by runoff were measured after each rainfall, and sampled for chemical analysis. The volumes of water and sediment lost by runoff decreased after sewage sludge application. The waste application increased trace metal concentration in the runoff water and sediment, especially zinc, which was present in high concentration in the sewage sludge used. Nevertheless, the load of trace metals transported from the plot was mostly dependent on the total runoff volume. Most of the Cu, Zn and Ni losses were via sediment, and occurred in a few highly erosive rainfall events in the period studied.
Key words: Cu, Ni, Zn, erosion, sediment
APLICAÇÃO DE LODO DE ESGOTO EM SOLOS AGRÍCOLAS:
EFEITOS NA ENXURRADA E NO CARREAMENTO DE METAIS
RESUMO: O uso de lodo de esgoto em solos agrícolas como fonte de macro e micronutrientes e como condicionador de solos tem sido uma das alternativas para sua disposição final. O lodo de esgoto, entretanto, contém metais que são potencialmente fonte de poluição. Estudou-se o efeito da aplicação de lodo de esgoto na contaminação de águas superficiais por meio da enxurrada proveniente de solo agrícola cultivado com milho. O efeito da aplicação do lodo na concentração e no carreamento de cobre, níquel e zinco e no volume de enxurrada e sedimentos foi avaliado. Os tratamentos foram aplicados em parcelas utilizadas para estudos de perdas por erosão em Campinas, São Paulo, Brasil. O solo era um Latossolo Vermelho férrico argiloso. Os três tratamentos foram: sem lodo, com lodo para suprir o N requerido pela cultura e duas vezes essa quantidade, com quatro repetições. A água e o sedimento perdidos pela enxurrada eram medidos na manhã seguinte de cada chuva e amostrados para análise química. Os volumes de água e de sedimentos perdidos por enxurrada diminuíram com a aplicação do lodo. A aplicação do resíduo aumentou a concentração de metais na água e no sedimento, especialmente do zinco que estava presente em alta concentração do lodo de esgoto utilizado. Entretanto, a carga de metais transportados das parcelas foi dependente principalmente do volume total de enxurrada. A maior parte das perdas de Cu, Ni e Zn foi via sedimento e ocorreu em alguns poucos eventos de alta erosividade no período de estudo.
Palavras-chave: Cu, Ni, Zn, erosão, sedimento
INTRODUCTION
Application of sewage sludge in agricultural soils as an organic conditioner and fertilizer has grown in Brazil, driven by a significant increase in the vol-ume of sewage treated in the country. Sewage sludge can behave as a soil conditioner due to the role of
al., 1995; Kelling et al., 1977; Kladivko & Nelson, 1979; Mostaghimi et al., 1989; Bossche et al., 2000). However, sewage sludge has a variable content of trace metals (Berton, 2000) which could accumulate in the soil and be transported by runoff water and sediment, contaminating surface waters (Evangelou, 1998).
Water erosion is one of the main causes of the pollution of water bodies and one of the main reasons of soil degradation in Brazil, where erosion losses in agricultural soils were estimated to be close to 20 t ha–1 year–1 (Bertoni & Lombardi Neto, 1990). Trace metals are transported into runoff both diluted in the water and/or adsorbed to the clay and organic matter colloidal particles (Quinton, 2001). Therefore, although sewage sludge application might reduce erosion, con-tamination by trace metals can occur on deposition ar-eas.
The objectives of this study were to determine: i) the effect on the water and sediment losses by sur-face runoff of two consecutive sewage sludge appli-cations on a clayey Haplortox soil cultivated with corn, as a function of the intensity and distribution of rain-fall, and ii) the load of trace metals in these water and sediment in order to evaluate the potential diffuse pol-lution as a result of the sewage sludge application.
MATERIAL AND METHODS
The experiment was carried out in Campinas, São Paulo State, southeast Brazil (22º9’ S, 47º1’W), in the 2001/2002 and 2002/2003 agricultural seasons. Permanent sloped plots with runoff catchment paved boxes were used. The plots have 100 m2
(4 × 25 m) area, with a uniform slope of 10%, and have cemented borders. The soil is a Typic Haplortox, clayey (0.65 g g–1 of clay) in texture and has an erodibility index of 0.0122 t ha h MJ–1
ha–1 mm–1
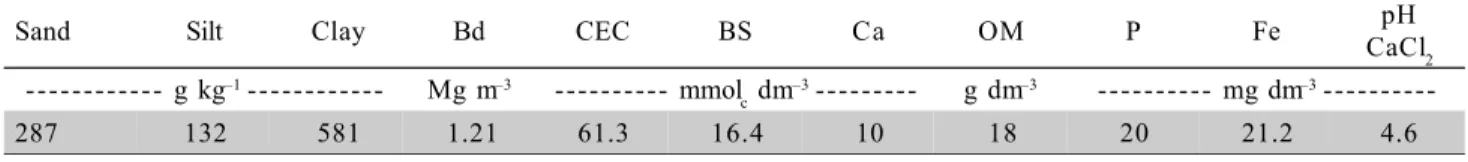
(Lombardi Neto & Bertoni, 1975). Some of the physical and chemical properties of the soil is presented on Table 1.
The climate in the region is a Cwa type ac-cording to the Köppen classification (Critchfield, 1960), defined as humid tropical with a rainy summer and dry winter. The mean annual temperature is 20.5°C and the mean annual rainfall is 1,400 mm, with 76% of the precipitation between October and March (data collected in the weather station adjacent to the
experi-mental plots). The mean annual erosivity is 6,738 MJ mm ha–1
h–1 year–1
(Lombardi Neto & Moldenhauer, 1992).
The runoff catchment systems installed at the end of the plots are composed of rotating metal trays subdivided into two one-litter compartments. These trays are connected to a counting device, which makes it possible to monitor the quantity of water lost by sur-face runoff. After filling the tray, the runoff water falls into an impermeable concrete box, where water and sediment can be quantified and collected for chemical analysis.
Every morning following a sediment-produc-ing rainfall event the volume of water and sediment in the collecting boxes were measured. Water samples were also taken from a pluviometer located at the study area, as a blank sample. Two subsamples were taken from each water sample. A 50 mL subsample was used for pH determination. The second subsample, 100 mL, was left to settle for 24 h with 2 mL of HNO3 at 65% (m/v). After the settling period, the sample was filtered through blue stripe slow filtration paper -Whatman 42 filter - and refrigerated for the chemical analyses. The Cu, Ni and Zn determination in the run-off water were performed in an argon emission spec-trometer (ICP-OES), in the following spectral lines: Cu = 324.754, Ni = 231.604 and Zn = 213.856 nm. T h e whole volume of sediment contained in the boxes was collected, air dried, sieved in a 2 mm sized sieve and stored for chemical analysis of both available (Raij et al., 2001) and total EPA (Abreu et al., 2001) metal con-tent.
The experiment was designed with three treat-ments, L0, L1 and L2, equivalent to sewage sludge application rates of 0, 10.8 and 21.6 Mg of dry mat-ter per hectare, corresponding to 0, 1 and 2 times the N requirement of corn with four replications. The 10.8 Mg ha–1 rate was determined based on the chemical analysis of the sewage sludge and the nitrogen rec-ommendation for corn (CETESB, 1999). The sewage sludge was manually incorporated to a 0.10 m depth, in December 2001 and November 2002. An NPK fer-tilizer was applied at planting date in the control treat-ment, without sludge application; and potassium in the form of potassium chloride was applied in the plots receiving sewage sludge.
Table 1 - Physical and chemical soil properties of Typic Haplortox before experiment, on surface layer.
Bd = bulk density; CEC = cation exchange capacity, Ca = calcium; BS = base saturation; OM = organic matter; P = phosphorus; Fe = iron
Sand Silt Clay Bd CEC BS Ca OM P Fe pH
CaCl2 --- g kg–1 --- Mg m–3 --- mmol
c dm
–3 --- g dm–3 --- mg dm–3
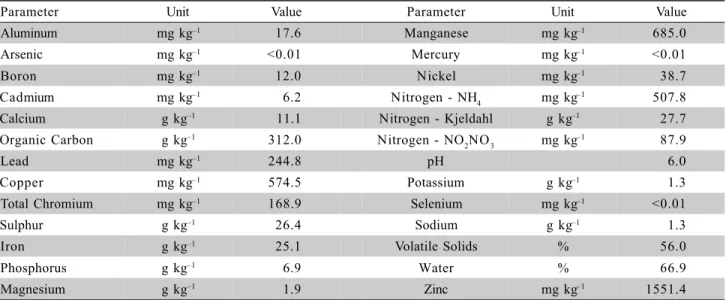
The sewage sludge used was provided by the Sewage Treatment Plant of Jundiai, Sao Paulo State, Brazil. The main chemical parameters of the sewage sludge are presented in Table 2. The elements, with exception for carbon and nitrogen, were extracted by the EPA 3051 method (Abreu et al., 2001) and deter-mined by ICP-OES. The organic carbon was extracted by the digestion block method, and determined by ti-tration. The volatile solids determination was done by weighting a 2.5 g sample dried at 60ºC, incinerating it in a 500ºC muffle for 4 h and weighting it again. The total N (Kjeldahl method), NH
4 +
and NO 3
–
determina-tion was performed by the Cantarella & Trivelin (2001) method. The sample in the original conditions was used to determine the nitrogen concentration in the ammo-nium and nitric forms.
The corn crop was planted in contour lines, with 0.90 m spacing, and five plants per meter, on December 2001 and November 2002. The control plots, with no sewage sludge application (L0), were fertilized at planting with a NPK formula, containing 4.8 kg ha–1
N, 21 kg ha–1
P and 14.5 kg ha–1
K. Due to the low concentration of potassium in the sewage sludge, potassium chloride was applied in the plots re-ceiving the residue (L1 and L2), at the same rate as the control plot, 14.5 kg ha–1 K. Nitrogen fertilizer dressing applications were applied in January 2002, as 165 kg ha–1 urea in the L0 treatment, and as 180 kg ha– 1
urea in all three treatments in January 2003. The crop was harvested in May 2002 and April 2003.
Correlations between runoff and rainfall vol-umes and between runoff and erosivity index were tested. The erosivity index used was the EI30 index, as defined by Wischmeier & Smith (1978), calculated by total storm kinetic energy (E) times maximum 30-minutes intensity (I
30). Results were submitted to
analysis of variance with F test application (p < 0.05), using the GLM procedure of the SAS program (SAS INSTITUTE, 1997). The treatment means were com-pared by applying the “t” test at 0.05 significance.
RESULTS AND DISCUSSION
Runoff volume
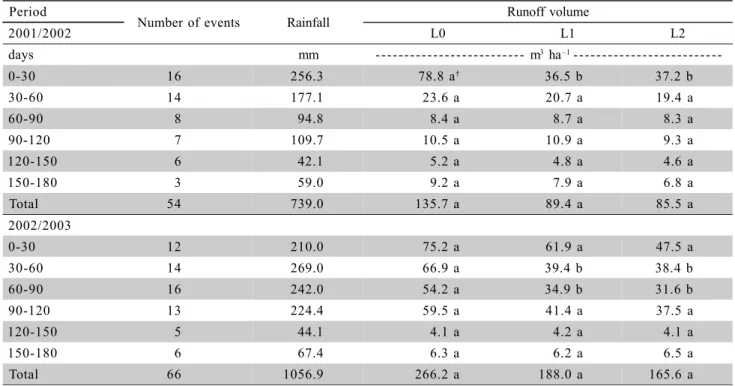
During the two-year period 120 rainfall events were evaluated, 54 in 2001/2002 and 66 in 2002/2003. Water runoff losses in the first 180 days after the sewage sludge application are presented in Table 3, divided in 30-day periods. There was a re-duction of 31 and 38% in runoff water in the L1 and L2 treatments, respectively, compared to the plots without sludge application. These results are very close to those of 38 and 32% reduction in runoff water observed by Mostaghimi et al. (1989) with a rain simulator, comparing two rates of sludge to a control plot without sludge. In both years of this study, over 50% of the runoff water losses happened in the first two months after the sewage sludge ap-plication. Under this climate and agricultural system, this initial period is critical regarding to runoff losses, due to the high rainfall intensity and the low soil cover by the crop.
The runoff water was proportional to the rain-fall volume, following a second degree polynomial model (Figure 1a). The values dispersion was more pronounced for the control than for L1 and L2 treat-ments. The slope of the curve diminished when sew-age sludge rate increased. Similar results were founded in an experiment with sewage sludge application us-ing runoff plots, with a steeper curve in the control plot and little difference between the rates of sewage sludge applied (Joshua et al., 1998).
Table 2 - Average concentration of the elements, pH and water content in the sewage sludge applied in 2001 and 2002.
Parameter Unit Value Parameter Unit Value
Aluminum mg kg–1 17.6 Manganese mg kg–1 685.0
Arsenic mg kg–1 <0.01 Mercury mg kg–1 <0.01
Boron mg kg–1 12.0 Nickel mg kg–1 38.7
Cadmium mg kg–1 6.2 Nitrogen - NH
4 mg kg
–1 507.8
Calcium g kg–1 11.1 Nitrogen - Kjeldahl g kg–1 27.7
Organic Carbon g kg–1 312.0 Nitrogen - NO
2NO3 mg kg
–1 87.9
Lead mg kg–1 244.8 pH 6.0
Copper mg kg–1 574.5 Potassium g kg–1 1.3
Total Chromium mg kg–1 168.9 Selenium mg kg–1 <0.01
Sulphur g kg–1 26.4 Sodium g kg–1 1.3
Iron g kg–1 25.1 Volatile Solids % 56.0
Phosphorus g kg–1 6.9 Water % 66.9
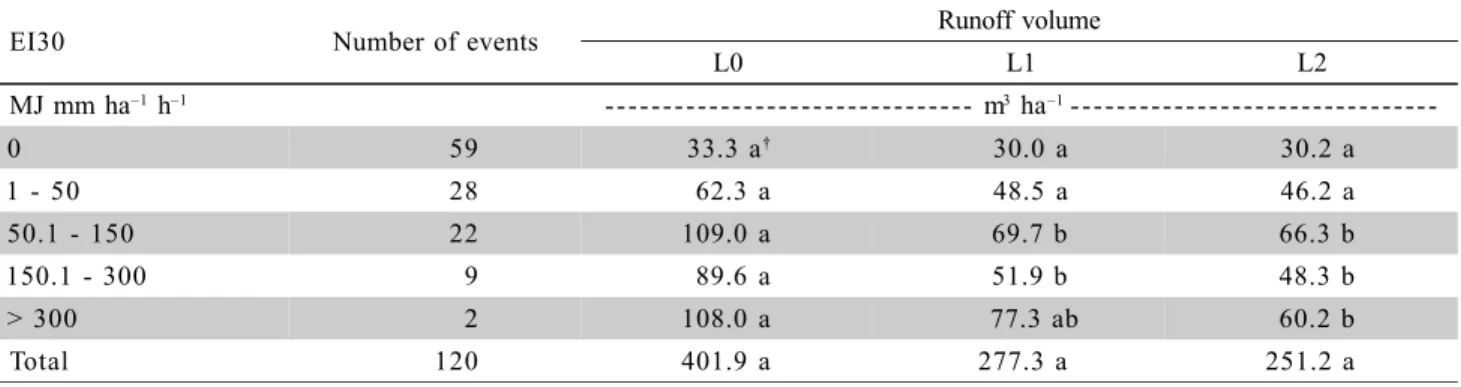
There was a significant correlation between run-off volume and the EI30 erosivity index (Figure 1b), al-though this index has been developed as a soil loss re-lated parameter (Wischmeier & Smith, 1978). Based on the relationship between the runoff volume and the EI30 index, the runoff volume as a function of the rainfall erosivity categories was evaluated (Table 4). The two highest EI30 categories had only 11 rainfall events, close to 10% of the total, but represented 50%, 48% and 44% of the total volume lost as runoff in the L0, L1 and L2 rates, respectively. Most of the rainfall events had low erosivity values, and there was no difference in the run-off volume among treatments for these events.
Two extreme events stand out, with erosivity above 300 MJ mm ha–1 h–1, and were responsible for
approximately 25% of the total runoff volume. These events happened on November 29, 2000 (total rainfall of 76.7 mm with a return period of two years and a maximum 30 minute intensity of 114.4 mm h–1
with a return period of thirty years) and on February 18, 2003 (127.0 mm with a return period of twenty years and 81.5 mm h–1
with a return period of three years). The rainfall events on 11/29/2002 and 02/18/ 2003 can be considered as extreme due to the 30 min-utes maximum intensity and the total volume of rain-fall, respectively. Since the experiment was carried out under natural rainfall, it was possible to evaluate the im-pact of these extreme events on the water and sediment loss from the runoff plots. The 29/11/2002 rainfall event had a very high intensity, with a different behaviour than Table 3 - Rainfall and runoff volume for 30-day periods following the annual sludge application at the rates of 0 (L0), 10.2 (L1)
and 20.5 (L2) Mg ha–1 in 2001/2002 and 2002/2003.
†Mean values followed by the same letter are not different (p < 0.05).
Period
Number of events Rainfall Runoff volume
2001/2002 L0 L1 L2
days mm - - - m3 ha–1
-0-30 16 256.3 78.8 a† 36.5 b 37.2 b
30-60 14 177.1 23.6 a 20.7 a 19.4 a
60-90 8 94.8 8.4 a 8.7 a 8.3 a
90-120 7 109.7 10.5 a 10.9 a 9.3 a
120-150 6 42.1 5.2 a 4.8 a 4.6 a
150-180 3 59.0 9.2 a 7.9 a 6.8 a
Total 54 739.0 135.7 a 89.4 a 85.5 a
2002/2003
0-30 12 210.0 75.2 a 61.9 a 47.5 a
30-60 14 269.0 66.9 a 39.4 b 38.4 b
60-90 16 242.0 54.2 a 34.9 b 31.6 b
90-120 13 224.4 59.5 a 41.4 a 37.5 a
120-150 5 44.1 4.1 a 4.2 a 4.1 a
150-180 6 67.4 6.3 a 6.2 a 6.5 a
Total 66 1056.9 266.2 a 188.0 a 165.6 a
Figure 1 - Runoff water as a function of (a) rainfall volume, (b) EI30 index, in the sewage sludge application rates of 0 (L0), 10.2 (L1) and 20.5 (L2) Mg ha–1. (All equations in ANOVA Ftest resulted significant (p < 0.01).
0.0 1.0 2.0 3.0 4.0 5.0 6.0 7.0
0 20 40 60 80 100 120 140
Runoff, mm
Rainfall, mm
0
L
2L
a
y = 0.000066x2 + 0.0394x – 0.3828 r2 = 0.719
y = 0.000058x2 + 0.0251x – 0.2306 r2 = 0.744
y = 0.000063x2 + 0.0188x – 0.1311 r2 = 0.7194
0.0 1.0 2.0 3.0 4.0 5.0 6.0
0 500 1000 1500 2000 2500
Runoff, mm
EI30, MJ mm ha–1h–1 0
L
2L
b
y = –0.000001x2 + 0.0049x – 0.0590 r2 = 0.850
y = –0.0000005x2 + 0.0025x – 0.0839 r2 = 0.943 y = –0.000001x2 + 0.0033x – 0.0406
Table 4 - Runoff water volume in 120 rainfall events in 2001/2002 and 2002/2003, classified according to rainfall erosivity (EI30), in the sewage sludge application rates of 0 (L0), 10.2 (L1) and 20.5 (L2) Mg ha–1.
†Mean values followed by the same letter are not different (p < 0.05).
EI30 Number of events Runoff volume
L0 L1 L2
MJ mm ha–1 h–1 - - - m3 ha–1
-0 59 33.3 a† 30.0 a 30.2 a
1 - 50 28 62.3 a 48.5 a 46.2 a
50.1 - 150 22 109.0 a 69.7 b 66.3 b
150.1 - 300 9 89.6 a 51.9 b 48.3 b
> 300 2 108.0 a 77.3 ab 60.2 b
Total 120 401.9 a 277.3 a 251.2 a
the other events, which explains the large dispersion of points on Figure 1a, and the better correlation between runoff volume and the EI30 index.
Sediment volume
Most of sediment losses generally occur in two or three rainfall events (Edwards & Owens, 1991). In this study, only two rainfall events represent most of the sediment losses (90%) in the period studied. The sewage sludge application resulted in a reduction of the sediment loss by runoff in the years studied of 30% and 50% in the L1 and L2 rates (Table 5), respectively. These values are close to those reported by Mostaghimi et al. (1989) in a study with sewage sludge application, where there was a 51.5% reduction in the sediment losses in comparison to the control plots, with no sewage application. The reduction of erosion with sewage sludge application is a function of the changes in the physical properties of the soil, with an increased water infiltration (Jorge et al., 1991), but also by the increase in crop growth, with more soil cover and con-sequent a rain drop protection.
Table 5 - Runoff sediment losses, average of four replications, in the sewage sludge application rates of 0 (L0), 10.2 (L1) and 20.5 (L2) Mg ha–1, in the seven rainfall events which produced sediment losses.
† Mean values followed by the same letter are not different (p < 0.05).
Date Rainfall Erosivity
EI30
Sediment weight
L0 L1 L2
mm --- t ha–1
-12/24/2001 40.6 38 1.09 0.08 0.29
1/25/2002 14.2 0 0.09 0 0
11/29/2002 77.0 1700 6.52 6.93 4.16
1/11/2003 34.1 211 0.30 0 0
1/12/2003 28.6 115 0.87 0 0
1/13/2003 27.0 101 0.26 0 0
2/18/2003 130.8 2137 3.34 a† 1.80 ab 0.88 b
Total (2001/2002 and 2002/2003) 12.48 8.82 5.77
There was no difference (p < 0.05) between the treatments. This was probably due to the high vari-ability in the measured values, with high minimum dif-ferences. Erosion is not a uniform process, and a large number of replications would be necessary for a bet-ter representation of the population studied.
statis-tical tests, Bossche et al. (2000) observed a decrease in the volume of sediment loss, of 1,200 kg ha–1
to 500 kg ha–1, as a function of sewage sludge applica-tion.
Except for the two mentioned extreme events, the sediment losses were very low in the plots with sewage sludge application, indicating that the erosion risk with sludge application would be minimized if soil conservation practices will be applied. Nevertheless, it is important to point out the risk associated with the high sediment losses caused by extreme events in ar-eas where a waste with contaminant capacity has been utilized. Therefore, it is essential to minimize the po-tential for runoff losses when planning sewage sludge application. The trends in the volume of runoff water and sediment from rainfall in the two-year period stud-ied lead to the conclusion that the sewage sludge ap-plication resulted in a reduction of the runoff erosion losses, as reported by Aguilar & Loftin (1991) and Joshua et al. (1998).
Trace metal load in the water and sediment
The trace metal concentration in the runoff water was analyzed for 72 of the 120 rainfall events in the period (Table 6). The average Cu and Ni con-centration in runoff water varied little among treat-ments. Zn concentration in the water was affected by
the sludge application rates, with higher concentrations in the areas that received the highest rate. This con-centration increase reflects the increase in the soil sur-face layer Zn amount as described in this same ex-periment by Galdos et al. (2004). The limits for ac-ceptable concentrations of trace metals in the current environmental legislation in Brazil are very restrictive. The Ni and Zn concentration in the runoff water in all three treatments exceeded the limit values of 0.025 and 0.001 mg L–1, respectively. The runoff concentration of Cu was lower than the limit established in the leg-islation, 0.500 mg L–1 (CETESB, 1999).
The exchangeable content of Cu, Ni and Zn in the sediment was higher where the highest rate of sewage sludge was applied (Table 6). In spite of this fact, only the Zn concentration increased. These re-sults were compared to the limits proposed by Long et al. (1995), used by the US National Sediment Insti-tute, in the risk assessment of contamination of water bodies by runoff sediment. According to these stan-dards, zinc concentrations higher than 150 mg kg–1 would indicate a moderate risk for the aquatic biota. Although the concentrations observed in this study were lower than this limit, the cumulative effects of annual sewage sludge application could lead to envi-ronmental damage in the water bodies receiving this kind of runoff water and sediment.
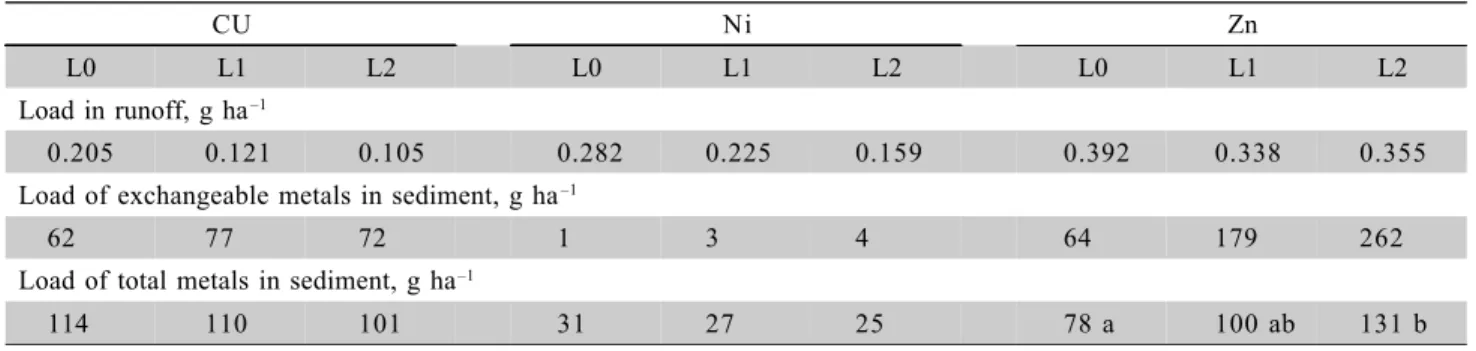
Table 7 - Load of copper (Cu), nickel (Ni) and zinc (Zn) in the runoff water and in the sediment as exchangeable load and total load in the sewage sludge application rates of 0 (L0), 10.2 (L1) and 20.5 (L2) Mg ha–1, for the two-year period.
CU Ni Zn
L0 L1 L2 L0 L1 L2 L0 L1 L2
Load in runoff, g ha–1
0.205 0.121 0.105 0.282 0.225 0.159 0.392 0.338 0.355 Load of exchangeable metals in sediment, g ha–1
62 77 72 1 3 4 64 179 262
Load of total metals in sediment, g ha–1
114 110 101 31 27 25 78 a 100 ab 131 b
Table 6 - Average values for water runoff concentration of copper (Cu), nickel (Ni) and zinc (Zn), exchangeable content and total content in sediment subsequent to application rates of 0 (L0), 10.2 (L1) and 20.5 (L2) Mg ha–1 of sewage sludge in two years.
†Mean values followed by the same letter are not different (p < 0.05).
CU Ni Zn
L0 L1 L2 L0 L1 L2 L0 L1 L2
Concentration in runoff, mg L–1
0.033 0.031 0.032 0.058 0.064 0.061 0.064 a 0.085 ab 0.091 b
Exchangeable content in sediment, mg dm–3
6.3 11.2 15.9 0.1 a† 0.4 ab 0.9 b 6.6 a 25.8 ab 57.8 b
Total content in sediment, mg kg–1
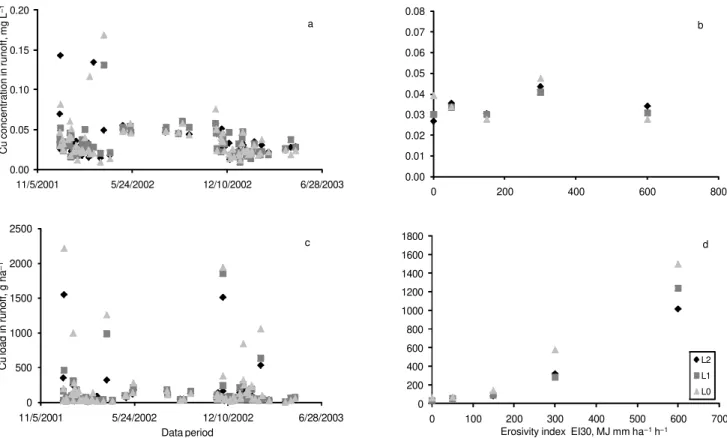
Figure 2 - Copper concentration and load in the runoff water as a function of (a and c) time and (b and d) EI30 classes, respectively, in the sewage sludge application rates of 0 (L0), 10.2 (L1) and 20.5 (L2) Mg ha–1 application rates of 0 (L0), 10.2 (L1) and 20.5
(L2) Mg ha–1.
0.00 0.05 0.10 0.15 0.20
11/5/2001 5/24/2002 12/10/2002 6/28/2003
Cu concentration in runoff, mg L
–
1
a
0.00 0.01 0.02 0.03 0.04 0.05 0.06 0.07 0.08
0 200 400 600 800
b
0 500 1000 1500 2000 2500
11/5/2001 5/24/2002 12/10/2002 6/28/2003
Cu load
in runoff, g ha
–
1
Data period
c
0 200 400 600 800 1000 1200 1400 1600 1800
0 100 200 300 400 500 600 700 Erosivity index EI30, MJ mm ha–1h–1
L2
L1
L0
d
Figure 3 - Nickel concentration and load in the runoff water as a function of (a and c) time and (b and d) EI30 classes, respectively, in the sewage sludge application rates of 0 (L0), 10.2 (L1) and 20.5 (L2) Mg ha–1.
0.00 0.05 0.10 0.15 0.20 0.25 0.30
11/5/2001 5/24/2002 12/10/2002 6/28/2003
Ni concentration in runoff, mg L
–
1
a
0.00 0.01 0.02 0.03 0.04 0.05 0.06 0.07 0.08 0.09 0.10
0 200 400 600 800
b
0 1000 2000 3000 4000 5000 6000
11/5/2001 5/24/2002 12/10/2002 6/28/2003
Ni load in runoff, g ha
–
1
Data period
c
0 200 400 600 800 1000 1200 1400 1600 1800
0 100 200 300 400 500 600 700 Erosivity index EI30, MJ mm ha–1h–1
L2
L1 L0
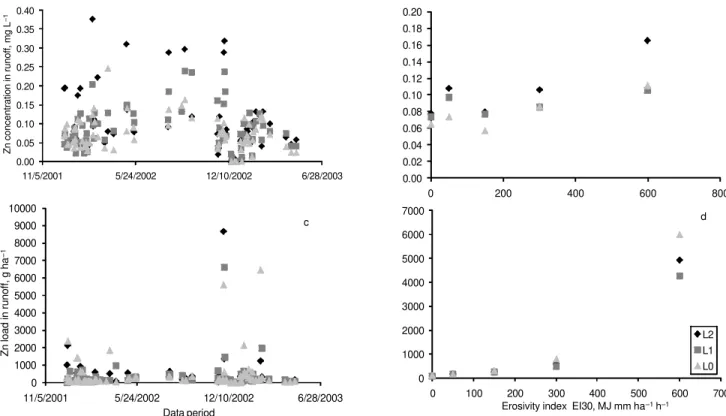
Figure 4 - Zinc concentration and load in the runoff water as a function of (a and c) time and (b and d) EI30 classes, respectively, in the sewage sludge application rates of 0 (L0), 10.2 (L1) and 20.5 (L2) Mg ha–1.
0.00 0.05 0.10 0.15 0.20 0.25 0.30 0.35 0.40
11/5/2001 5/24/2002 12/10/2002 6/28/2003
Zn concentration in runoff, mg L
–
1
0.00 0.02 0.04 0.06 0.08 0.10 0.12 0.14 0.16 0.18 0.20
0 200 400 600 800
0 1000 2000 3000 4000 5000 6000 7000 8000 9000 10000
11/5/2001 5/24/2002 12/10/2002 6/28/2003
Zn load in runoff, g ha
–
1
Data period
c
0 1000 2000 3000 4000 5000 6000 7000
0 100 200 300 400 500 600 700 Erosivity index EI30, MJ mm ha–1h–1
L2 L1 L0 d
The total load of metals in the runoff was cal-culated from the volume of water and sediment and the metal concentration (Table 7). There was a trend for lower loads in the areas with higher rates of sew-age sludge, although the concentration was higher, that was related to the high runoff volume in the plots with-out sewage sludge application. Therefore, the trace metal load was more influenced by the runoff volume than by the concentration, which represents an impor-tant point to be considered in terms of contamination of water bodies.
The concentration and load of Cu, Ni and Zn are in Figures 2, 3 and 4, respectively, separated by rainfall events and by EI30 categories. There was large variability in the runoff trace metal concentration, with no direct relationship with rainfall volume, time after sludge application and EI30 values. The trace metals load transported in the runoff is directly related to the volume and intensity of rainfall events, represented by the EI30 values.
The total load of trace metals was transported mostly by sediment, as compared to the water runoff losses (Table 7). Considering all events, the total con-tent of metals transported by sediment was proportional to sediment yield during the two years. On plots with no sewage sludge application, the load of total metals was higher. Once again, this was caused by the higher sediment losses on this treatment, as showed on Table
5. However, the load of exchangeable metals was higher on plots with sewage sludge, and this was related to concentration of metals on sediment (Table 6).
CONCLUSIONS
Sewage sludge application in soil reduced to-tal volume of sediment and water in the surface run-off and, as a result, load of the total amount trace met-als was not altered by the waste utilized in the two years covered by the study.
There was an increase in the load of exchange-able Cu, Ni and Zn in the sediment transported by run-off after sewage sludge application.
Application of sewage sludge increased the ex-changeable Zn concentration in runoff and increased exchangeable Zn transported by water and sediment.
The transport of Cu, Ni and Zn was mainly due to sediment losses occurring in a few highly ero-sive rainfall events in the period studied.
ACKNOWLEDGMENTS
REFERENCES
ABREU, M.F.; ABREU, C.A.; ANDRADE, J.C. Determinação de fósforo, potássio, cálcio, magnésio, enxofre, cobre, ferro, manganês, zinco, níquel, cádmio, cromo e chumbo em ácido nítrico usando métodos de US-EPA. In: RAIJ, B. van; ANDRADE, J.C.; CANTARELLA, H.; QUAGGIO, J.A. (Ed) Análise química para avaliação da fertilidade de solos tropicais. Campinas: Instituto Agronômico, 2001. p.151-161.
AGUILAR, R.; LOFTIN, S.R. Sewage sludge application in semiarid grasslands: effects on runoff and surface water quality. In: ANNUAL NEW MEXICO WATER CONFERENCE, 36., Las Cruces, 1991. Proceedings. New Mexico: Water Resources Research Institute, 1991. p.101-111. (WRRI Report, 265). BERTON, R.S. Riscos de contaminação do agroecossistema com
metais pesados. In: BETTIOL, W.; CAMARGO, O.A. (Ed.).
Impacto ambiental do uso agrícola do lodo de esgoto.
Jaguariúna: Embrapa Meio Ambiente, 2000. p.259-268. BERTONI, J.; LOMBARDI NETO, F. Conservação do solo. São
Paulo: Ícone, 1990. 355p.
BOSSCHE, H.V.; AUDIC, J.M.; HUHYARD, A.; GASCUEL-ODOUX, C.; TROLARD, F.; BOURRIE, G. Phosphorus losses from sewage sludge disposed on a field: evidence from storm event simulations. Water Science and Technology, v.42, p.179-186, 2000.
CANTARELLA, H.; TRIVELIN, P.C.O. Determinação de nitrogênio total em solo. In: RAIJ, B. van; ANDRADE, J.C.; CANTARELLA, H.; QUAGGIO, J.A., (Ed.) Análise química para avaliação da fertilidade de solos tropicais. Campinas: Instituto Agronômico, 2001. 285p.
COMPANHIA DE TECNOLOGIA DE SANEAMENTO AMBIENTAL - CETESB. Aplicação de biossólidos de
sistemas de tratamento biológico em áreas agrícolas:
critérios para projeto e operação; manual técnico. São Paulo: Cetesb, 1999. 33p.
CRITCHFIELD, H.J. General climatology. Englewood Cliffs: Prentice-Hall, 1960. 465p.
EDWARDS, W.M.; OWENS, L.B. Large storm effects on total soil loss. Journal of Soil and Water Conservation, v.46, p.75-78, 1991.
ELLIOT, H.A. Land application of municipal sewage sludge. Journal of Soil and Water Conservation, v.41, p.5-10, 1986.
EVANGELOU, V.P. Environmental soil and water chemistry. New York: John Wiley, 1998. 564p.
GALDOS, M.V.; DeMARIA, I.C.; CAMARGO, O.A. Atributos químicos e produção de milho em um latossolo vermelho eutroférrico tratado com lodo de esgoto. Revista Brasileira de Ciência do Solo, v.28, p.569-577, 2004.
HARRIS-PIERCE, R.L.; REDENTE, E.F.; BARBARICK, K.A. Sewage sludge application effects on runoff water quality in a semiarid grassland. Journal of Environmental Quality, v.24, p.112-115, 1995.
JORGE, J.A.; CAMARGO, O.A.; VALADARES, J.M.A.S. Condições físicas de um latossolo vermelho escuro, quatro anos após a aplicação de lodo de esgoto e calcário. Revista Brasileira de Ciência do Solo, v.15, p.237-240, 1991.
JOSHUA, W.D.; MICHALK, D.L.; CURTIS, I.H.; SALT, M.; OSBORNE, G.J. The potential for contamination of soil and surface waters from sewage sludge (biosolids) in a sheep grazing study, Australia. Geoderma, v.84, p.135-156, 1998. KELLING, K.A.; PETERSON, A.E.; WALSH, L.M. Effect of
wastewater sludge on soil moisture relationships and surface runoff. Journal of Water Pollution Control Federation, v.49, p.1698-1703, 1977.
KLADIVKO, E.J.; NELSON, D.W. Surface runoff from sludge-amended soils. Journal of the Water Pollution Control Federation, v.51, p.100-110, 1979.
LOCH, R.J.; COSTANTINI, A.; BARRY, G.A.; BEST, E.K. Evaluation of the potential to dispose of sewage sludge. II. Potential for off-site movements of solids and solutes. Australian Journal of Soil Research, v.33, p.1053-1062, 1995.
LOMBARDI NETO, F.; BERTONI, J. Erodobilidade de solos paulistas. Campinas: Instituto Agronômico, 1975. 12p. (Boletim Técnico, 27).
LOMBARDI NETO, F.; MOLDENHAUER, W.C. Erosividade da chuva: sua distribuição e relação com as perdas de solo em Campinas, SP. Bragantia, v.51, p.189-196, 1992.
NAVAS, A.; BERMUDEZ, F.; MACHIN, J. Influence of sewage sludge application on physical and chemical properties of Gypsisols. Geoderma, v.87, p.123-135, 1998.
MOSTAGHIMI, S.; DEIZMAN, M.M.; DILLAHA, T.A.; HEATWOLE, C.D. Impact of land application of sewage sludge on runoff water quality. Transactions of the ASAE, v.32, p.491-496, 1989.
QUINTON, J.N.; CATT, J.A.; HESS, T.M. The selective removal of phosphorus from soil: is event size important? Journal of Environmental Quality, v.30, p.538-545, 2001.
RAIJ, B. van; ANDRADE, J.C.; CANTARELLA, H.; QUAGGIO, J.A. Análise química para avaliação da fertilidade de solos tropicais. Campinas: Instituto Agronômico, 2001. 285p. SAS INSTITUTE. SAS/STAT software: changes and
enhancements through release 6.12. Cary: SAS Institute, 1997. WILSON, S.C.; DUARTE-DAVIDSON, R.; JONES, K.C. Screening the environment fate of organic contaminants in sewage sludges applied to agricultural soil. 1. The potential for downward movement to groundwaters. Science of the Total Environment, v.185, p.45-57, 1996.
WISCHMEIER, W.H.; SMITH, D.D. Predicting rainfall erosion losses: a guide to conservation planing. Washington, D.C.: USDA, 1978. 58p. (Agricultural Handbook, 537).