Article
Printed in Brazil - ©2012 Sociedade Brasileira de Química0103 - 5053 $6.00+0.00
A
*e-mail: [email protected]
Refining of Buriti Oil (Mauritia flexuosa) Originated from the Brazilian Cerrado:
Physicochemical, Thermal-Oxidative and Nutritional Implications
Jailane de Souza Aquino,*,a Débora C. N. de Pontes Pessoa,b Kassandra de Lourdes G. V. Araújo,c Poliana S. Epaminondas,d Alexandre Ricardo P. Schuler,e Antônio G. de Souzaf and
Tânia Lúcia M. Stamfordb
aDepartamento de Nutrição (CCS), cDepartamento de Ciência e Tecnologia de Alimentos and
fDepartamento de Química (CCEN),Universidade Federal da Paraíba, Campus I,
Cidade Universitária, s/n, Castelo Branco, 58051-900 João Pessoa-PB, Brazil
bDepartamento de Nutrição (CCS) and eDepartamento de Engenharia Química (CTG),
Universidade Federal de Pernambuco, Campus Recife, s/n, Cidade Universitária, 50670901 Recife-PE, Brazil
dSetor de Agroindústria, Instituto Federal de Educação, Ciência e Tecnologia (IFPB),
Campus Sousa, Jardim Sorrilândia, 58800-970 Sousa-PB, Brazil
Objetivou-se comparar os parâmetros físico-químicos e termo-oxidativos do óleo bruto de buriti com o refinado, como também determinar o teor de vitamina A, perfil lipídico e potencial antioxidante destes óleos. Amostras de óleo bruto e refinado foram avaliadas quanto à viscosidade, densidade relativa, índices de refração, acidez, ácidos graxos livres, peróxido e de iodo, grau de oxidação lipídica por UV-Vis, termogravimetria, calorimetria, capacidade antioxidante, teor de vitamina A e perfil de ácidos graxos. O refino do óleo diminuiu o percentual de ácidos graxos livres e os índices de acidez, de iodo e de peróxido, apresentando maior estabilidade termo-oxidativa que o óleo bruto. Porém sua capacidade antioxidante, o teor de vitamina A e o de ácidos graxos insaturados foram reduzidos em relação ao óleo bruto. Logo, sugere-se a otimização do processo de refino para minimizar perdas nutricionais no óleo de buriti, que por suas características pode ser considerado um alimento funcional.
The objective of this study was to compare the physicochemical, thermo-oxidative and nutritional characteristics of crude and refined buriti oil. Crude and refined oil samples were evaluated for viscosity, relative density, refraction, acidity, free fatty acids, peroxide and iodine, lipid oxidation degree by UV-Vis, thermogravimetry, calorimetry, in vitro antioxidant capacity, vitamin A content and fatty acids profile. The refining process decreased the free fatty acids percentage and acidity, peroxide and iodine indexes, with greater thermal-oxidative stability, which is critical for its use in cooking food. However, its antioxidant capacity, vitamin A and unsaturated fatty acids contents were reduced compared to crude oil. Therefore, it is suggested to optimize the refining process to minimize nutritional losses in buriti oil, which due to its characteristics, can be considered a functional food.
Keywords: antioxidants, buriti oil, carotenes, fatty acids, oxidative stability, refined oil
Introduction
Vegetable oils are used in industrial products such as margarine, vegetable creams, salad dressings, mayonnaise, and also in foods manually prepared,1 contributing to flavor,
appearance and creamy texture of foods.2 There has been
and increasing demand for vegetable oils with special composition such as olive, sunflower, palm and linseed oils, which have shown high commercial value due to the presence of functional components.1
Buriti oil (Mauritia flexuosa) has functional properties due to its high concentration of monounsaturated fatty acids (MUFA), nutrient with hypocholesterolemic action.3
nutritionally important and well recognized as antioxidants6
and pro-vitamin A.7
The antioxidant properties of vegetable oils have been widely studied due to the health benefits to consumers and their use in the food industry.6,8 The oxidative stability
of a vegetable oil can be influenced by the amount of antioxidants naturally present or added to this product.9
The composition and consequently the nutritional value of crude buriti oil may vary with season and extraction process. Improper post-harvest handling of this fruit may lead to decreased smoke point, oxidation of vitamins and high acidity levels (hydrolysis of triacylglycerols), which reduces the oxidative stability of this oil.10 In this context,
the refining of crude vegetable oils should be performed, which includes degumming, neutralization, clarification and deodorization steps,11 resulting in a product with desirable
physicochemical, nutritional and sensory characteristics. Due to the use of crude buriti oil in foods, cosmetics, drugs,12 in polymeric materials,13,14 among others, this
study aimed to compare the physicochemical and thermo-oxidative characteristics of crude and refined buriti oils and also determine the vitamin A content, lipid profile and antioxidant potential of these oils.
Experimental
Material
Crude buriti oil was purchased in the local trade of the city of Picos-PI, Brazil. Oil samples were manually extracted from ripe fruits by boiling in water for 20 min at ± 60 °C, then separating the oily fraction from the aqueous fraction. For all experiments, 10 L of crude oil from different batches were used, and for each liter of oil aimed at refining, 200 mL were stored and 800 mL were refined for comparison of the physicochemical, thermo-oxidative and nutritional characteristics between samples before and after the refining process.
Extracting and refining processes
Crude buriti oil was refined according to degumming, neutralization, washing and drying steps. The oil underwent degumming process by adding 3.0% of water in relation to the oil mass, with subsequent heating at 60 °C and stirring for 30 min, in accordance with methodology proposed by Moretto and Fett.15
Then, the oil was neutralized using methodology of Morais et al.16 at temperature of 50 °C and stirring for
30 min, by adding 5.0% of sodium hydroxide solution in relation to the oil mass, and this solution had concentration
of 12%. Subsequently, the oil was centrifuged at 5000 rpm for the removal of solid impurities from the product. Soon after, the oil was transferred to a separatory funnel where successive washes were performed. The washings were carried out at intervals of 30 min each, and the neutralized oil was added of water at room temperature and water at temperature of 90-95 °C in rotation, always submitting it to manual shaking in the separatory and gas removal funnel. In each washing step, after the separation phase, the water was discarded and phenolphthalein was added and then, in the last wash, bromothymol green was added in order to detect any trace of sodium hydroxide used in neutralization. The washings continued until the indicators no longer detected alkalinity in the water.
The oil was dried in a rotary evaporator at 60 °C with vacuum pressure for 20 min under mild agitation and cooled. These oil samples were stored in amber glass containers with capacity of 1 L each, properly coded and kept under refrigeration between 7 and 10 °C.
Physicochemical and thermal analyses
The physicochemical evaluation of crude and refined buriti oils consisted of determining viscosity, relative density, refractive index,17 acidity index, free fatty acids,
peroxide index, iodine index, lipid oxidation level by spectroscopy at the UV-Vis region in spectrometer model UV-2550 Shimadzu, with wavelengths between 200 and 900 nm, using 1 µL oil diluted in dichloromethane.18
The thermogravimetric (TG) and calorimetric curves (DSC - differential scanning calorimetry) were obtained using analyzer SDT 2960 (TA Instruments) and thermal analyzer DSC 2920 (TA Instruments), respectively. The non-isothermal method was applied using 10 mg of sample heated at 10 °C min -1 up to 900 °C, for TG, and up to 600 °C
for DSC. Analyses were performed using platinum sample holder and synthetic air at flow rate of 110 mL min-1. The
onset oxidation temperature was obtained (OTonset), which
is the temperature corresponding to the sudden increase in oxidation products, as well as the initial oxidation temperature (OTi), corresponding to the beginning of
oxidation.
Lipid profile
Initially, the lipid extract was obtained by the method of Folch et al.19 From this extract, the methyl esters were
obtained by esterification carried out in accordance with the method of Hartman and Lago.20 The identification
(model CG-Master) with flame ionization detector. The chromatographic conditions were: polyethylene glycol column (Carbowax 20M) made of fused silica 30 m long, 0.53 mm in diameter and 0.25 µm of film thickness of stationary phase. The temperatures used were 150 and 200 °C for vaporizer and detector, respectively. The furnace programming consisted of the following operation sequence: 80 °C for 3 min, increasing 10 °C min-1 up to
120 °C, remaining at 200 °C for 6 min, and then decreasing 3 °C min-1 up to 180 °C. The mobile phase was hydrogen,
with flow rate of 5 mL min-1. The injected volume was
1 µL, with split ratio of 1:25. The fatty acids profile characterization was performed by comparison of the mass spectra obtained with that of standards that were also injected into the GC-MS.
Vitamin A determination
Samples were cold saponified with 10% potassium hydroxide solution in methanol. The extract was added of petroleum ether and washed with water until neutral pH, then the volume was adjusted and the extract was filtered through a 0.45 µL membrane for injection. The beta carotene identification and quantification was performed in a Shimadzu class 10 HPLC with diode array and manual injector and wavelength of 450 nm. The chromatographic conditions were: lichrospher 100 RP column (Merck), C18, 125 m long, 4 mm in diameter and 5 µm of film thickness of stationary phase. The mobile phase was methanol: chloroform (95:5), at flow rate of 1 mL min-1. The injected
volume was 200 µL. The beta carotene result was converted into vitamin A using factor 1.8.21
Antioxidant potential of in vitro crude and refined buriti oils
For this analysis, the extract was prepared from 5 g of oil was added of 40 mL of hexane, the resulting suspension was homogenized and left to rest for 60 min at room temperature. The mixture was centrifuged at 15.000 rpm for 15 min and the supernatant transferred to a 100 mL volumetric flask. From the residue after the first extraction, 40 mL of 70% acetone were added, homogenized and left to rest for 60 min at room temperature. Subsequently, the sample was once again centrifuged at 15.000 rpm for 15 min and the supernatant was transferred to the flask containing the first supernatant, and the volume was completed to 100 mL with distilled water.
Different extract concentrations were used in the evaluation (0.4; 1.0; 2.0; 3.0 and 4.0 mg mL-1). Aliquot of
0.1 mL of extract at different concentrations, was added to 3.9 mL of DPPH. methanol solution (60 µmol L-1). The
mixture was homogenized and incubated in the dark for 30 min. The results were read at 517 nm on Shimadzu UV-Vis spectrophotometer model 1650-PC. Methyl alcohol was used as white to calibrate the spectrophotometer.22
Carduus marianus and catechin solutions were used as
antioxidant standards in the same concentration as that of the extract. Analyses were performed in triplicate and the results expressed in % scavenging of free radicals (SFR), using the following equation
where, SFR = % scavenging of free radicals, Abs w = control absorbance (DPPH without test substance) and Abs s = sample absorbance.
The IC50 value was calculated based on the final
concentration in mg mL-1 of dry extract required to decrease
the initial DPPH concentration by 50%.23
Statistical analysis
Statistical analysis was performed using the SPSS (SPSS INC. 14.0 for Windows Evaluation Version).24
Averages were submitted to the t-Student test, p ≤ 0.05 was considered statistically significant.
Results and Discussion
Physicochemical and thermal analyses
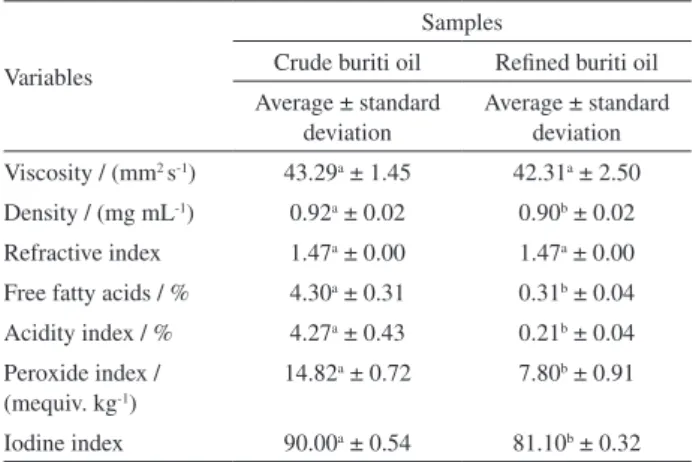
Table 1 shows the comparison between the physicochemical characteristics of crude and refined buriti oils. The crude buriti oil showed higher density, higher percentage of free fatty acids, higher acidity, peroxide and iodine indexes (p ≤ 0.05).
Table 1. Physicochemical characterization of crude and refined buriti oils
Variables
Samples
Crude buriti oil Refined buriti oil Average ± standard
deviation
Average ± standard deviation Viscosity / (mm2 s-1) 43.29a ± 1.45 42.31a ± 2.50 Density / (mg mL-1) 0.92a ± 0.02 0.90b ± 0.02 Refractive index 1.47a ± 0.00 1.47a ± 0.00 Free fatty acids / % 4.30a ± 0.31 0.31b ± 0.04 Acidity index / % 4.27a ± 0.43 0.21b ± 0.04 Peroxide index /
(mequiv. kg-1)
14.82a ± 0.72 7.80b ± 0.91
In a study by Silva et al.,10 the acidity of refined buriti
oil ranged from 2.01 to 6.22 and crude buriti oil from 1.14 to 1.77, whose results are different from those obtained in this study. The higher the acidity of the crude oil, the greater the losses of pigments will be, since greater amounts of NaOH will be required in the neutralization step during the refining process. According to Del Rio et al.,25 sunflower
(0.08%) and soybeans oils (0.082%) had lower acidity than the refined buriti oil (0.21%), which in turn was similar to that obtained for palm oil (0.27%) by the same authors. The acidity index may vary depending on the maturity of the vegetable from which the oil is extracted,26 on thermal
treatments27 and on refining process.25
According to Ribeiro et al.,28 the maximum free fatty
acids content should be 5% for crude buriti oil and 1% for refined buriti oil, and it was observed that the oils analyzed in this study are within the standards recommended. During the refining process, the free fatty acids content must be reduced to an acceptable level recommended by current legislation, and this occurred after the refining process. Free fatty acids occur naturally in crude oils and their content can rise during storage or handling. Some crude oils have higher free fatty acids contents due to enzymatic hydrolysis or poor conditions during transport and/or storage of grains. The FFA (free fatty acids) content is good indicator of the quality of crude and refined oils.29
The iodine index measures the degree of unsaturation of oils, revealing that there was degradation of unsaturated fatty acids during the refining process. Nevertheless, both samples showed acceptable iodine index between 115 and 150 for crude oil and between 80 and 150 for refined buriti oil.30 The refractive index of 1.47 and density between 0.90
and 0.92 mg mL-1 were very close to values obtained by
García-Quiroz et al.30 and by Silva et al.10 for a blend of
homemade and industrialized oils.
There was a 50% reduction in the peroxide index of crude buriti oil after refining, and these results are satisfactory according to the Codex Alimentarius, which establishes that peroxide index values of up to 15 mequiv. kg-1 for unrefined
oils are acceptable, since at this stage, the rancidity taste is noticeable.31 However, according to parameters reported
by Ribeiro et al.28 and Shahidi,32 the maximum peroxide
index for crude oil must be 10 mequiv. kg-1 and for refined
buriti oil 7 mequiv. kg-1.
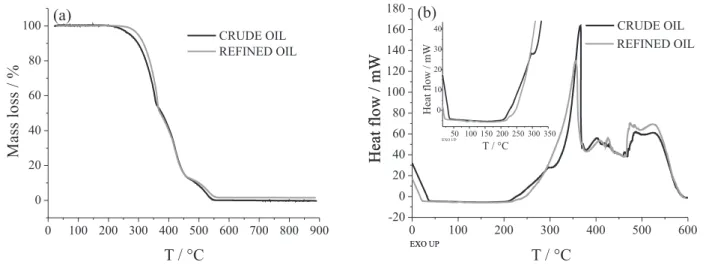
Figure 1 shows the UV-Vis absorbance spectra, with a high absorption in the spectral region between 280 and 360 nm, which increases with the thermal oxidation of oils. These absorption regions can be attributed to the oxidation of the oils tested, since the primary compounds from the oxidation process show absorbance regions around 240 and 320 nm (conjugated dienes). Furthermore,
secondary compounds (trienes, aldehydes, β-unsaturated, conjugated α ketones) have absorption peaks around 280 and 320 nm.33 In oils, when there is any type of change,
as that induced by thermal oxidation, for example, the generated spectrum shows a band shift (bathochromic effect) and increased absorption intensity.34 This result
may be associated with a decrease of the iodine index previously reported (Table 1), showing the importance of combining analytical techniques in the search for more accurate results.
A higher absorption peak of about 459 nm could be observed in the refined buriti oil due to oxidative cleavage of carotenoids into apocarotenoids during the refining process,28 which showed absorbance regions around 410
and 476 nm.35
It was found that crude and refined buriti oil samples showed similar TG profiles, with three common steps of mass variation (Table 2 and Figure 2a).
The DSC curves (Figure 2), as well as data extracted from these curves (Table 2) highlight the oxidation temperatures (OT). In this study, it was chosen to determine the oxidative stability of buriti oils from the initial oxidation temperature (OTi), since in the case of products for food
production, it is more convenient to consider parameters corresponding to the onset of the oxidation process than those related to the stage where there is a sudden increase in the formation of oxidation products (onset oxidation temperature obtained from the extrapolation of the tangent to the curve).
A difference in oxidative stability between crude and refined buriti oils was observed, considering the results of OTi of 196
oC and OT
i of 203
oC, respectively, which
from the reduction in the free fatty acids contents after the refining process, as discussed in the physicochemical analysis (Table 1). Besides the reduction in the free fatty acids contents, the refining process is aimed at removing other impurities such as phospholipids and pigments,36
despite the favorable antioxidant action of some pigments such as carotenoids and tocopherols of natural occurrence in these oils.
Oxidation propagation temperatures (OTonset) were
lower for crude buriti oils, corroborating the greater thermo-oxidative fragility of crude oils compared to refined oils. Tan et al.37 analyzed the oxidative stability of
oil samples with high polyunsaturated fatty acids content such as olive, corn, sunflower, peanut and soybean oils, among others, with OTonset of 169, 167, 132, 127 and
124 oC, respectively, in pure oxygen atmosphere and
other analytical conditions similar to those in this study, and observed that the oxidation propagation temperatures
(OTonset) were higher for both crude and refined buriti oil
samples, showing the higher oxidative stability of buriti oils over other vegetable oils. Pardauil et al.38 evaluated the
oxidative stability of buriti oil using DSC and Rancimat techniques and found that buriti oil is highly stable and is very useful for the food industry.
Lipid profile
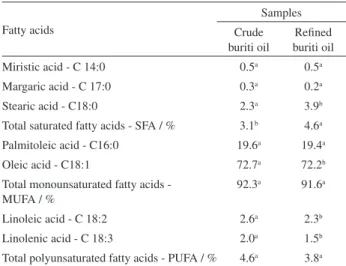
Table 3 shows the fatty acid composition of crude and refined buriti oils. A decrease in the amount of unsaturated fatty acids and an increase in the saturated fatty acids contents were observed after the refining process, which was also confirmed by the decrease of the iodine index (Table 1). It is suggested that the neutralization and washing steps may interfere with the breaking of double bonds, since unsaturated fatty acids are more reactive and more susceptible to oxidation.39
The fatty acid composition results of crude and refined buriti oils corroborate those found by Schlemmer and Sales14 and Albuquerque et al.,4 who observed in crude
buriti oil, 2% of stearic acid, 73.3 to 78.73% of oleic acid, 2.4% of linoleic acid, and 2.20% of linolenic acid. Higher linoleic acid values (4.94%) were found in the buriti oil by Silva et al.10 and Ceriani et al.41 This variation in results may
be influenced by season, extraction and refining processes. Moreover, buriti oil showed a high unsaturated fatty acids content (over 90%), being suitable as functional food as reported by Ribeiro.28
The buriti oil is classified as an oleic oil, which is the same as olive oil, canola oil and peanut oil, since this Table 2. Thermogravimetric and calorimetric data of buriti oil samples in an oxidizing atmosphere (synthetic air)
Samples TG DSC
Step Tinitial / oC Tfinal / oC Tpeak DTG / oC ∆ma / % OTib/ oC OTonsetc / oC
Buriti oils
Crude
1st 2nd 3rd
174 372 469
372 469 560
352 421 560
48 40 12
196 223
Refined
1st 2nd 3rd
232 375 475
375 475 573
361 419 532
51 37 12
203 263
amass loss, binitial oxidation temperature and coxidation temperature.
fatty acid is present in quite high amounts, about 75% in buriti oil.4 However, it could be observed that the buriti oil
analyzed has monounsaturated fatty acid content higher than olive oil and Brazil nut oil, widely recognized by its capacity of favorably changing the lipid profile, reducing total cholesterol, LDL cholesterol and triglycerides, preventing cardiovascular diseases.3 Moreover, the
saturated fatty acids content is comparable to olive oil, soybean oil and Brazil nut oil. It is noteworthy that the fatty acids composition reported in this study for refined buriti oil is the first report in literature.
Vitamin A determination
A statistically significant decrease (p < 0.05) in vitamin A and beta carotene contents of refined oil in relation to crude oil was observed in this study. Crude buriti oil showed 50.636 IU of vitamin A and 911.4 ± 2.4 mg kg-1
of beta carotene, while refined buriti oil showed 44.006 IU of vitamin A and 792.1 ± 4.54 mg kg-1 of beta carotene.
According to Gunstone,36 during the refining process,
unsaponifiables are partially removed or degraded during neutralization, bleaching and deodorizing stages. According to Ribeiro et al.,28 in the degradation of carotenoids,
β-carotene is transformed into apocarotenoids, especially 10-apo-β-carotenal, which explains the reduced vitamin A and carotenoid contents in crude buriti oil compared to refined buriti oil. However, the apocarotenoid formed could be used in the manufacturing of margarine as a substitute for synthetic dyes such as canthaxanthin and 8-apo-β -carotenal. This fact was also observed in the absorption spectra of UV-Vis, which was confirmed by the decrease in carotenoids.
The carotenoid contents determined by HPLC in this study was higher for refined oil samples than those reported by Silva et al.,10 which ranged from 252 to 664 mg kg-1
for industrialized buriti oil, using the same technique. However, the carotenoid contents found in this study for crude buriti oil were lower than 1706 ± 54 mg kg-1 reported
by Garcia-Quiroz et al.30 and 1700 mg kg-1 reported by
Albuquerque et al.,40 both carried out by spectrophotometry
and similar to that reported by Silva et al.,10 which averaged
900 ± 10 mg kg-1 of carotenoids for homemade buriti oil,
determined by HPLC.
Even with the decrease in vitamin A and carotenoid contents from crude to refined buriti oils, this level still exceeds the carotenoid contents of tucumã, bocaiuva bacuri and umari (mari) palm fruits, because, according to Rodriguez-Amaya,42 buriti is the food product showing
the highest known beta carotene concentration among the wide range of Brazilian foods already analyzed.
Antioxidant potential
The potential of crude and refined buriti oils to scavenge free radicals was expressed as the final extract concentration required to inhibit the oxidation of the DPPH radical by 50% (IC50), and results are shown in Table 4.
The lowest IC50 values were obtained in crude buriti
oils, indicating a higher antioxidant potential in relation to refined oils. An extract showing high potential to scavenge free radicals has low IC50.
23 It was observed that
crude buriti oil showed lower IC50 when compared to corn,
sunflower and soybean oils analyzed by Valavanidis et al.,43
thus showing higher antioxidant activity than these oils. However, it showed higher IC50 when compared to
olive oil, thus showing lower antioxidant activity than the same.
Refined buriti oil showed higher antioxidant activity than soybean oil (IC50 = 52 mg mL
-1) and lower antioxidant
activity compared to in natura sunflower, corn and olive
oils, which showed IC50 of 45, 48 and 22 mg mL
-1,
respectively.43 This is explained by losses of antioxidants
Table 3. Fatty acids present in crude and refined buriti oils
Fatty acids
Samples Crude buriti oil
Refined buriti oil
Miristic acid - C 14:0 0.5a 0.5a
Margaric acid - C 17:0 0.3a 0.2a
Stearic acid - C18:0 2.3a 3.9b
Total saturated fatty acids - SFA / % 3.1b 4.6a
Palmitoleic acid - C16:0 19.6a 19.4a
Oleic acid - C18:1 72.7a 72.2b
Total monounsaturated fatty acids - MUFA / %
92.3a 91.6a
Linoleic acid - C 18:2 2.6a 2.3b
Linolenic acid - C 18:3 2.0a 1.5b
Total polyunsaturated fatty acids - PUFA / % 4.6a 3.8a Different letters on same row represent significant difference at 5% level by t-Student test. The values are expressed in percentage (%).
Table 4. Antioxidant activities of crude and refined Buriti oils
Buriti oils Radical DPPH scavenging activity IC50 / (mg mL-1)
Crude 25.19 ± 5.42b
Refined 50.98 ± 3.31a
such as flavonoids, tocopherols and vitamin A44 during the
refining process, which should be controlled by the food industry since there is a tendency to even greater losses of antioxidants during the heating of oils, i.e., at frying or baking temperatures.43
Conclusions
The analytical techniques used in this study complemented each other, and it could be inferred that the refining process of buriti oil decreased the amounts of vitamin A, unsaturated fatty acids and its antioxidant activity in relation to crude buriti oil. Nevertheless, an improvement in physicochemical characteristics of the refined oil was observed, providing it high thermal-oxidative stability against oils usually edible. Therefore, the refining process should be improved to minimize nutritional losses in buriti oil, which can be considered a functional food.
References
1. Foster, R.; Williamson, C. S.; Lunn, J.; Nutr. Bull. 2009, 34, 4. 2. Saberi, A. H.; Kee, B. B.; Oi-Ming, L.; Miskandar, M. S.; Food
Chem.2011, 127, 1031.
3. Binkoski, A. E.; Kris-Etherton, P. M.; Wilson, T. A.; Mountain, M. L.; Nicolosi, R. J.; J. Am. Diet. Assoc. 2005, 105, 1080. 4. Albuquerque, M. L. S.; Guedes, I.; Alcantara Jr., P.; Moreira,
S. G. C.; Barbosa Neto, N. M.; Correa, D. S.; Zilio, S. C.;
J. Braz. Chem. Soc. 2005, 16, 1113.
5. De Rosso, V. V.; Mercadante, A. Z.; J. Agric. Food Chem. 2007,
55, 5062.
6. Sem, C. K.; Khanna, S.; Roy, S.; Life Sci. 2006, 78, 2088. 7. Klemm, R. D. W.; Labrique, A. B.; Christian, P.; Rashid, M.;
Shamim, A. A.; Katz, J.; Sommer, A.; West, K. P.; J.Pediatr. 2008, 122, 242.
8. Gunstone, F. D.; Vegetable Oils in Food Technology: Composition, Properties and Uses, Blackwell Publishing: Oxford, 2002.
9. Arain, S.; Sherazi, S. T. H.; Bhanger, M. I.; Talpur, F. N.; Mahesar, S. A.; Thermochim. Acta2009, 484, 1.
10. Silva, S. M.; Sampaio, K. A.; Taham, T.; Rocco, S. A.; Ceriane, R.; Meirelles, A. J.; J. Am. Oil Chem. Soc. 2009, 86, 611. 11. Ministério da Agricultura, Pecuária e Abastecimento;
Regulamento Técnico de Identidade e Qualidade de Óleos Vegetais Refinados - Instrução Normativa n. 49, Brasil, 2006. DOU 26/12/2006.
12. Zanatta, C. F.; Ugartondo, V.; Mitijans, M.; Rocha-Filho, P. A.; Vinardell, M. P.; Food Chem. Toxicol. 2008, 46, 2776. 13. Durães, J. A.; Drummond, A. L.; Pimentel, T. A. P. F.; Murta, M.
M.; Moreira, S. G. C.; Sales, M. J. A.; J. Therm. Anal. Calorim.
2008, 92, 529.
14. Schlemmer, D.; Sales, M. J. A.; J. Therm. Anal. Calorim. 2010,
99, 675.
15. Moretto, E.; Fett, R.; Tecnologia de Óleos e Gorduras Vegetais, 2nd ed.; Varela:Rio de Janeiro, Brasil, 1989.
16. Morais, M. M.; Pinto, L. A. A.; Ortiz, S. C. A.; Crexi, V. T.; Silva, R. L., Silva, J. D.; Rev. Inst. Adolfo Lutz2001, 60, 23. 17. Agência Nacional de Vigilância Sanitária; Métodos Físico
Químicos para Análise de Alimentos, 4th ed.; Ministério da Saúde: Brasília, Brasil, 2005.
18. AOCS - American Oil Chemists’ Society; Official Methods and Recommended Practices of the American Oil Chemists’ Society,
4th ed; Association of Official Analytical Chemistis: Champaign, IL., 1997.
19. Folch, J.; Less, M.; Stanley, S. A.; J. Biol. Chem.1957, 226, 497.
20. Hartman, L.; Lago, R.C.A.; Lab. Practice1973, 22, 475. 21. Carvalho, P. R. N.; Collins, C. H.; Rodriguez-Amaya, D. B.;
Chromatographia1992, 33, 133.
22. Brand-Williams, W.; Cuvelier, M. E.; Berset, C.;Lebensm. Wiss. U.-Technol. 1995,28, 25.
23. Roesler, R.; Malta, L. G.; Carrasco, L. C.; Holanda, R. B.; Sousa, C. A. S.; Pastore, G. M.; Ciênc. Tecnol. Aliment. 2007, 27, 53. 24. SPSS® 14.0 for Windows Evaluation Version (Computer
program); LEAD Technologies SPSS Inc.: USA, 2005. 25. Del Río, V.; Larrechi, M. S.; Callao, M. P. Talanta2010, 81,
1572.
26. Dag, A.; Kerem, Z.; Yogev, N.; Zipori, I.; Lavee, S.; Ben-David, E.;
Sci. Hortic. 2011, 127, 358.
27. Rossi, M.; Alamprese, C.; Ratti, S.; Riva, M.; Food Chem. 2009,
112, 448.
28. Ribeiro, B. D.; Nascimento R. F., Barreto, D. W.; Coelho, M. A. S.; Freitas, S. P.;Rev. Bras. Frutic.2010, 32, 657.
29. O’Brien R. D.; Fats and Oils: Formulating and Processing for Applications, 2nd ed., CRC Press: New York, 2004.
30. García-Quiroz, A.; Moreira, S. G. C.; Morais, A. V.; Silva, A. S.; Rocha, G. N.; Alcantara, P.; Instrum. Sci.Tech. 2003,31, 93. 31. Verleyen, T.; Van Dyck, S.; Adams, C. A.; Accelerated Stability
Tests: Analysis of Lipid Oxidation, 5th ed.; AOCS Press: Champaign, 2005.
32. Shahidi F.; Quality Assurance of Fats and Oils, 6th ed.; Wiley: New York, 2005.
33. Cella, R. C. F.; Regitano-D’arce, M. A. B.; Spoto, M. H. F.;
Ciênc. Tecnol. Aliment. 2002, 22, 111.
34. Lima, S. M.; Bannwart, E. S.; Oliveira, R. G.; Andrade, L. H. C.; Del Ré, P. V.; Jorge, N.; Pedrochi, F.; Constantini, R.; Medina, A. N.; Baesso, M. L.; Eur. Phys. J. 2008, 153, 531.
35. Zanatta, C. F.; Mercadante, A. Z.; Food Chem. 2006, 101, 1526. 36. Gunstone, F. D.; Rapeseed and Canola Oil - Production,
Processing, Properties, and Uses,Oxford: CRC Press, 2004. 37. Tan, C. P.; Che Man Y. B.; Selamat, J.; Yusoff, M. S. A.; Food
38. Pardauil, J. J. R.; Souza, L. K. C.; Molfetta, F. M.; Zamian, J. R.; Geraldo, N.; Rocha Filho, G. N.; Da Costa, C. E. F.; Bioresour. Technol.2011. doi:10.1016/j.biortech.2011.02.022
39. McClements, D.; Decker, E. A.; J. Food Sci. 2000, 65, 1270. 40. Albuquerque, M. L. S.; Guedes, I.; Alcantara Jr., P.; Moreira,
S. G. C.; Vib. Spectrosc. 2003, 33, 127.
41. Ceriani, R.; Paiva, F. R.; Gonçalves, C. B.; Batista, E. A. C; Meirelles, A. J. A.; J. Chem. Eng. Data2008, 53, 1846.
42. Rodriguez-Amaya, D. B.; Fontes Brasileiras de Carotenóides: Tabela Brasileira de Composição de Carotenóides em Alimentos, Brasília: MMA/SBF, Brasil, 2008.
43. Valavanidis, A.; Nisiotou, C.; Papageorgiou, Y.; Kremli, I.; Satravelas, N.; Zinieris, N.; Zygalaki, H.; J. Agric. Food Chem.
2004,52, 2358.
44. Berlitz, H.-D.; Grosch, W.; Food Chem. 1999, 2, 222.
A
d
Printed in Brazil - ©2014 Sociedade Brasileira de Química0103 - 5053 $6.00+0.00Additions and Corrections
*e-mail: [email protected]
Refining of Buriti Oil (
Mauritia flexuosa
) Originated from the Brazilian Cerrado:
Physicochemical, Thermal-Oxidative and Nutritional Implications
Jailane de Souza Aquino,*,a Débora C. N. de Pontes Pessoa,b Kassandra de Lourdes G. V. Araújo,c Poliana S. Epaminondas,d Alexandre Ricardo P. Schuler,e Antônio G. de Souzaf and
Tânia Lúcia M. Stamfordb
aDepartamento de Nutrição (CCS), cDepartamento de Ciência e Tecnologia de Alimentos and fDepartamento de Química (CCEN),Universidade Federal da Paraíba, Campus I,
Cidade Universitária, s/n, Castelo Branco, 58051-900 João Pessoa-PB, Brazil
bDepartamento de Nutrição (CCS) and eDepartamento de Engenharia Química (CTG),
Universidade Federal de Pernambuco, Campus Recife, s/n, Cidade Universitária, 50670901 Recife-PE, Brazil
dSetor de Agroindústria, Instituto Federal de Educação, Ciência e Tecnologia (IFPB),
Campus Sousa, Jardim Sorrilândia, 58800-970 Sousa-PB, Brazil
Vol. 23, No. 2, 212-219, 2012
http://dx.doi.org/10.1590/S0103-50532012000200004
Table 3. Fatty acids present in crude and refined buriti oils
Fatty acids
Samples
Crude buriti oil
Refined buriti oil
Miristic acid - C 14:0 0.5a 0.5a
Margaric acid - C 17:0 0.3a 0.2a
Stearic acid - C18:0 2.3a 3.9b
Total saturated fatty acids - SFA / % 3.1b 4.6a
Palmitoleic acid - C16:1 19.6a 19.4a
Oleic acid - C18:1 72.7a 72.2b
Total monounsaturated fatty acids - MUFA / %
92.3a 91.6a
Linoleic acid - C 18:2 2.6a 2.3b
Linolenic acid - C 18:3 2.0a 1.5b
Total polyunsaturated fatty acids - PUFA / % 4.6a 3.8a
Different letters on same row represent significant difference at 5% level by t-Student test. The values are expressed in percentage (%).
Table 3. Fatty acids present in crude and refined buriti oils
Fatty acids
Samples
Crude buriti oil
Refined buriti oil
Miristic acid - C 14:0 0.5a 0.5a
Margaric acid - C 17:0 0.3a 0.2a
Stearic acid - C18:0 2.3a 3.9b
Total saturated fatty acids - SFA / % 3.1b 4.6a
Palmitoleic acid - C16:0 19.6a 19.4a
Oleic acid - C18:1 72.7a 72.2b
Total monounsaturated fatty acids - MUFA / %
92.3a 91.6a
Linoleic acid - C 18:2 2.6a 2.3b
Linolenic acid - C 18:3 2.0a 1.5b
Total polyunsaturated fatty acids - PUFA / % 4.6a 3.8a
Different letters on same row represent significant difference at 5% level by t-Student test. The values are expressed in percentage (%).
Page 217, Table 3
The fatty acid palmitoleic (C16:1) was in the percentage of 19.6 on crude oil of buriti and percentage of 19.4 in refined oil from buriti.
Will change to: