Article
Printed in Brazil - ©2012 Sociedade Brasileira de Química0103 - 5053 $6.00+0.00A
*e-mail: [email protected]
Discrimination of Sugarcane according to Cultivar by
1H NMR and
Chemometric Analyses
Elenilson G. Alves Filho,a Lorena M. A. Silva,a Rafael Choze,a Luciano M. Lião,a
Neli K. Hondab and Glaucia B. Alcantara*,a,b
aLaboratório de Ressonância Magnética Nuclear, Instituto de Química,
Universidade Federal de Goiás, CP 131, 74001-970 Goiânia-GO, Brazil
bDepartamento de Química, Universidade Federal de Mato Grosso do Sul,
CP 549, 79070-900 Campo Grande-MS, Brazil
Várias tecnologias para o desenvolvimento de novas cultivares de cana-de-açúcar têm focado, principalmente, no aumento da produtividade e maior resistência à doença. Cultivares de cana-de-açúcar são, geralmente, identificadas pela organografia das folhas e caule, análise de peroxidase e atividade da isoenzima esterase, proteínas solúveis totais e teor de sólidos solúveis. A ressonância magnética nuclear (RMN) associada às análises quimiométricas provou ser uma técnica valiosa para avaliação de plantas. Assim, este trabalho descreve o potencial das análises quimiométricas aplicadas a RMN de 1H de alta resolução com giro no ângulo mágico (HRMAS) e em solução para investigação de cultivares de cana-de-açúcar. Para esta proposta, folhas de oito diferentes cultivares de cana-de-açúcar foram analisadas por espectroscopia de RMN de 1H aliada à quimiometria. As técnicas empregadas apresentaram-se como ferramentas úteis para a distinção e classificação das diferentes cultivares, bem como para acessar as diferenças na composição química das cultivares.
Several technologies for the development of new sugarcane cultivars have mainly focused on the increase in productivity and greater disease resistance. Sugarcane cultivars are usually identified by the organography of the leaves and stems, the analysis of peroxidase and esterase isoenzyme activities and the total soluble protein as well as soluble solid content. Nuclear magnetic resonance (NMR) associated with chemometric analysis has proven to be a valuable tool for cultivar assessment. Thus, this article describes the potential of chemometric analysis applied to 1H high resolution magic angle spinning (HRMAS) and NMR in solution for the investigation of sugarcane cultivars. For this purpose, leaves from eight different cultivars of sugarcane were investigated by 1H NMR spectroscopy in combination with chemometric analysis. The approach shows to be a useful tool for the distinction and classification of different sugarcane cultivars as well as to access the differences on its chemical composition.
Keywords: NMR, 1H HRMAS, sugarcane, chemometric analysis, distinction of sugarcane cultivars
Introduction
Political and economical movements have revealed the enthusiasm for the use of biofuels from a global perspective of carbon emission reduction caused by
anthropogenic factors.1,2 Ethanol, in particular, is the
product of this movement due to its net positive energy
balance.1,3,4 In this context, Brazil has implemented the
program of ethanol production from sugarcane (Saccharum
hybrid sp.), called Pró-Álcool (Programa Nacional do Álcool), as a response by the government to the oil crisis
in 1973.5 This program cultivated the enhancement of
alcohol production by thirtyfold through the reduction of the production cost by 75% and increasing the yield
per hectare by 60%2 and production per year by 6%.6
In addition, the cost of ethanol obtained in Brazil from sugarcane is approximately $30 to $35 (in US dollar), while the ethanol obtained from other sources in the United Sates
of America and Europe is $80 and $55 per barrel of oil
The increasing success of sugarcane production is mainly related to the genetic improvement of cultivars in order to develop varieties adapted to the general edaphoclimatic characteristics and cultivation conditions of each geographic region. Additionally, new cultivars circumvent the issues of pathogen attacks that may limit their production and improve the industrial
characteristics of the varieties8 through, for example,
an increase in sugar content.9 Consequently, in the late
1960s, genetic improvement programs were imposed in Brazil, which later resulted in an interuniversity networks for the development of ethanol from sugarcane (Rede Interuniversitária para o Desenvolvimento do Setor
Sucroalcooleiro,RIDESA). From these programs, several
new hybrid sugarcane cultivars with RB initials (Republic of Brazil) were developed and released for cultivation in
Brazil.10
However, with the advent of genetic improvement, several varieties have arisen, and botanical identification
became increasingly difficult. In 1969, Larsen11 established
that all the morphological manifestations should have a biochemical difference, but not necessarily all of these differences are reflected morphologically. Thus, the biochemical differences should be more numerous than morphological. In the case of sugarcane, these cultivars are generally identified visually by the organography of the leaves and stems, the analysis of the esterase activity of relevant and soluble peroxidase and the total protein and
soluble solid content.12
Nuclear magnetic resonance (NMR) has been very valuable for the analysis of complex mixtures in several areas, such as food, metabolites and industrial
product analyses,13,14 in addition to provide a taxonomic
classification of vegetal species,15 considering that
different species can produce different metabolites.16 A
recent option in NMR is the HRMAS (high resolution magic angle spinning) technique, which combines the
advantages of NMR in solid state and in solution,17,18 and
has become useful for the direct analysis of many matrices such as seeds and leaves. Together to NMR, chemometric tools have been used as additional method for data exploration, such as: exploratory analysis (which enables the determination of the natural clusters), the consequential recognition of samples (which do not follow a certain pattern), the determination of the data information content and the verification of variables that
better define the groups.19
The aim of this work was to distinguish eight sugarcane cultivars according to its chemical characteristics
assessed by 1H NMR spectroscopy and chemometric
analysis.
Experimental
Samples and sample preparation
Leaves of eight different cultivars (RB72454, RB5054 (usual name for RB835054), RB548688 (RB835486), RB5113 (RB855113), RB5156 (RB855156), RB5453 (RB855453), RB5536 (RB855536) and RB7515 (RB867515)) were colleted in an experimental tillage located in Dourados City, Mato Grosso do Sul State, Brazil. The plants were obtained according to conventional methods of production.
Dried leaves were pulverised and sieved through 150-mesh in order to obtain particles of uniform size. The powdered leaves of each cultivar were directly submitted
to 1H HRMAS NMR analysis. While for 1H NMR in
solution, 300 mg of powdered leaves from each cultivar were suspended in 15 mL of methanol and sonicated for 5 min, followed by percolation for 4 h. This procedure was repeated three times for each sample. After evaporating the solvent, the methanolic extracts were kept in vacuum until NMR analyses.
Nine samples of each sugarcane cultivar were collected and analysed by both NMR techniques, in HRMAS and
in solution. The 1H NMR spectra were submitted to
chemometric investigations in order to distinguish the cultivar and to construct models for classification.
1H NMR spectra
The 1H NMR spectra were acquired on a Bruker Avance
III 500 NMR spectrometer, operating at 11.75 Tesla
(500 MHz for 1H), equipped with either a 4-mm high
resolution magic angle spinning (HRMAS) or a 5-mm triple resonance broadband inverse (TBI) probe.
For the semisolid analyses obtained by the HRMAS probe, each sample containing about 2.5 mg was
suspended in two D2O drops, inserted in a 12 µL
spherical HRMAS rotor for analysis and spun at 5 kHz
at the magic angle (54.7°) using both pulse sequence
for comparison: a composite pulse sequence (CPPR) for water presaturation and the Carr-Purcell-Meiboom-Gill (CPMG) spin-echo pulse sequence for elimination of broad signals from macromolecules. Water suppression was also included in the CPMG sequence. The CPMG pulse
sequence is as follows: RD – [–90º – (τ – 180º – τ)n – FID],
which RD = 2.0 s to allow T1 relaxation. τ = 300 µs was
fixed after optimisation in order to eliminate from the
1H NMR spectra the broadened signal from molecules with
short T2 (n = 128), giving a total spin-spin relaxation delay
For the solution analyses, about 15 mg of dried
methanolic extracts were redissolved in 0.6 ml of DMSO-d6
(99.9%) and submitted to NMR analysis.
The 1H NMR HRMAS and 1H NMR in solution spectra
were collected with 128 free induction decays (FID), 64 k data points in 8012.8 Hz of spectral width and acquisition time of 4.09 s. The spectra were processed using zero filling
to 64 k points, phased and referenced using TMSP-d4 and
TMS at d 0.00 as an internal reference, respectively. 1H NMR
spectra were used as input variables on the Pirouette 4.0
Software to perform the chemometric analyses.
Chemometric analysis
All the spectral data were converted to the American Standard Code for Information Interchange (ASCII) files and exported for further chemometric analysis by principal component analysis (PCA) and partial least squares
discriminant analysis (PLS-DA), using Pirouette4.0
Software (Infometrix, Inc., Bothell, WA).
The regions of the 1H NMR spectra containing only
noise were removed from chemometric analysis. The
regions between d 0.81-2.3, d 3.15-4.28, d 4.60-4.70,
d 5.19-5.29, d 5.36-5.53, d 6.60-6.80 and d 7.02-7.10
in 1H HRMAS NMR spectra and the regions between
d 0.60-3.33 and d 3.51-8.45 in 1H NMR spectra in solution
were used for statistical analysis.
Results and Discussion
Spectral data for chemometric analysis
Preliminary 1H HRMAS NMR spectra of the sugarcane
samples were acquired either using composite pulse presaturation (CPPR) or Carr-Purcell-Meiboom-Gill (CPMG) pulse sequences in order to become possible a comparison of spectral resolution and sensitivity. The CPMG pulse sequence was tested to evaluate the effect of eliminating the broad signals from macromolecules, which
have a short transverse relaxation time (T2) of the 1H NMR
spectra. The 1H NMR spectra obtained with CPPR shows
similar resolution as those obtained with CPMG, but with bigger signal/noise ratio. Therefore, CPPR pulse sequence was used on all further NMR investigations in order to maximize the sensibility and therefore improving the amount of important information to chemometric analysis.
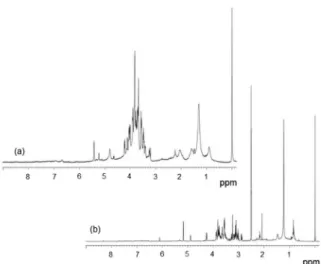
The 1H HRMAS NMR spectra (Figure 1a) acquired
with the CPPR pulse sequence showed signals between
d 0.7 and 7.5 with similar profiles between the sugarcane
cultivars and only few differences in the signal intensities of some components. These similarities are explained by the
intact samples used in the analyses, for which the primary metabolite signals were mainly detected and did not show great variation between the cultivars.
The 1H NMR spectra in solution of the methanolic
extracts (Figure 1b) were obtained with the same CPPR
pulse sequence as in 1H HRMAS NMR. These spectra
showed signals between d 0.35 and 8.40. A great spectral
similarity was found between the sugarcane cultivars. The
1H NMR spectra showed mainly carbohydrate signals due
to the increase in their concentration after extraction. Both
1H NMR spectra (in HRMAS and in solution) essentially
showed carbohydrate signals (Figure 1).
The 1H HRMAS NMR spectra (which were acquired
directly from the powdered leaves, semisolid) and the
1H NMR spectra in solution showed similar spectral
resolution. The use of intact materials is one reason that NMR has been increasingly employed in food analysis. The HRMAS NMR technique can save time in the analysis and reduces sample pretreatment. The pretreatment is commonly performed in other analytical techniques and may cause changes in the chemical composition of the samples.
Chemometric analysis
PCA was performed on the matrix data from the
1H NMR spectra acquired in HRMAS and in solution,
using centred on the mean and first derivative pretreatments. These pretreatments were applied because the sample discrimination was successful.
By using the 1H NMR spectra acquired with both in
HRMAS and in solution, it was possible to distinguish the eight sugarcane cultivars (Figure 2). However, the grouping of replicates was better when the NMR in solution was
employed. Four samples analysed by 1H HRMAS NMR
Figure 1.1H NMR spectra of sugarcane leaves acquired in HRMAS (a) and
showed anomalous (outliers) and were excluded of the PCA method for the subsequent construction of the classification model with the PLS-DA method.
The PCA score plot for the 1H HRMAS NMR data
(Figure 2a) (with 86.26% of the total variance in the first
two principal components) presents the separation of the sugarcane cultivars. Two natural groups were formed in this two-dimensional space: the first group consisted of the RB5054 and RB5453 cultivars on the negative side of the first principal component axis and the second group was formed with the remaining cultivars (RB72454, RB5486, RB5113, RB5156, RB5536 and RB7515) on more positive side of the first principal component and on the centre of the second principal component axes.
The examination of the loadings from the first two principal components suggested the importance of the
sugar signal on the 1H HRMAS NMR spectra in the
discrimination of the sugarcane cultivar. Minor compounds were not relevant. The separation on the first principal component occurs due to the spectral signal situated at
d 5.36-5.53 from sucrose. The assessment of the cultivar
characteristics20 identifies the RB5453 and RB5054 as the
cultivars with the highest sucrose content. The negative loadings of the first principal component corroborated this separation due to the difference in the intensities of the
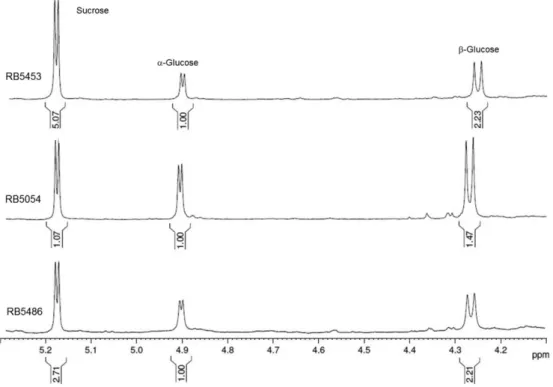
signal at d 5.42, corresponding to the anomeric hydrogen
of sucrose. For RB5453, the sucrose content was more expressive, considering the fact that the ratio of sucrose was 5:1 in comparison to the anomeric hydrogen signals of
glucose (α and β) at d 5.24 and d 4.65 (Figure 3).
On the second principal component, the responsible
loadings were attributed to the signals at d 5.19-5.29 and
d 4.60-4.70 from α- and β-glucose, respectively. A
Figure 2. Score plot from PCA of 1H HRMAS NMR spectra (a) and 1H NMR spectra in solution (b) from leaves of the sugarcane cultivars.
The increment of sucrose and glucose contens is indicated by arrows.
Figure 3. Expansion of the 1H HRMAS NMR spectra showing the anomeric signals from sucrose and glucose for the sugarcane cultivars RB5453, RB5054 and
difference was observed between the anomeric hydrogen signal ratio of sucrose and glucose for the RB5054 cultivar. Both sugar signals were shown in analogous proportions (sucrose:glucose 1:1), corresponding to additional information about these characteristics (Figure 3). Instead of this behaviour, the remaining cultivars (RB72454, RB5486, RB5113, RB5156, RB5536 and RB7515) showed a sucrose:glucose ratio of approximately 3:1, as in RB5486 (Figure 3). However, the sucrose content was considered
high for all the used cultivars in this study.20
From the 1H NMR spectra in solution, the secondary
metabolites were highlighted, considering that these metabolites were found as a major component of a moiety in the extract.
The separation into eight varieties of sugarcane was
obtained from the 1H NMR data in solution, according
to the PCA scores plot (Figure 2b) (with 79.82% of the total variance in the first two principal components). In this case, three groups were formed in two dimensional space: the RB5453 and RB5054 still together in the first principal component, but discriminated in the second principal component and the remaining cultivars (RB72454, RB5156, RB5486, RB5113, RB5536 and RB7515) located on the negative scores of the first principal component. The better distinction between RB5453 and RB5054 in NMR analyses in solution was justified considering the fact that the extraction procedure highlighted the differences about the glucose content in the second principal component axis.
The inspection of the first principal component
loadings from the 1H NMR spectra in solution suggested
that the signal of sucrose at d 5.18 was responsible for the
more positive scores, allocating the RB5453 and RB5054 cultivars according to the prominent signal of sucrose anomeric hydrogen (Figure 4), such as for PCA of the
1H HRMAS NMR spectra.
The assessment of loadings of the second principal
component from 1H NMR data in solution showed the
relevance of the 1H NMR signals at d 4.90 (α-glucose) and
d 4.26 (β-glucose), corresponding to the anomeric
hydrogens of glucose. RB5054 was identified as a cultivar with high glucose content (Figures 2b and 4), as in the
1H HRMAS NMR analysis (Figure 2a). Although RB5453
also showed high sucrose content when NMR data in solution were analysed, the glucose content was lower than RB5054 (Figures 2b and 4). Nevertheless, RB5536 and RB7515 also showed a highlighted amount of glucose when the methanolic extraction procedure was processed before NMR analysis in solution. This was different in
1H HRMAS NMR analysis, for which the samples were
evaluated with a minimal pretreatment (only powdered). The other cultivars were located on the more negative side of the second principal component, what was expected considering the sucrose and glucose contents were observed in an intermediary region, as in RB5486 (Figure 4).
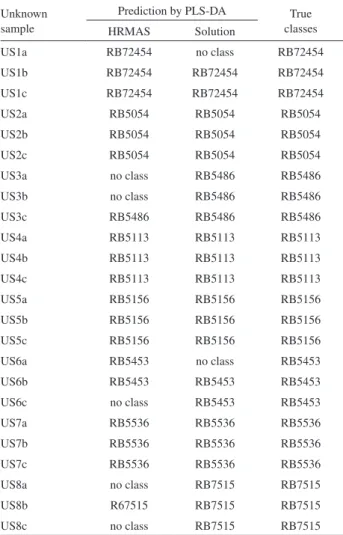
The prediction of the sugarcane cultivars was performed by the PLS-DA. PLS-DA is a partial least squares regression
Figure 4. Expansion of the 1H NMR spectra in solution showing the anomeric signals from sucrose and glucose for the sugarcane cultivars RB5453,
Table 1. Prediction of sugarcane cultivars by the PLS-DA classification models from 1H NMR spectra
Unknown sample
Prediction by PLS-DA True classes HRMAS Solution
US1a RB72454 no class RB72454
US1b RB72454 RB72454 RB72454
US1c RB72454 RB72454 RB72454
US2a RB5054 RB5054 RB5054
US2b RB5054 RB5054 RB5054
US2c RB5054 RB5054 RB5054
US3a no class RB5486 RB5486
US3b no class RB5486 RB5486
US3c RB5486 RB5486 RB5486
US4a RB5113 RB5113 RB5113
US4b RB5113 RB5113 RB5113
US4c RB5113 RB5113 RB5113
US5a RB5156 RB5156 RB5156
US5b RB5156 RB5156 RB5156
US5c RB5156 RB5156 RB5156
US6a RB5453 no class RB5453
US6b RB5453 RB5453 RB5453
US6c no class RB5453 RB5453
US7a RB5536 RB5536 RB5536
US7b RB5536 RB5536 RB5536
US7c RB5536 RB5536 RB5536
US8a no class RB7515 RB7515
US8b R67515 RB7515 RB7515
US8c no class RB7515 RB7515
of a set Yof binary variables describing the categories of a
categorical variable on a set Xof predictor variables. It is
a compromise between the usual discriminant analysis and a discriminant analysis on the significant principal
components of the predictor variables.21
The same preprocessing such as for PCA was applied in
PLS-DA from both 1H HRMAS NMR spectra and 1H NMR
spectra in solution, using the leave-one-out cross validation. The models showed to be robust considering the fact that just one and three samples were predicted as belonging to no class, for the HRMAS NMR and NMR data in solution, respectively.
An external data set with 24 unknown samples for each NMR technique (Table 1) was predicted with both models. The prediction of sugarcane cultivar by using the
1H NMR spectra acquired with HRMAS technique shows
approximately 79.2% hit, while using 1H NMR spectra in
solution a 91.7% hit.
The lesser efficiency of PLS-DA prediction from HRMAS NMR spectra depends dramatically on the sample
insertion inside the HRMAS rotor and its hydration.
When the D2O drops are added and the rotor is closed,
it was possible to perceive the expulsion of part of the sample and water due to hydrophobicity of the sugarcane leaves. Therefore, considering the fact that is very difficulty to prepare the samples for HRMAS NMR analysis with the exactly same conditions, its reproducibility is poor. In consequence, the lower discrimination between the cultivar was observed (Figure 2a) and the prediction from HRMAS NMR spectra was less efficient (Table 1).
Conclusion
1H NMR spectra acquired by HRMAS technique as well
as in solution, in association with chemometric analysis, were able to characterize and discriminate the sugarcane cultivars, mainly by the sugar content. The prediction of sugarcane cultivar from PLS-DA method by using the
1H NMR spectra acquired with HRMAS technique shows
approximately 79.2% hit, while using 1H NMR spectra
in solution 91.7% hit. Although both methods have been useful for the sugarcane cultivar analyses, better results
were achieved by using the 1H NMR spectra in solution
from the extracts of sugarcane leaves due to facility of the sample preparation when compared to HRMAS NMR technique. However, HRMAS method have the advantage of being possible to acquire NMR spectra directly from the leaves without any sample treatment.
Once sugarcane producers might need multiple backgrounds to choose the best varieties for cultivation, such as disease resistance, cultivation and harvest cycles and
hydric stress resistance, among others,22 the information
regarding sugar content provided by the present work can be especially valuable for the selection of the cultivars. The results indicate that NMR and chemometrics are powerful tools for the characterisation of sugarcane cultivars.
Acknowledgements
We thank Conselho Nacional de Desenvolvimento Científico e Tecnológico (CNPq), Fundação de Apoio a Pesquisa do Estado de São Paulo (FAPESP) and Financiadora de Estudos e Projetos (FINEP) for their financial support. We are also grateful to Antonio Tonanni (in memoriam) for supplying the samples.
References
1. Goldemberg, J.; Science2007, 315, 808.
2. Nass, L. L.; Arraes, P. A.; Pereira, D. E.; Crop Sci.2007, 47,
3. Blottnitz, H. V.; Curran, M. A.; J. Cleaner Prod.2007, 15, 607. 4. Macedo, I. C.; Biomass Bioenergy1998, 14, 77.
5. Moreira, J. R.; Goldemberg, J.; Energy Policy1999, 27, 229. 6. Goldemberg, F.; Coelho, S. T.; Nastari, P. M.; Lucon, O.;
Biomass Bioenergy2004, 26, 301.
7. Hazell, P.; Pachauri, R. K.; Overview: Bioenergy and Agriculture - Promises and Challenges. International Food Policy Research Institute; International Food Policy Research
Institute (IFPRI): Washington, DC, 2006, p. 14. 8. Harrison, N. A.; Davis, M. J.; Plant Dis.1986, 70, 556.
9. Wilson, G. L.; Leslie, J. K.; Proc. Aust. Soc. Sugar Cane Technol.1997, 17, 21.
10. RIDESA: Rede Interuniversitária de Desenvolvimento do Setor Sucroalcooleiro; Histórico do RIDESA, http://www.ridesa.com.br/
accessed in October 2009.
11. Larsen, A. L.; Seed World1969, 104, 5.
12. Almeida, M.; Rochelle, L. A.; Crocomo, O.; Sci. Agric. 1995,
52,16.
13. Weljie, A. M.; Newton, J.; Jirik, F. R.; Vogel, H. J.; Anal. Chem.
2008, 80, 8956.
14. Monteiro, M. R.; Ambrozin, A. R. P.; Lião, L. M.; Ferreira, A. G.; Fuel2009, 88, 691.
15. Alcantara, G. B.; Honda, N. K.; Ferreira, M. M. C.; Ferreira, A. G.; Anal. Chim. Acta2007, 595, 3.
16. Schneider, B.; Prog. Nucl. Magn. Reson. Spectrosc.2007, 51, 155.
17. Sacco, A.; Bolsi, I. N.; Massini, R.; Spraul, M.; Humpfer, E.; Ghelli, S.; J. Agric. Food Chem.1998, 46, 4242.
18. Lião, L. M.; Choze, R.; Cavalcante, P. P. A.; Santos, S. C.; Ferri, P. H.; Ferreira, A. G.; Quim. Nova2010, 33, 634.
19. Pirouette® 4.0 Software; Multivariate Data Analysis; Infometrix, Woodinville, 2001.
20. Hoffman, H. P.; Santos, E. G. D.; Bassinello, A. I.; Vieira, M. A. S.; Variedades RB de Cana-de-açúcar; Centro de Ciências
Agrárias/UFSCar: Araras, SP, Brasil, 2008.
21. Pérez-Enciso, M.; Tenenhaus, M.; Hum. Genet.2003, 112, 581.
22. Melo, L. J. O. T.; Oliveira, F. J.; Bastos, G. Q.; Anunciação Filho, C. J.; Reis, O. V.; Bragantia2006, 65, 197.