Article
J. Braz. Chem. Soc., Vol. 26, No. 5, 869-879, 2015. Printed in Brazil - ©2015 Sociedade Brasileira de Química 0103 - 5053 $6.00+0.00
A
*e-mail: [email protected]
Determination of Aldrin Purity Using a Combination of the Mass Balance Approach
and Quantitative NMR
Janaína M. Rodrigues,a Eliane C. P. Rego,a,b Evelyn F. Guimarães,a Marcus V. B.
Sousa,a Tânia M. Monteiro,a Laura A. Neves,a,c Fernando G. M. Violante,*,a Renato R. R.
Almeida,a Maria C. B. Quaresmaa and Raquel Nogueiraa
aNational Institute of Metrology, Quality and Technology (Inmetro), Chemical Metrology Division
(Dquim), Av. Nossa Senhora das Graças, 50, Xerém, 25250-020 Duque de Caxias-RJ, Brazil
bDepartment of Analytical Chemistry, Federal Fluminense University (UFF), Outeiro de São João Batista, s/n,
Campus do Valonguinho, Centro, 24020-141 Niterói-RJ, Brazil
cSchool of Chemistry, Federal University of Rio de Janeiro (UFRJ), Av. Athos da Silveira Ramos, 149,
Bloco E, Ilha do Fundão, 21941-909 Rio de Janeiro-RJ, Brazil
This paper describes the studies performed to determine the purity of aldrin samples, an organochlorine pesticide, using the mass balance approach. The organic impurities were identified and quantified by gas chromatography-mass spectrometry (GC-MS), gas chromatography with flame ionization detection (GC-FID) and gas chromatography with electron capture detector (GC-µECD) using two columns: DB-35ms (intermediate polarity) and DB-XLB (low polarity). The water content was determined by Karl Fischer coulometric titration, and the inorganics were analyzed by inductively coupled plasma mass spectrometry (ICP-MS). The aldrin contents determined by mass balance and quantitative nuclear magnetic resonance (qNMR) were compared. The obtained results were validated through the participation of the National Institute of Metrology, Quality and Technology (Inmetro) in the key-comparison CCQM-K55.b organized by the Organic Analysis Working Group/International Bureau of Weights and Measures (OAWG/BIPM).
Keywords: organochlorine pesticide, analytical quality control, reference standards, gas chromatography (GC), metrology
Introduction
The most commonly used pesticide classes are organochlorines, organophosphorus compounds, carbamates, pyrethroids, and triazines, which are largely employed in intensive agriculture, both in pre-harvest (e.g., as herbicides and insecticides) and pro-harvest stages (e.g., as rodenticides or fungicides).1
Organochlorine pesticides are synthetic chemicals2 that have been used since the Second World War, primarily as insectides.3 Aldrin, dieldrin, and endrin are organochlorines included in the list of twelve chemicals banned under the Stockholm Convention (signed in 2001) for being persistent organic pollutants (POP), which also included chlordane, dichlorodiphenyltrichloroethane (DDT), heptachlor, hexachlorobenzene, mirex, polychlorinated biphenyls (PCBs), polychlorinated dibenzofurans (PCDFs), polychlorinated dibenzo-p-dioxins (PCDDs), and
toxaphene.4 This persistence is typical of organochlorine pesticides, since they are non-volatile, non-polar, highly lipophilic and highly stable substances,1 leading to pesticide accumulation especially in fatty tissues5 and consequent bioaccumulation through the food chain.1,4,6,7
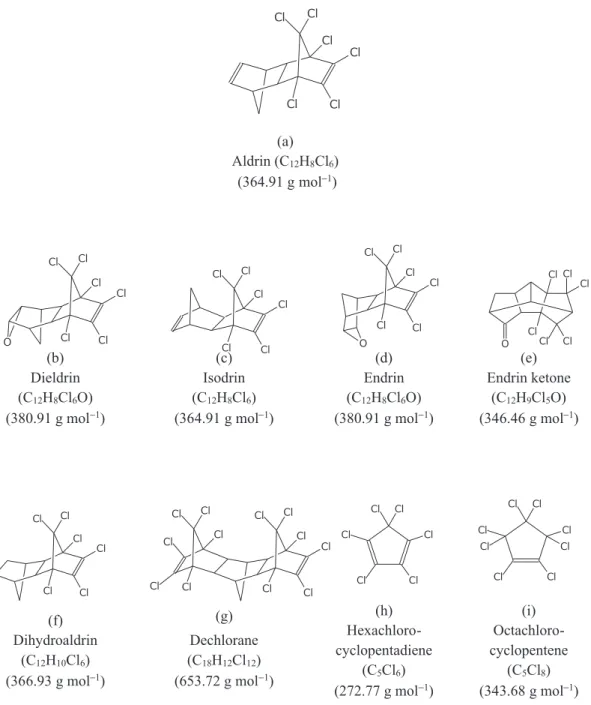
Aldrin (Figure 1a) can be rapidly converted in the environment to its epoxide dieldrin (Figure 1b), which was also used as a broad spectrum insecticide in agriculture and is also persistent in the environment. Both compounds are achiral, but under exposure to natural sunlight may form the chiral compounds photoaldrin and photodieldrin, respectively, which were reported to be more toxic than aldrin and dieldrin.8 Another parent stereoisomer is isodrin (Figure 1c), which in soil may form the epoxide endrin (Figure 1d), in the same manner that aldrin is oxidized to dieldrin.8 Isodrin and dieldrin, as well as other compounds (Figures 1e-i), have been found as impurities in aldrin samples.
the European Comission1,9 and by national regulatory organizations. Therefore, suitable analytical methods and reference materials are required for the analysis of these pesticides in the environment (groundwater and soil),6,7 as well as potentially contaminated agricultural products (fruits and vegetables)9-12 and foods of animal origin.1-13
Considering aldrin physicochemical properties, including its medium structural complexity and low polarity, the International Bureau of Weights and Measures (BIPM), through the Consultative Committee of Amount of Substance/Organic Analysis Working Group (CCQM/OAWG), organized a key-comparison (KC) to demonstrate the capability of National Metrology
Institutes (NMIs) to correctly assess the purity of aldrin samples, in which the National Institute of Metrology, Quality and Technology (Inmetro), Brazil and another eighteen NMIs took part.14
A key role NMI is to establish metrological traceability of measurement results to national or international standards, including the International System of Units (SI), through an unbroken chain of comparisons to stated references, all having stated uncertainties.15-17 Establishing metrological traceability, which is a requirement for accredited laboratories under ISO/IEC 17025:2005,18 ensures the comparability of data “in time and space”.19 The traceability of results from an NMI can be ensured
(a) Aldrin (C12H8Cl6)
(364.91 g mol−1)
(b) Dieldrin (C12H8Cl6O)
(380.91 g mol−1)
(c) Isodrin (C12H8Cl6)
(364.91 g mol−1)
(d) Endrin (C12H8Cl6O)
(380.91 g mol−1)
(e) Endrin ketone
(C12H9Cl5O)
(346.46 g mol−1)
(f) Dihydroaldrin
(C12H10Cl6)
(366.93 g mol−1)
(g)
Dechlorane (C18H12Cl12)
(653.72 g mol−1)
(h) Hexachloro-cyclopentadiene
(C5Cl6)
(272.77 g mol−1)
(i) Octachloro-cyclopentene
(C5Cl8)
(343.68 g mol−1)
Cl Cl
Cl
Cl Cl
Cl
O
Cl Cl
Cl
Cl Cl
Cl
Cl Cl
Cl
Cl Cl
Cl
O O
Cl
Cl Cl
Cl
Cl Cl
Cl Cl
Cl
Cl Cl
Cl
Cl Cl
Cl Cl
Cl Cl
Cl
Cl Cl
Cl
Cl Cl
Cl Cl
Cl Cl
Cl Cl
Cl Cl
Cl Cl
Cl Cl
Cl Cl
Cl Cl
Cl
Cl Cl
Cl
when they have quality assurance systems which include: (i) Calibration of measuring systems,13,20 including the calibration of equipment used for analytical measurements and of analytical balances in case of gravimetric preparation of samples; (ii) Using primary reference measurement procedure,21 e.g., titrimetry and coulometry, which allow to “obtain a measurement result without relation to a measurement standard for a quantity of the same kind”,16 or in other words, do not rely on the use of a standard of the substance under analysis; primary methods are considered a “key issue for ensuring the top of the metrological traceability chain”;22(iii) Using certified reference materials (CRM) for equipment calibration,13,21,22 which can be either high purity substances or substances in matrices, with demonstrated stability and homogeneity, and are accompanied by a certificate declaring the property value, the associated measurement uncertainty, and a statement on how metrological traceability can be guaranteed.16,23 If CRMs are not available, the traceability can be ensured by determining purity of reference materials used for equipment calibration prior to analytical measurements.24 The purity of reference materials can be determined by either direct determination of the principal component amount or by the quantification of the impurity components (mass balance approach);25 (iv) Method validation.26
Furthermore, the participation of NMIs in KCs is essential to demonstrate their technical competence and measurement capability.27-29 KCs may be performed in two designs: (i) samples of known composition are sent to the participant NMIs to check their capability to measure one or more property values with accuracy, or (ii) samples of unknown composition are sent to the NMIs, whose results will be used to estimate a consensus property value and its corresponding expanded uncertainty, which was the scope of the aldrin key comparison (K55b).
NMIs typically undergo peer-reviews on a regular basis, which are auditing procedures carried out by another NMI, which is considered to be in the same hierarchical level (“peer”-institutions). Good performance of NMIs in peer reviews and KCs provide technical basis for the international recognition of their calibration and measurement capabilities (CMCs) by BIPM.
This article describes the purity assessment of aldrin samples performed by Inmetro, Brazil, using the mass balance approach (100% − Σ impurities),27 after determination of the mass fractions of organic, inorganic, and volatile impurities. The result was cross-checked by using the candidate primary measurement method of quantitative nuclear magnetic resonance (qNMR) and validated through the participation of Inmetro in the OAWG/BIPM key-comparison CCQM-K55.b.
Experimental
Samples and reagents
Participating laboratories received two amber sample bottles each containing 500 mg aldrin, a colourless solid, on which to perform the purity assessment. The samples received by Inmetro, shipped from BIPM, were given the unique identifiers OGP.014-100 and OGP.014-132. The mass fraction of aldrin was declared to be larger than 950 mg g−1 (95%),14 and the pesticide was reported to be stable during short-term transport if the temperature did not exceed 37 °C (as indicated by monitoring strips located inside the shipping container) and during long-term storage at 4 °C.14 As soon as the sample bottles were received, they were protected from light using aluminum foil, due to aldrin sensitivity to light, and kept under refrigeration at the recommended temperature. All samples were prepared gravimetrically, as detailed in the following paragraphs, using an AUW 220 D analytical balance (Shimadzu, Tokyo), or a XP 205 (Mettler Toledo, Columbus, Ohio, USA) analytical balance, both with 0.01 mg resolution.
For the gas chromatographic (GC) analysis, the samples were prepared in n-hexane (GC grade, Tedia, Rio de Janeiro, Brazil). In the preparation of samples for inductively coupled plasma mass spectrometry (ICP-MS) analysis, hydrogen peroxide (30% p.a., Merck, São Paulo, Brazil) and concentrated nitric acid (p.a., Merck), distilled under reduced pressure, were used. For the Karl Fischer coulometric titration, a mixture of Hydranal AG Coulomat and Liposolver MH (60:40, v/v) (Sigma Aldrich, St. Louis, USA) was used. For the qNMR analysis, the benzoic acid standard reference material batch 350b (99.9978% ± 0.0044%) (NIST, Gaithersburg, USA) was used as the internal standard and the solutions were prepared in deuterated chloroform (CDCl3) (CIL, Massachusetts, USA).
Gas chromatography analysis
thickness) (Varian); helium flow-rate: 1.6 mL min−1; oven program: 100 °C, first ramped at 25 °C min−1 to 200 °C (not held), followed by a ramp of 3 °C min−1 to 240 °C and held for 4 min; detector temperature: 300 °C; injector temperature: 240 °C; injection volume: 1 µL; splitless mode for 1 min. The aldrin solution (5.78 mg g−1) was injected 7 times.
The gas chromatography with micro-electron capture detector (GC-µECD) experiments were carried out using a 6890N gas chromatography system with a µECD, and a 7683 auto sampler (Agilent Technologies, California, USA). The same chromatographic conditions described for GG-FID were used. The nitrogen make-up gas flow was 60 mL min−1, and the µECD detector temperature was 300 °C for the DB-35ms column and 320 °C for DB-XLB column.
For the gas chromatography-mass spectrometry (GC-MS), a GCMS-QP2010 gas chromatograph mass spectrometer (Shimadzu, Tokyo) was used under the following experimental conditions: column DB-XLB (30 m × 0.32 mm i.d., 0.25 µm); helium flow-rate: 1.6 mL min−1, oven temperature program: 115 °C, increased in 15 min to 320 °C and held for 5 min; injector temperature: 240 °C; injection volume: 1 µL, splitless mode. The mass spectrometer operating conditions were: electron ionization mode; ionizing energy: 70 eV; ion source: 220 °C; detector voltage: 0.2 kV; and detector temperature: 220 °C. Full-scan mass spectra (m/z 100-800) (total ion chromatograms, TIC) were initially recorded and then samples were analyzed in selective ion monitoring (SIM) mode (m/z 362 for aldrin and isodrin, and m/z 378 for dieldrin).
ICP-MS analysis
For analysis of inorganics, an Elan DRC II ICP-MS (Perkin Elmer, Shelton, CT USA) with cyclonic spray chamber and nebulizer (Meinhard, Colorado, USA) was used. The operating conditions were: radio-frequency: 1100 W; air nebulizer gas flow: 0.86 L min−1; scan mode: peak hopping; resolution: 0.7 amu; replicate time: 1 s; dwell time: 50 s; sweeps/reading: 20; integration time: 1000 ms. The equipment was calibrated using a multi-element solution containing 0.010 mg kg−1 of the following metals: Al, Ba, Be, Cd, Ce, Co, Cr, Cu, In, K, Mg, Mn, Na, Pb, Rh, and Zn for preliminary semi-quantitative analysis. The metals with concentrations larger than 0.001 mg kg−1 were quantitatively determined using a 6-level calibration curve in HNO3 5%, ranging from 0.25 to 15 µg kg
−1.
Aldrin samples were prepared as follows: 20 mg samples (triplicate) were weighed in plastic flasks with stopper, 2 mL of 30% H2O2 and 1 mL of concentrated HNO3, distilled under reduced pressure, were added, the
flasks were homogenized in a vortex for 5 min and then heated to 100 °C until the final volume was reduced to 1 mL. A 2% HNO3 solution was added to reach a final mass of 10 g (final concentration: 2 mg g−1).
Karl Fischer analysis
The water content was determined using an 831 Karl Fischer coulometer (Metrohm AG, Bleiche West, Switzerland) equipped with a generator electrode without a diaphragm, a current generator electrode (400 mA) and a platinum indicator electrode (10 µA), connected to a stirrer (728 model, Metrohm), and a controller (774 SC model, Metrohm). The end-point voltage was 80 mV and the results were processed with Tiamo 1.2 software, 2006 version (Metrohm).
Aldrin samples (100 mg each, two replicates) were added directly to the titration chamber containing a mixture of Hydranal AG Coulomat in Liposolver MH (60:40, v/v).
qNMR analysis
The qNMR measurements were performed in a 400 MHz NMR spectrometer (Bruker, Madison, USA). Three solutions were prepared for analysis, using 10 mg of aldrin, 5 mg of benzoic acid (internal standard), and 0.7 mL of CDCl3. The qNMR measurements were performed at 400 MHz according to Saito et al.,30 and each solution was analyzed in duplicate.
The calculation of the aldrin purity (Paldrin) was done according to Webster et al.,31 (equation 1), where, I
A is the absolute area of the main component signal used for quantification, IIS is the absolute area of the IS signal used for quantification, NA is the number of nuclei relative to the signal used for the main component, NIS is the number of nuclei relative to the IS signal, MA is the molar mass of the main component, MIS is the IS molar mass, mA is the weighted mass of sample under investigation, mIS is the IS weighted mass and PIS is the IS purity. The following molar masses were considered: 364.91 g mol−1 for aldrin and 122.12 g mol−1 for benzoic acid.
A IS A IS
aldrin IS
IS A IS A
I N M m
P P
I N M m
= × × × × (1)
Determination of aldrin purity
The aldrin mass fraction (waldrin), expressed in mg g
−1,
was calculated by mass balance according to equation 2.
where Σworg,i, Σwinorg,i and Σwvol,i are the respective sums of mass fractions of organic, inorganic, and volatiles impurities, also expressed in mg g−1. The organic impurities mass fraction was determined by GC-FID (peak area ratio). The inorganic impurities were estimated by ICP-MS, while the water mass fraction was quantified by Karl Fischer coulometric titration.
Estimation of measurement uncertainties
The combined standard uncertainty of the organic impurities mass fraction (uorg) was calculated by the combination of the uncertainties of each organic impurity content (uxi), according to equation 3.
32
i i
N
2 2
org org x x
i 1
u ( / ) u
=
=
∑
∂ ∂ (3)where ∂
org/∂xi is the sensitivity coefficient or partial
differential of the content of organic impurities with respect to each component peak area xi, and corresponds to the uncertainties due to the peak area variance of component xi.
The value of each impurity was estimated from the standard deviation of peak areas in the GC-FID chromatograms (equation 4).
i i
x x
u
=
s /
n
(4)where sxi is the standard deviation of each peak area xi, and n is the number of measurements.
For the inorganic impurity mass fraction, the standard uncertainty (uinorg) was estimated by the combination of uncertainties of each analyzed element. The uncertainties of mass fractions of Br, Cu, and Mg were based on the standard deviation of measurements. For Ba and K, the considered uncertainty sources were the repeatability, the calibration curve, and the standard dilution. The combined standard uncertainty of the water mass fraction (uwater) was estimated from the mass variation of the sample (type B evaluation) and from the standard deviation of n measurements (type A evaluation).
The combined standard uncertainty of aldrin mass fraction (uc) was calculated according to the law of propagation of uncertainties, which consists of the positive square root of the sum of variances or co-variances of the input quantities, corrected by a factor that reflects how the measurement result is affected by changes in these quantities.32 As shown in equation 5, the uncertainties of mass fractions of organic impurities (uorg), inorganic impurities (uinorg) and water content (uwater) were taken into account.
2 2 2
c org inorg water
u = u +u +u (5)
where uorg, uinorg, and uwater are the respective combined standard uncertainties of organic, inorganic, and water mass fractions.
The expanded uncertainty (U), which is the interval that comprises the measurement result and is expected to cover a large range of the values distribution that can be reasonably attributed to the measurand,32 was calculated according to equation 6.
U = uk (6)
where k is the coverage factor (k = 2 for a 95% confidence level).32
Results and Discussion
The following strategy was proposed by the Inmetro team to estimate the aldrin purity: (i) Use of GC-MS for identification of aldrin and its main impurities; (ii) Quantification of organic impurities by GC-FID (estimation of impurity mass fractions from the chromatographic peak areas); (iii) Analysis of inorganic impurities by ICP-MS; (iv) Determination of water content by Karl Fischer coulometric titration; (v) Calculation of aldrin mass fraction by mass balance (equation 2) based on the results for items (ii)-(iv); (vi) Use of GC-ECD as complementary method to detect other possible impurities not detected by GC-FID; (vii) Analysis of aldrin by qNMR and DSC; (viii) Comparison between the mass balance, qNMR, and DSC results.
The use of different analytical methods is recommended to determine the purity of reference materials, in order to obtain metrologically accepted results.25 For purity determination of reference materials in a single laboratory, two possible approaches are presented by the ISO Guide 35:2006:23 (i) use of one primary measurement method, and (ii) combination of two independent reference methods. The two other procedures described by this ISO Guide require a network of laboratories (interlaboratory studies).
GC-MS analysis and profile of aldrin organic impurities
DB-XLB is a low polarity column and the observed elution order of the analytes was as previously reported by Tusa, Moldovan, and Vlassa:33 t
R aldrin < tR isodrin < tR dieldrin < tR endrin (not detected) < tR endrin ketone (identification based on the study of another NMI).
GC-FID analysis
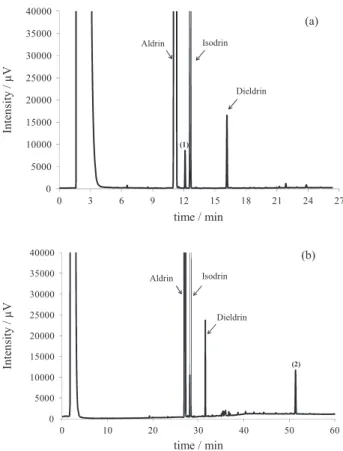
The GC-FID analysis was carried out using two columns of differing polarity: DB-35ms (intermediate polarity) and DB-XLB (low polarity). The chromatograms obtained using the DB-35ms showed nine impurities (Figure 3a), representing a total organic impurity mass fraction of 30.5 mg g−1 based on percent peak area calculation, and resulted in an expanded uncertainty (U) of 0.3 mg g−1. For the second column (DB-XLB), ten impurity peaks were observed (Figure 3b) and a total impurity content of 32.7 ± 1.3 mg g−1 was determined. This second result was considered for the mass balance calculation, since it corresponded to the largest content of detected impurities using the FID. For this calculation, the percent peak area for each impurity were considered equivalent to their percent masses. However, more consistent traceable results expressed in percent masses could be achieved by estimating the uncertainty sources based on the response factors of each purity, once they were identified. This approach has been currently used by Inmetro. The peaks of aldrin, isodrin and dieldrin were identified based on the GC-MS chromatograms by comparing their mass spectrum with the library mass spectral data. According to the results given by another participant NMI,14 the impurity peak between aldrin and isodrin was identified as dihydroaldrin (impurity 1, in Figure 3a), while the late eluting peak (impurity 2, in Figure 3b) was shown to be dechlorane. Blank samples (solvent) were injected along the aldrin samples using the same injection conditions for both columns, and none of the impurities reported were found. The National Institute of Standards and Technology (NIST) (USA) reported a highly representative GC-FID chromatogram of all the
participants, and the same chromatogram profile was obtained by Inmetro using the DB-XLB column.
Very small amounts of endrin ketone, an impurity previously reported by Buser et al.8 to eluted between dieldrin and dechlorane, was also identified by this participant NMI.
GC-ECD analysis
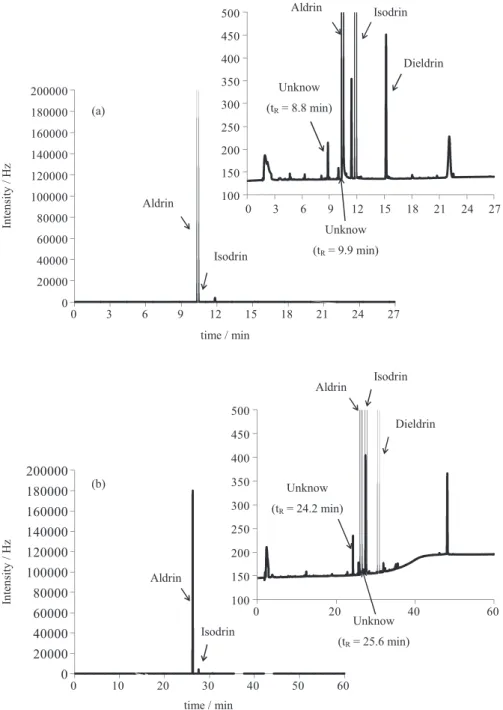
The GC-µECD analysis was carried out in order to detect other potential impurities not detected by GC-FID. The electron capture detector is highly sensitive for halogenated compounds34 and can detect the presence of polyhalogenated compounds, which are expected to give low or no response with the flame ionization detector.
The chromatograms using the DB-35ms (intermediate polarity) and the DB-XLB (low polarity) columns revealed two new impurities not detected by the GC-FID method: tR = 8.8 min (0.045%) and tR = 9.9 min (0.015%) (DB-35ms column) (Figure 4a), as well as tR = 24.2 min (0.031%) and tR = 25.6 min (0.011%) (DB-XLB column) (Figure 4b). Based on the literature reports of possible chlorinated impurities in aldrin samples, these two impurities were supposed to be hexachlorocyclopentadiene (C5Cl6)
-0.4 -0.2 0.0 0.2 0.4 0.6 0.8 1.0 1.2 1.4 1.6 1.8
5 7 9 11 13 15 17 19
TIC
Aldrin
Dieldrin Isodrin
time / min
Inten
si
ty
×
1
0
8
Figure 2. GC-MS chromatogram using a DB-XLB column. 0
5000 10000 15000 20000 25000 30000 35000 40000
0 3 6 9 12 15 18 21 24 27
(1)
0 5000 10000 15000 20000 25000 30000 35000 40000
0 10 20 30 40 50 60
(2)
time / min
time / min
Inten
sity
/ µV
Inten
sity
/ µV
(a)
(b)
Isodrin Aldrin Isodrin
Dieldrin
Dieldrin Aldrin
Figure 3. GC-FID chromatograms using DB-35 ms (a) and DB-XLB (b)
and octachlorocyclopentene (C5Cl8) (Figure1h and 1i). Hexachlorocyclopentadiene is a precursor to several pesticides, and according to the results published by Buser et al.,8 the compound C
5Cl8 should elute before the aldrin peak. These impurities were not detected by GC-FID since there are no C−H groups in their molecules.
Total content of organic impurities (related substances)
The total content of organic impurities in the aldrin samples was 32.7 ± 1.3 mg g−1, for k = 2.2 and 95%
confidence level, based on the GC-FID results described above. The CCQM KC reference value (KCRV) for organic impurities was established as 35.4 mg g−1, u = 0.42 mg g−1, calculated as the mean of all participants.14 The slightly smaller amount of aldrin organic impurities determined by Inmetro may be explained as follows: (i) the two additional impurities observed by GC-ECD were disregarded, considering their small peak percent areas and also the difficulties to correlate their contents to those determined for the other impurities by GC-FID, and (ii) the later eluting impurity, subsequently identified
0 20000 40000 60000 80000 100000 120000 140000 160000 180000 200000
0 3 6 9 12 15 18 21 24 27 100
150 200 250 300 350 400 450 500
0 3 6 9 12 15 18 21 24 27
0 20000 40000 60000 80000 100000 120000 140000 160000 180000 200000
0 10 20 30 40 50 60
100 150 200 250 300 350 400 450 500
0 20 40 60
(a)
time / min
time / min
(b)
Inten
sity
/ Hz
Inten
sity
/ Hz
Aldrin
Isodrin Isodrin
Isodrin
Aldrin Aldrin
Aldrin
Isodrin
Dieldrin Dieldrin
Unknow
(tR= 8.8 min)
Unknow
(tR= 9.9 min)
Unknow
(tR= 24.2 min)
Unknow
(tR= 25.6 min)
Figure 4. GC-ECD chromatograms for DB-35 ms (a) and DB-XLB (b) columns, with corresponding enlargements, showing the peaks of aldrin, isodrin,
as dechlordane, was reported to have a lower relative response factor than aldrin.
Inorganics/non-volatiles
The content of inorganic impurities determined by ICP-MS in aldrin samples, with its corresponding expanded uncertainty U for 95% confidence level and coverage factor k = 2, was 0.0000771 ± 0.0000014 mg g−1. This total content was represented by the following elements, in mg kg−1: Mg: 2.580 ± 0.047, Cu: 4.616 ± 0.092, Br: 63.4 ± 1.3, K: 4.599 ± 0.115, and Ba: 1.900 ± 0.011.
The other NMIs used different methods to determine inorganics, including ICP-MS, inductively coupled plasma/optical emission spectrometry (ICP-OES), thermal gravimetric analysis (TGA), and x-ray fluorescence (XRF). The content of inorganics/non-volatiles was initially considered negligible14 but was later corrected to 11.0 mg g−1 (u = 0.58 mg g−1), due to the presence of an oligomeric organic-based impurity identified by the National Metrology Institute of Japan (NMIJ). Therefore, the majority of the NMIs, which failed to detect this polymer, were rated poorly in their assessment of total inorganics/non-volatile impurities.
Water content and volatiles
Aldrin samples have been investigated at Inmetro regarding their water content. Some techniques were preferably not used: (i) direct addition of solid to the titration chamber, due to the strong lipophilic character of this organochlorine pesticide, which was not expected to dissolve in the hydrophilic titration media, and (ii) oven method, since it usually requires a large sample amount in case of samples with very low water content and also due to aldrin low melting point (104 °C) and decomposition temperature (145 °C). As an alternative, the following technique was used: an emulsifier, Hydranal AG Coulomat in Liposolver MH (60:40, v/v), was added to the titration media prior to the addition of aldrin samples to the titration
chamber. The determined water content and its expanded uncertainty were 0.536 + 0.026 mg g−1, for k = 2 and 95% confidence level. Despite the very close result to the limit of quantification for the Karl Fischer technique, it was considered as over this limit since a good relative standard deviation (3.3%) was achieved.
The KCRV for water content was 0.47 mg g−1 (u = 0.05 mg g−1) and it was calculated as the median of participants results. The other NMIs also used Karl Fischer coulometric titration using (i) direct addition of solid, (ii) direct addition of solution, or (iii) oven method (some institutes cross-checked their results by direct introduction of the sample in the titration chamber).14
It should be remarked that some NMIs were also able to determine volatile organic compounds (VOC) in the samples, namely methanol, using techniques such as GC-MS, headspace GC-MS, and headspace GC-FID. This would be a recommended procedure considering the information provided by the OAWG that aldrin bulk material had been purified by three recrystallizations in methanol and then dried under vacuum at room temperature.14 The KCRV, calculated as the mean of participants results, was 2.30 mg g−1 (u = 0.16 mg g−1). The lack of analysis of volatiles, besides water, in aldrin samples was one of the reasons of the slightly lower mass fraction of volatile impurities determined by Inmetro.
Final mass fraction results determined by mass balance and qNMR
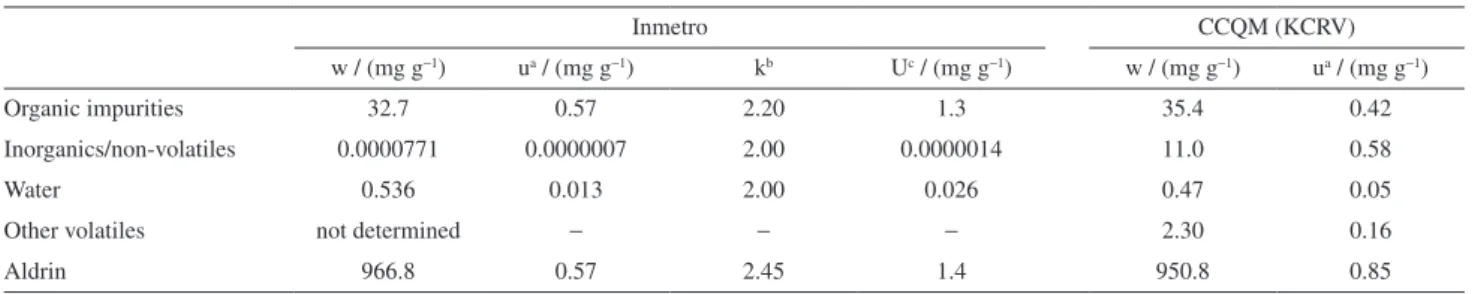
Table 1 summarizes the Inmetro results for impurity mass fractions, which were used for calculation of aldrin purity (mass fraction) according to equation 2, as well as the CCQM KCRV.14
Quantitative nuclear magnetic resonance (qNMR) can be considered as a primary ratio measurement method, which means a method that does not rely on the use of a “measurement standard for a quantity of the same kind”23 and is based on the comparative responses of the analyte to a standard of a different substance. Since the use of primary
Table 1. Summary of impurities mass fractions and purity for aldrin samples by mass balance (Inmetro) and CCQM key-comparison reference values
Inmetro CCQM (KCRV)
w / (mg g−1) ua / (mg g−1) kb Uc / (mg g−1) w / (mg g−1) ua / (mg g−1)
Organic impurities 32.7 0.57 2.20 1.3 35.4 0.42
Inorganics/non-volatiles 0.0000771 0.0000007 2.00 0.0000014 11.0 0.58
Water 0.536 0.013 2.00 0.026 0.47 0.05
Other volatiles not determined − − − 2.30 0.16
Aldrin 966.8 0.57 2.45 1.4 950.8 0.85
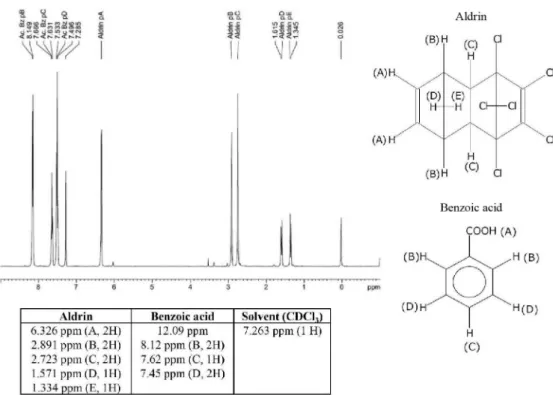
measurement methods is strongly recommended to assess the purity of reference materials according to the ISO Guide 35:2006,231H qNMR analysis was carried out, comparing the peak area of the aldrin olefinic protons against the benzoic acid internal standard (IS) signals.
As it can be seen in Figure 5, the IS resonated at different chemical shifts compared to the aldrin resonances, complying with the requirement to use the qNMR technique. Based on the obtained spectra (Figure 5), the aldrin mass fraction was estimated to be 948.5 mg g−1 with a coefficient of variation (CV) of 2.2%, a smaller value compared to the result obtained by mass balance. Several participant NMIs also determined the aldrin mass fraction by qNMR (besides using the mass balance approach), using not only benzoic acid/d6-dimethyl sulfoxide (DMSO) as IS/solvents, but also benzoic acid/CDCl3, benzoic acid/CD3OD, benzoic acid/CD2Cl2, trioxane/CDCl3, 1,4-dichlorobenzene (DCB)/d6-acetone, dimethyl terephthalate (DMTP)/d6-DMSO, DMTP/CD3OD, DMTP/CDCl3, and chlorpyrifos/CDCl3. The calculations were based on the equivalent olefinic H4- and H5-protons (Figure 1).14 Aldrin was amenable to 1H qNMR by virtue of the fact that these protons are unique to aldrin. The only potential interference could come from the olefinic isodrin protons, which fortuitously resonate upfield at ca. 6.00 ppm, in CDCl3.
The final aldrin mass fraction results from Inmetro and other NMIs are shown in Figure 6. It is possible to identify that, most of the institutes that relied on the mass balance approach, reported aldrin mass fractions around 960 mg g−1,
while those that relied mainly on qNMR results obtained mass fractions around 950 mg g−1. Inmetro was one of a number of institutes that reported both mass balance and qNMR determined purity values. The significant discrepancy observed between the two purity estimates suggested a bias in the mass balance result, which prompted further investigation. Follow up work performed by scientists at NMIJ confirmed the presence of a previously undetected impurity, tentatively assigned as an oligomeric/ polymeric material, and quantified at 10 mg g−1.14 Accordingly, this impurity was considered a component of the inorganics/non-volatiles impurity class and included in the calculation of the KCRV (950.8 ± 1.7 mg g−1) as summarized in Table 1.
Figure 5. 1H qNMR spectra for aldrin in CDCl
3 using benzoic acid as internal standard and expected chemical shifts according to the Spectral Database
for Organic compounds (SDBS).35
940 945 950 955 960 965 970 975 980
INMETR
O
Aldrin mass frac
tion
/ (mg g
−
1)
Participant NMIs
Mass balance qNMR
960 mg g−1
(mass balance)
950 mg g−1
(qNMR) CCQM K.55b key-comparison
Figure 6. CCQM-K55.b key-comparison results for aldrin mass fractions
Conclusions
The purity of aldrin samples (aldrin mass fraction) was determined by Inmetro using two different approaches: (i) mass balance, after determination of organic impurities by GC, inorganic impurities by ICP-MS, and water content by Karl Fischer coulometric titration, and (ii) qNMR, using benzoic acid as the internal standard.
In the CCQM-K55.b KC of OAWG/BIPM, the presence of around 10 mg g−1 of a polymer was proven by the NMIJ, which led to two main groups of NMI results, namely those that were based on the mass balance calculation (960 mg g−1) and those with relied on the qNMR analysis (950 mg g−1). This last result was considered the most accurate after intensive study. Inmetro is included in the group of laboratories that also reported qNMR results and this result was consistent with the final KCRV. However, it is worth mentioning the importance of using both mass balance and qNMR as a vital cross checking for bias in either approach. Demonstrated equivalence in the two purity values will ultimately afford greater confidence in the assigned purity value.36 This paper shows the importance of participation of NMIs in KCs, so that they can compare and improve their measurement capabilities.
Acknowledgments
We are grateful to Francisco G. Neto of the BiomoleculesNMR Laboratory (bioNMR) of the Federal University ofRio de Janeiro (UFRJ) for the qNMR measurements.
References
1. LeDoux, M.; J. Chromatogr. A2011, 1218, 1021.
2. Kataoka, R.; Takagi, K.; Kameli, I.; Kiyota, H.; Sato, Y.;
Environ. Sci. Technol.2010, 44, 6343.
3. Fromberg, A.; Granby, K.; Hojgard, A.; Fagt, S.; Larsen, J. C.;
Food Chem.2011, 123, 1179.
4. Paterson, D. G. Jr.; Wong, L.; Turner, W. E.; Caudill, S. P.; Dipietro, E. S.; McClure, P. C.; Cash, T. P.; Osterloh, J. D.; Pirkle, J. L.; Sampson, E. J.; Needham, L. L.; Environ. Sci. Technol.2009, 43, 1211.
5. Zadora, M. S.; Grochowalski, A.; Food Chem.2008, 111, 230. 6. Chopra, A. K.; Sharma, M. K.; Chamoli, S.; Environ. Monit.
Assess.2011, 173, 905.
7. Rashid, A.; Nawaz, S.; Barker, H.; Ahmad, I.; Ashraf, M.;
J. Chromatogr. A2010, 1217, 2933.
8. Buser, H. R.; Mueller, M. D.; Buerge, I. J.; Poiger, T.; J. Agric. Food Chem.2009, 57, 7445.
9. Furlani, R. P. Z.; Marcilio, K. M.; Leme, F. M.; Tfouni, S. A. V.;
Food Chem.2011, 126, 1283.
10. Satpathy, G.; Tyagy, Y. K.; Gupta, R. K.; Food Chem.2011,
127, 1300.
11. Yang, X.; Zhang, H.; Liu, Y.; Wang, J.; Zhang, Y. C.; Dong, A. J.; Zhao, H. T.; Sun, C. H.; Cui, J.; Food Chem.2011, 127, 855.
12. Guan, H.; Brewer, W. E.; Garris, S. T.; Morgan, S. L.;
J. Chromatogr. A2010, 1217, 1867.
13. Silva, R. J. N. B.; Camões, M. F. G. F. C.; Accredit. Qual. Assur.
2010, 15, 691.
14. Westwood, S.; Josephs, R.; Choteau, T.; Daireaux, A.; Mesquida, C.; Wielgosz, R.; Rosso, A.; Arechavaleta, M. R.; Davies, S.; Wang, H.; Rego, E. C. P.; Rodrigues, J. M.; Guimarães, E. F.; Sousa, M. V. B.; Monteiro, T. M.; Valente, L. A. N.; Violante, F. G. M.; Almeida, R. R. R.; Quaresma, M. C. B.; Nogueira, R.; Windust, A.; Dai, X.; Li, X.; Zhang, W.; Li, M.; Shao, M.; Wei, C.; Wong, S-k.; Cabillic, J.; Gantois, F.; Philipp, R.; Pfeifer, D.; Hein, S.; Klyk-Seitz, U-A.; Ishikawa, K.; Castro, E.; Gonzalez, N.; Krylov, A.; Lin, T. T.; Kooi, L. T.; Fernandes-Whaley, M.; Prévoo, D.; Archer, M.; Visser, R.; Nlhapo, N.; Vos, B.; Ahn, S.; Pookrod, P.; Wiangnon, K.; Sudsiri, N.; Muaksang, K.; Cherdchu, C.; Gören, A. C.; Bilsel, M.; LeGoff, T.; Bearden, D.; Bedner, M.; Duewer, D.; Hancock, D.; Lang, B.; Lippa, K.; Schantz, M.; Sieber, J.; Metrologia 2012, 49, 08014.
15. Drnovsek, J.; Accredit. Qual. Assur.2008, 13, 321.
16. Joint Committee for Guides in Metrology (JCGM); International Vocabulary of Metrology, Basic and General Concepts and Associated Terms (VIM), 3rd ed., JCGM 200:2012. Available
at http://www.bipm.org/en/publications/guides/vim.html accessed in February 2015.
17. Eurachem Citac Guide, Quantifying Uncertainty in Analytical Measurement, 3rd ed.; 2012. Available at https://www. eurachem.org/images/stories/Guides/pdf/QUAM2012_P1.pdf accessed on February 2015.
18. ABNT NBR ISO/IEC 17025: Requisitos Gerais para Competência de Laboratórios de Ensaio e Calibração, ABNT: Rio de Janeiro, 2005.
19. Koeber, R.; Linsinger, T. P. J.; Emons, H.; Accredit. Qual. Assur.
2010, 15, 255.
20. Bich, W.; Accredit. Qual. Assur.2009, 14, 581.
21. Sega, M.; Meane, E. A.; Rolle, F.; Accredit. Qual. Assur.2009,
14, 601.
22. Priel, M.; Amarouche, S.; Fisicaro, P.; Accredit. Qual. Assur.
2009, 14, 593.
23. ISO Guide 35: Reference Materials, General and Statistical Principles for Certification, ISO: Switzerland, 2006. 24. Wong, S. K.; Accredit. Qual. Assur.2010, 15, 337.
Traceable Assessment of the Chemical Purity of Organic Reference Materials, National Institute of Standards and Technology Special Publication 1012; NIST: Gaithersburg, 2004.
26. Lamberty, A.; Emons, H.; Accredit. Qual. Assur.2010, 15, 647.
27. Yip, Y.; Wong, S.; Choi, S.; TrAC, Trends Anal. Chem.2011,
30, 628.
28. Scharf, H.; Becker, R.; Bremser, W.; Accredit. Qual. Assur.
2010, 15, 613.
29. Recknagel, S.; Noack, S.; Steiger, T.; Kipphardt, H.; Matschat, R.; Accredit. Qual. Assur.2010, 15, 401.
30. Saito, T.; Ihara, R.; Koike, M.; Kinugasa, S.; Fujimine, Y.; Nose, K.; Hirai, T.; Accredit. Qual. Assur.2009, 14, 79. 31. Webster, G. K.; Marsden, I.; Pommerening, C. A.; Tyrakowski,
C. M.; Appl. Spectrosc.2010, 64, 537.
32. Joint Committee for Guides in Metrology (JCGM); Evaluation of Measurement Data - Guide to the Expression of Uncertainty in Measurement, JCGM 100:2008. Available at http://www. bipm.org/en/publications/guides/gum.html accessed in February 2015.
33. Tusa, F.; Moldovan, Z.; Vlassa, M.; J. Phys.: Conf. Ser.2009,
182, 1.
34. Muscalu, A. M.; Reiner, E. J.; Liss, N. L.; Chen, T.; Int. J. Environ. Anal. Chem.2010, 90, 1.
35. Spectral database for organic compounds (SDBS); http:// riodb01.ibase.aist.go.jp/sdbs/cgi-bin/direct_frame_top.cgi accessed in January 2014.
36. Davies, S. R.; Jones, K.; Goldys, A.; Alamgir, M.; Chan, B. K. H.; Elgindy, C.; Mitchell, P. S. R.; Tarrant, G. T.; Krishnaswami, M. R.; Luo, Y. W.; Moawad, M.; Lawes, D.; Hook, J. M.; Anal. Bioanal. Chem.2014, DOI: 10.1007/ s00216-014-7893-6. http://link.springer.com/article/10.1007 %2Fs00216-014-7893-6 accessed in February 2015.