Quim. Nova, Vol. 34, No. 4, 607-609, 2011
Artigo
*e-mail: [email protected]
DETERMINATION OF TRACES OF NITRATE IN WATER SAMPLES USING SPECTROPHOTOMETRIC METHOD AFTER ITS PRECONCENTRATION ON MICROCRYSTALLINE NAPHTHALENE
Mohammad Reza Baezzat* and Golabatoon Parsaeian
Fars Technological and Environmental Research Center, Shiraz, Iran Mohammad Ali Zare
Chemistry Department, Islamic Azad University, Firoozabad Branch, Firoozabad, Iran
Recebido em 18/5/10; aceito em 2/11/10; publicado na web em 14/2/11
Nitrate is quantitatively retained with 2,6-bis(4-methoxyphenyl)-4-phenyl pyrylium perchlorate (PPP) on microcrystalline naphthalene in the pH range of 6.5-9.0 from a large volume of aqueous solutions of various samples. The method was based on the complexation between PPP and nitrate and then, extraction of the resulted complex from aqueous solution by microcrystalline naphthalene. The solid mass consisting of the nitrate complex and naphthalene was then dissolved in dimethyl formamide (DMF) and absorption of the resulted solution was obtained at 328 nm. The linear calibration range for the determination of nitrate was 15-135 μg L-1 with
the detection limit of 10 μg L-1.
Keywords: preconcentration; microcrystalline naphthalene; spectrophotometry.
INTRODUCTION
Nitrate is commonly monitored for environmental protection purposes in agricultural, food controls, the control of multiple uses of water and also in checks its potability. Owing to the formation of carcinogenic N-nitrosaminesand being also essential to indicate or-ganic pollution in water, the determination of the exact concentration of nitrate is desirable. In recent years, an increasing interest in the determination of nitrate levels in food products has been observed, essentially due to the potential reduction of nitrate to nitrite, which is known to have adverse effects on human and animal health. Nitrate is intermediate states in the nitrogen cycle, and the high concentration of nitrite in water generally indicates poor quality. Presently, nitrate can be quantiied in plasma, serum and urine samples by various methods based on different analytical principles.1 These methods have
produ-ced diverging values of nitrate in the circulation of healthy humans. This variation can only partially be explained by differences in dietary intake of these compounds. The major reason for the discrepancies seems to be methodological problems.2 A stable metabolite of NO
is nitrate and it is generally accepted as an indicator of NO. This indirect measurement is generally used because NO has a very short half-life in biological systems.3 Most studies of NO concentrations
from vitreous samples are conducted by detection of nitrate using the Griess reaction.4 Nitric oxide (NO) partly autooxidizes to nitrite
(NO2
-), whereas by far the major endogenous and exogenous sources
fraction of NO is oxidized to nitrate (NO3-) within the erythrocytes by
oxyhemoglobin (HbFe(II)O2). Nitrate levels from vitreous samples
are quantiied by the chemical reduction of nitrate to nitrite, and then the reaction of nitrite with the Griess reagents produces a purple azo dye which can be measured at 540 nm.5
Many spectrophotometric methods are available for the determi-nation of nitrate.6-8 Extensive use has been made of diazotization and
coupling reaction after reduction of nitrate to nitrite,9 copper-coated
cadmium metal10 and titanium (III) chloride11 have been used.
Ho-wever, reduction should not proceed beyond nitrite. Reduction of nitrate to nitrite and the catalytic effect of nitrite on the oxidation of Naphtol Green B by bromate,12 or reduction to nitric oxid and
chemi-luminescence detection by reaction with ozone13 have also been used.
Among the various methods in preconcentration and determi-nation, solid-phase extraction has received more acceptances due to its simplicity, rapidity and attainability of large preconcentration factor. A variety of solid materials such as modiied ion exchange resins,14 functionalized resins with chelating reagents,15 modiied
nanometer-sized alumina,16 thermal modiied Kaolinite,17 activated
carbon,18 zeolites,19 cellulose,20 and immobilized microorganisms
on sepiolite21 have been used for preconcentration of trace metals.
Microcrystalline naphthalene22 and benzophenone23 have also been
used as solid phase for adsorptive extraction of metal ion complexes. In this work, solid phase extraction with microcrystalline na-phthalene is proposed. The method is based on the distribution of the complex of nitrate and 2,6-bis(4-methoxyphenyl)-4-phenyl pyrylium perchlorate (PPP) between the solid and liquid phases under selected experimental conditions. The adsorbed complex on microcrystalline naphthalene is easily dissolved with a suitable organic solvent such as dimethylformamide (DMF) and determined by spectrophotometry. The proposed method is rapid sensitive and cheap.
EXPERIMENTAL
Apparatus and reagents
A Perkin Elmer model lambda 45 (UV/Vis) spectrophotometer with a 1.0 cm quartz cell was used for absorbance measurement at a ixed wavelength. A Metrohm pH meter 691 was employed for pH measurements. All glassware was washed with a mixture of concen-trated sulfuric and nitric acid (1:1) before use. All the reagents were of analytical reagent grade and were used without further puriication. The standard stock solution of nitrate (1000 mg L-1) was prepared by
dissolving 0.0137 g of NaNO3 (Merck) in water in 100 mL
Baezzat et al.
608 Quim. Nova
of the standard solution used in the calibration curves and in the standard additions method were obtained by subsequent dilution of the stock solutions. A 1.0 x 10⁻³ M solution of PPP was prepared by
dissolving 0.0468 g of PPP in 100 mL of acetone.Buffer solutions of pH 6-10 were prepared by mixing soda, phosphoric acid and boric acid solution. A 20% solution (w/v) of naphthalene was prepared by dissolving 20.0 g of naphthalene in a 100 mL volumetric lask. General procedure
An aliquot of nitrate solution (containing 15.0-135.0 μg L-1) was
placed in a conical lask itted with a ground glass stopper. The pH was adjusted to ca. 9.0 with 2.0 mL of the buffer solution. The solution was diluted to 250 mL with water, and 4.0 mL of 1.0 x 10⁻³ M PPP
was added. The solution was mixed well and was allowed to rest for 5 min; later 5.0 mL of a 20% naphthalene solution in acetone was added with continuous shaking. The formed solid mass, consisting of naphthalene and the metal complex was separated by iltration on a glass ilter. The residue was washed with water and then dried in the fold of ilter glass. The solid mass was dissolved in DMF and came up to volume with the same solvent in 5.0 mL volumetric lask. The absorbance of the complex was measured at 328.0 nm.
RESULTS AND DISCUSSION
Optimization of the experimental conditions
Optimization of conditions for complex formation
For obtaining the optimum condition in the formation of complex between NO3
- and PPP, the amount of PPP, time required to form a
stable complex and the pH of the solution is investigated. Optimization of pH of solution
The effect of pH on recovery of nitrate was examined (Figure 1). The adsorption of nitrate complex on the microcrystalline naphthalene was found to be maximal in the pH range of 6.5-9.0. In subsequent studies, the optimum pH of 9.0 was selected.
Optimization of PPP concentration
The effect of PPP concentration on the recovery of nitrate was investigated in the range of 1.0 x 10⁻⁴ – 5.0 x 10⁻² M in its acetone
solution. Therefore, 3.0 x 10⁻³ M of PPP was selected for subsequent
experiments as an optimum amount. Optimization of stirring time
The effect of stirring timerequired to form a stable complex was also studied. The effect of stirring time on the recovery of nitrate was investigated in the range of 1-10 min. 2 min was selected as optimum stirring time and used in subsequent studies.
Optimization of conditions for extraction
Optimization naphthalene amount
In order to nitrate-PPP complex to be adsorbed quantitatively, the amount of naphthalene must be chosen carefully. Various amounts of naphthalene in the range of 5-25% was added to the sample solutions, keeping other variables constant. It was observed that the absorbance increased as naphthalene amount increased and remained constant after 20% of naphthalene. Therefore, 20% naphthalene was used in subsequent studies as optimum amount.
Stirring time and rest time
Effect of stirring time and rest time was also studied. For stu-dying the effect of stirring time, the absorbance of extracted nitrate was studied and compared. The stirring time was varied from 2-16 min (Figure 2). As it is clear, after about 8 min, the higher amounts of complex are extracted. 10 min was selected as optimum stirring time and used in subsequent studies.
To investigate the effect of rest time, after the extraction of complex into microcrystalline naphthalene, it was allowed to rest at room temperature from 1 to 10 min. The results showed that the nitrate-PPP complex can be absorbed very fast by microcrystalline naphthalene even at room temperature in few minutes. Resting time of 3 min was selected as optimum value.
Selection of solvent and the solvent volume and extraction time A number of solvents were examined to dissolve the complex contained in the naphthalene. It should be mentioned that to obtain the higher preconcentration eficiency, it is essential to dissolve the solid mass i.e. naphthalene containing complex in a small volume of solvent. In addition, the selection of solvent type is also essential to dissolve the solid mass as much as possible. So, various solvents were tested. The solid mass was soluble and stable in dimethlsul-foxide (DMSO), dimethylformamide (DMF), acentonitrile and methylisobutylketones (MIBK), but it was not soluble in n-hexane, iso-methylalcohol and ethylacetate. Among these solvents, DMF was chosen, because the complex had highest apparent molar absorptivity at 328.0 nm. It was found that 4.0-7.0 mL of the selected solvent was suficient to dissolve the solid mass. So, 5.0 mL of the selected solvent was chosen as optimum amount of solvent
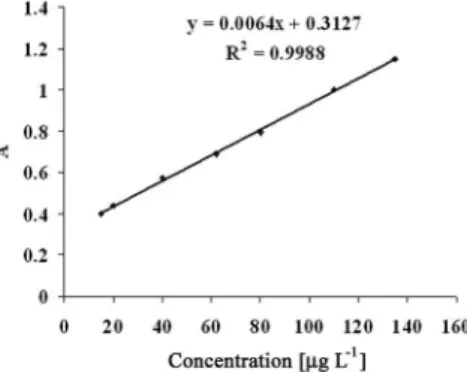
Analytical igures of merit
The calibration curve for the determination of nitrate was prepared according to the general batch procedure under the optimum conditions developed above described (Figure 3). The linearity was obtained in the range of 15-135 μg L-1 of nitrate with a correlation coeficient of
0.9988. The detection limit of the proposed method (calculated as 3σ)
Figure 1. Optimization of pH on the absorption of nitrate, at λmax= 328.0 nm,
[NO3
-] =50 μg L-1, [2,6-bis(4-methoxyphenyl)-4-phenyl pyrylium perchlorate
(PPP)]=1.0 x 10⁻³ M, stirring time = 10 min, in solvent DMF
Figure 2. Optimization of stirring time, at λ
max = 328.0 nm, [NO3
-] = 50 μg
L-1, [2,6-bis (4-methoxyphenyl)-4-phenyl pyrylium perchlorate (PPP)] = 1.0
Determination of traces of nitrate in water samples 609 Vol. 34, No. 4
was obtained to be 10 μg L-1. The relative standard deviation of nitrate
determination (50 μgL-1) was found to be 2.1% (n=5).
Interference studies
Various ions were added to the solution containing 50 μg L-1 of
nitrate and the general batch procedure was applied. The tolerance limit was set as the concentration required to cause ± 5% error in the determi-nation of nitrate. The results obtained are given in Table 1. Among the anions studied, many did not interfere even at more than 300 times of nitrate. Ions such as sulide, carbonate and nitrite interfered at more than 20 times of nitrate. However, the interference of sulide and carbonate can be omitted by the addition of an acid (such as acetic acid, pH 4). So, the proposed method can be applied for determination of nitrate in water samples containing the studied ions in reported concentrations.
Real sample analysis
The method was applied to determine nitrate in certain sample of river water and drinking water. All water samples were iltered through an 0.45 μm membrane ilter prior to analysis. The results are reasonably in good agreement with those added to samples. Table 2 shows the results.
CONCLUSION
Extraction of nitrate was done by liquid-solid extraction system
using microcrystalline naphthalene as an extractor. The method descri-bed in this paper allows for the rapid, precise and reliable determination of nitrate in water samples. The main beneits of the procedure are the enhanced sensitivity of the spectrophotometric method, rejection of ma-trix constituents, low cost, fairly easy operation and speed of analysis. The lower (improved) detection limit of the proposed method for nitrate determination allows us to use this simple, precise and sensitive method for the determination of nitrate in its very low levels in water samples. ACKNOWLEDGEMENT
The authors express their appreciation to the Islamic Azad Uni-versity, Firooz Abad Branch research council for inancial support of this work.
REFERENCES
1. Romitelli, F.; Santini, S.; Chierici, E.; Pitocco, D.; Tavazzi, B.; Amorini, A. M.; Lazzarino, G.; Stasio, E. D.; J. Chromatogr., B: Anal. Technol. Biomed. Life Sci. 2007, 851, 257.
2. Tsikas, D.; Free Radical Res. 2005, 39, 797.
3. Thomas, D. D.; Liu, X.; Kantrow, S. P.; Lancaster, J. R.; Proc.Natl. Acad. Sci. U. S. A. 2001, 98, 355.
4. Hernandez, C.; Lecube, A.; Segura, R. M.; Sararolst, L.; Simo, R.; Diabetic Medicine 2002, 19, 655.
5. Pulido, L. J. S.; Hatield, R. M.; Dundervill III, R. F.; McCannel, C. A.; Shippy, S. A.; J. Chromatogr., B: Anal. Technol. Biomed. Life Sci. 2007, 847, 300.
6. Tu, X.; Xiao, B.; Xiong, J.; Chen, X.; Talanta 2010, 82, 976. 7. Pasquali, C. E. L.; Hernando, P. F.; Alegria, J. S. D.; Anal. Chim. Acta
2007, 600, 177.
8. Pasquali, C. E. L.; Gallego-Pico, A.; Hernando, P. F.; Velasco, M.; Alegria, J. S. D.; Microchem. J. 2010, 94, 79.
9. Gardolinski, P. C. F. C.; David, A. R. J.; Worsfold, P. J.; Talanta 2002, 58, 1015.
10. Horita, K.; Wang, G. F.; Satake, M.; Analyst 1997, 122, 1568. 11. Al-Wahid, A.; Townshend, A.; Anal. Chim. Acta 1986, 186, 289. 12. Qi, Z. Z.; Jun, G. L.; Ying, Z. H.; Guang, L. Q.; Anal. Chim. Acta 1998,
370, 59.
13. Aoki, T.; Wakabayashi, M.; Anal. Chim. Acta 1995, 308, 308. 14. Yebra, M. C.; Salgado, J.; Ouig, L.; Moreno-Cid, A.; Anal. Bioanal.
Chem. 2002, 374, 530.
15. Chang, H. J.; Sung, Y. U. H.; Huang, D. Sh.; Analyst 1999, 124, 1695. 16. Pu, X. L.; Jang, Z. C.; Hu, B.; Wang, H. B.; J. Anal. At. Spectrom. 2004,
19, 984.
17. Afzali, D.; Taher, M. A.; Mostafavi, A.; Mobarakeh, S. Z. M.; Talanta 2005, 65, 476.
18. Cerutti, S.; Silva, M. F.; G´asquez, J. A.; Olsina, R. A.; Martinez, L. D.; Spectrochim. Acta, Part B 2003, 58. 43.
19. Pena, Y. P. D.; Lopez, W.; Burguera, J. L.; Burguera, M.; Gallignani, M.; Brunetto, R.; Carrero, P.; Rondon, C.; Imbert, F.; Anal. Chim. Acta 2000, 403, 249.
20. Zih-Perenyi, K.; Lasztity, A.; Horvath, Z.; Levai, A.; Talanta 1998, 47, 673.
21. Bag, H.; Rehber Türker, A.; Lale, M.; Talanta 2000, 51, 1035. 22. Shabani, A. M. H.; Dadfarnia, S.; Nasirizadeh, N.; Anal. Bioanal. Chem.
2004, 378, 1388.
23. Thorburn Burns, D.; Tungkananuruk, N.; Thuwasin, S.; Anal. Chim. Acta 2000, 419, 41.
24. Greenberg, A.; Standard Methods for the Examination of Water and Waste Water, 2005, 4500-NO3
-B.
Table 1. Tolerance limit of the method for interference studied. The NO3
-concentration in samples was 50 μg L-1
Interference X
Tolerance limit (ratio) X/NO3
-CO3 2- , NO
2
-, S2- 20
PO4
3-, SCN- 60
BiO3
-, I-, Cl- 100
IO3 -, SO
3 2-, C
2O4 2-, SO
4 2-, ClO
4
- 300a
a Higher amount tested.
Table 2. Determination of nitrate in water samples
Sample [NO3 -] a
[μg L-1]
Added [μg L-1]
Found b
[μg L-1]
Recovery % River water A 860 ± 12 100 103 ± 2 103 River water B 742 ± 10 80 75 ± 1 93 Drinking water C 196 ± 6 23 25 ± 1 109
a Determination of nitrate by conventional spectrophotometric method.24 b Average of 5 determination ± standard deviation.
Figure 3. Calibration curve for the determination of nitrate, at λ
max = 328.0