http://dx.doi.org/10.1590/s2175-97902017000216064
A
r
*Correspondence: P.H.R. Silva. Faculdade de Farmácia. Universidade Federal de Minas Gerais - 31270-901– Belo Horizonte, MG, Brasil. Phone: + 55-31-34096957. Fax: +55-31-34096976. E-mail: [email protected]
An innovative, simple, fast, and less toxic high-performance liquid
chromatographic method for determination of prednisone in
capsules
Pedro Henrique Reis da Silva
*,1, Paula Cristina Rezende Enéas
2, Christian Fernandes
1,
Gerson Antônio Pianetti
11Department of Pharmaceutical Products, Faculty of Pharmacy, Federal University of Minas Gerais, Belo Horizonte, MG,
Brazil, 2René Rachou Research Center, Oswaldo Cruz Foundation, Belo Horizonte, MG, Brazil
Prednisone is an anti-inlammatory steroid drug widely used in clinical practice. However, no high-performance liquid chromatographic (HPLC) method has been described in the literature for the determination of prednisone in capsules until now. Thus, an HPLC method was developed using a C18 (250x4.0, 5 µm) column, with methanol:water (70:30) as mobile phase at a low rate of 1 mL/min and detection at 240 nm. The developed method was validated following current Brazilian legislation. Additionally, linearity was assessed by evaluating the assumptions of normality, homoscedasticity, and independency of residuals, and the it to the linear model. The method showed linearity (r2>0.99) over the range of 14.0-26.0 µg/mL, selectivity, precision (RSD<2.0%), robustness, and accuracy (average recovery of 100.05%). The chromatographic procedure was applied for assay and uniformity content determination of three diferent batches of prednisone capsules, showing to be suitable for their quality control.
Uniterms: Prednisone. Capsules. High performance liquid chromatography/validation. Linearity
assessment.
INTRODUCTION
Anti-inlammatory drugs have been widely used in clinical practice due to their ability to suppress inlammation signs and symptoms and also to exert a strong antipyretic and analgesic efect (Rang et al., 2007; Goodman et al., 2010). Anti-inflammatory drugs may be classified as non-steroidal drugs (NSAIDs) and steroids, the latter also referred to as corticosteroids (Gilroy et al., 2003).
Corticosteroids are naturally produced by the adrenal cortex and are involved in carbohydrate metabolism regulation and electrolyte balance. Also, they present anti-inlammatory and immunosuppressive properties (Laan, Jansen, Van Riel, 1999; Goodman et al.,, 2010).
While presenting a slower onset of action compared to NSAIDs, steroids have therapeutic advantages such as less interference in hemostasis and lower incidence
of gastrointestinal disorders. Moreover, they possess considerably higher anti-inlammatory activity and a more favorable cost-efectiveness ratio (Rodrigues et al., 2008).
Prednisone, a glucocorticoid, is a potent synthetic anti-inlammatory drug widely used in clinical practice for the treatment of inlammatory and autoimmune diseases. Prednisone is a prodrug extensively converted in vivo to its active form, prednisolone, through hepatic metabolism (Sagcal-Gironella et al., 2011).
Analytical methods for determination of prednisone content in tablets and active pharmaceutical ingredients (APIs), but not for capsules, have been published in the literature. Barancelli and Ferreira (2007) have analyzed prednisone in capsules by means of a spectrophotometric method as described in the monograph of prednisone tablets in the Brazilian Pharmacopeia (Farmacopeia Brasileira, 2010). It is known that spectrophotometric methods may not be selective. Excipients used in the formulation may be absorbed in the same wavelength as that of the drug, which limits its use. A high-performance liquid chromatographic method is described in the Brazilian Pharmacopeia for the assay of prednisone API. However, the use of tetrahydrofuran in the mobile phase limits its use, since this solvent has a cut-of at high wavelengths, is toxic, and is unstable due to the formation of peroxides when it is exposed to the air.
In this context, this study describes the development and validation of a liquid chromatographic method to determine prednisone in capsules. Validation was performed according to current Brazilian legislation. Additionally, the assumptions for a linear regression model were evaluated. The developed method was applied for the assay and content uniformity determination of three batches of prednisone capsules.
MATERIAL AND METHODS
Reagents
Prednisone reference standard (99.5% purity) was obtained from the United States Pharmacopeia (Rockville, USA) (Figure 1). Methanol HPLC grade was from J. T. Baker (Xalostoc, Mexico), and sulfuric acid and ethanol analytical grade were from Sigma-Aldrich (Saint Louis, USA). Water used for preparing all solutions and samples was purified in a Direct-Q 3 System from Millipore (Bedford, USA).
Capsules of gelatin containing 20 mg of prednisone in three different formulations, prepared by three compound pharmacies with undisclosed origin, were used. Samples of prednisone API as well as a mixture of the excipients (placebo) have also been provided. The composition of each batch and the role of each excipient are presented in Table I.
Apparatus and chromatographic conditions
Chromatography was carried out using an HPLC system (Agilent 1200 Infinity Quaternary LC system) coupled with a diode-array detector (Agilent 1200 Infinity, G DAD). Chromatographic separation was accomplished in a Zorbax C18 (250 x 4.0 mm, 5.0 µm) column from Agilent Technologies (Santa Clara, USA). The experiments were performed at room temperature (25 ºC) with a mobile phase consisting of methanol:water (70:30, v/v) at a low-rate of 1.0 mL/min. The injection volume was 20 µL and detection was at 240 nm. The mobile phase was filtered at 0.45 µm membrane and degassed prior to use.
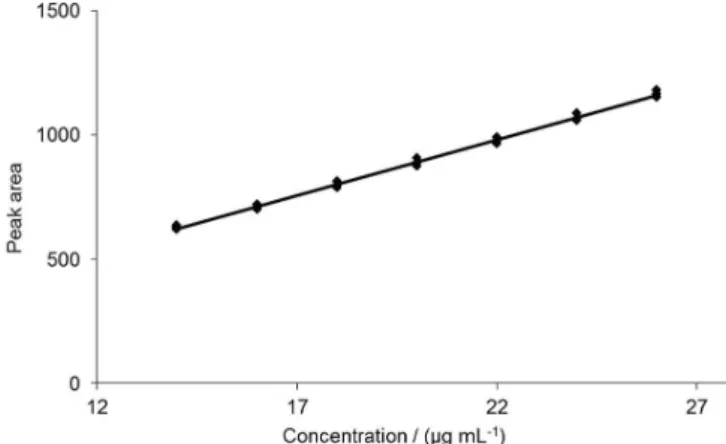
Linearity and range
Linearity was assessed from three analytical curves for prednisone reference standard solutions in the concentrations of 14.0, 16.0, 18.0, 20.0, 22.0, 24.0, and
FIGURE 1 - Chemical structure of prednisone.
TABLE I - Composition of batches A, B, and C
Excipients Batches (%) Role
A B C
Colloidal silicon dioxide 0.5 1.0 4.2 Glidant
Sodium lauryl sulfate 1.5 - - Tensoactive
Magnesium stearate 0.5 - - Lubricant
Lactose monohydrate M200 82.5 - 79.1 Diluent
Polyvinylpyrrolidone (Kollidon K30) 15.0 - 16.7 Binder
Corn starch - 67.5 - Diluent
26.0 µg/mL. Work solutions were obtained by diluting three independent stock solutions at 100 µg/mL.
The obtained results were plotted in a graph of analyte concentration (µg/mL) versus response (peak area). Both regression equation and the determination coeicient (r2) were obtained by ordinary least squares
method. The obtained data were further statistically analyzed to prove that they met the assumptions for a linear regression. Analysis of variance (ANOVA) was used to determine how well the model it the data. The Jacknife test was used in order to evaluate the presence of outliers. Ryan-Joiner, Durbin-Watson, and Brown-Forsythe tests were performed to assess normality, independency, and homoscedasticity of residuals, respectively.
Selectivity
Excipient samples used in the three batches (A, B, and C) were prepared in order to check any interfering peak eluting at the same retention time as the peak of prednisone at the lowest concentration (14.0 µg/mL). Selectivity was further assessed by analyzing prednisone peak purity. The solutions of placebo were prepared by weighing an amount of excipient equivalent to the amount of excipient present in capsules containing 5 mg of prednisone.
Precision
Repeatability (intra-day precision) was evaluated calculating the relative standard deviation (RSD) of six independent solutions of prednisone API at 20.0 µg/mL. Intermediate precision (inter-day precision) was assessed repeating the procedures of repeatability on two diferent days by two analysts, and the RSD of the 12 solutions was determined.
Accuracy
Accuracy was estimated by spiking known amounts of prednisone reference standard at 100.0 µg mL-1 to a ixed
amount (50 mg) of placebos. Subsequently, these solutions were diluted, and recovery from the levels of 80%, 100%, and 120% (16.0, 20.0, and 24.0 µg/mL, respectively)
was calculated in triplicate. Recovery was determined as the percentage ratio between the average concentration obtained experimentally and the corresponding theoretical concentration at each level.
Robustness
The parameters ratio of methanol in mobile phase, mobile phase flow-rate, and oven temperature were varied in order to test robustness as shown in Table II. Six determinations were carried out at 100% of the working concentration (20.0 µg/mL) in each of the seven conditions proposed. The mean results were compared by analysis of variance (ANOVA) using the F test.
Analysis of capsules containing prednisone
The optimized and validated method was employed in assay and content uniformity determination of three batches of prednisone capsules. Assay was performed in triplicate for each batch. Samples of capsules were prepared by weighing an appropriate mass of the powder equivalent to the amount of prednisone required to obtain the concentration used in the developed method (20.0 µg/mL), using the average weight previously obtained. The content uniformity test was assessed as described in Brazilian Pharmacopeia (Farmacopeia Brasileira, 2010).
RESULTS AND DISCUSSION
Chromatographic method
Since there are no methods described in the literature for determination of prednisone in capsules, those for determination in API and in tablets were primarily tested in this study. However, these methods were not reproducible, being not suitable for the quantiication in capsules.
Barancelli and Ferreira (2007) proposed the use of an ultraviolet spectrophotometric method for determination of prednisone in capsules, using a method described in Brazilian Pharmacopeia for tablets. However, according to our results, this method was not
TABLE II - Parameters and conditions proposed to evaluate robustness
Parameters Nominal 1 2 3 4 5 6
Ratio of methanol (%) 70 67 73 70 70 70 70
Mobile phase low-rate (mL/min) 1 1 1 1 1 0.8 1.2
selective, as some excipients used in the formulation were absorbed significantly at the same wavelength as prednisone. The solutions of placebo from batches A, B, and C presented absorbances of about 9.9%, 5.0%, and 5.4% of the absorbance of the reference standard solution. Therefore, the results found with the spectrophotometric method were overestimated when compared to those using the chromatographic method developed in this study.
An HPLC method for prednisone analysis in API, employing tetrahydrofuran in the mobile phase, was also tested. The high amount of tetrahydrofuran in the mobile phase resulted in an unstable baseline, which may lead to uncertainty of measurement. The probable reason for this behavior is the peroxide formation, which occurs when tetrahydrofuran is exposed to light, as already described in the literature (Clark, 2001).
In this context, a new chromatographic method was developed and validated. Tetrahydrofuran was excluded and the mobile phase was composed of methanol and water in an optimized ratio to achieve a reduced analysis time. The best conditions were those described in the section Apparatus and chromatographic conditions, which were used to validate the method. The retention time for prednisone was 3.6 minutes. Plate number and tailing factor were 8,793 and 1.154, respectively, showing method suitability.
Linearity
The analytical curve, as well as parameters of the linear regression is presented in Figure 2 and Table III. The coeicient of determination (r2) obtained was higher than
the preconized minimal value of 0.99. Since a high value of determination coeicient does not necessarily mean a linear model, the assumptions concerning the residuals were tested (Souza, Junqueira, 2005).
No outliers were found according to the Jacknife test, at a signiicance level of 0.05. Normality of residual distribution was conirmed by the Ryan-Joiner test, as the correlation coeicient obtained (0.9815) was higher than the critical value (0.9614) for p>0.10.
Independency of residuals was veriied using the Durbin-Watson test. There was no correlation between the residuals; i.e., there was no efect of any treatment on the subsequent treatment. The homoscedasticity was proved by the Brown-Forsythe test, with tL (t from Levene) of
0.85, lower than critical t value (2.093). Thus, there was no statistical diference between variances obtained for all tested levels; i.e., the variance of errors was constant across observations.
The regression significance was evaluated using ANOVA. The calculated F value (4836.21) was higher than the critical value (4.38075); therefore, regression was signiicant. Deviation from linearity (lack of it) was also assessed by ANOVA. The calculated F value (0.319) was lower than the critical value (2.9582), showing the suitability of the linear model.
Selectivity
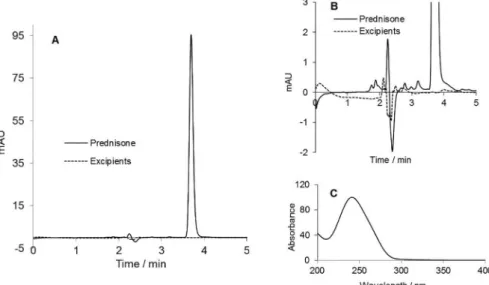
Selectivity was assessed by comparing the chromatograms obtained with a sample of prednisone reference standard at 14.0 µg/mL with those of placebo samples in order to check the presence of interferences. No chromatographic peaks were observed in the chromatograms of placebo samples (batches A, B, and C) at the same retention time as prednisone in the reference standard sample (Figures 3A and 3B).
Chromatographic peak purity of prednisone in capsule samples was conirmed by means of ChemStation software (Agilent, USA). Moreover, the spectrum of absorbance in the range between 200 to 400 nm for capsule samples, obtained with ChemStation software (Figure 3C), exhibited a similar proile, with minimums and maximums in the same wavelength of the spectrum of prednisone reference standard found in the literature (Mofat, Osselton, Widdop, 2004).
TABLE III - Regression parameters of analytical curve
Regression parameters Results
Coeicient of determination (r2) 0.9961
Slope ± standard deviation 44.912 ± 0.646
Intercept ± standard deviation 6.535 ± 13.172
Range (%) 70 – 130
Number of points 7
Precision
The content of prednisone in samples at 20.0 µg mL-1 used in the evaluation of intra-day precision is
shown in Table IV. In the evaluation of inter-day precision (assessed on two diferent days by two analysts), the mean content was 99.38% and RSD was 0.88%. According to current Brazilian legislation, RSD must not exceed the limit of 5.0% (ANVISA, 2003). Therefore, the developed method showed appropriate repeatability and intermediate precision.
Accuracy
Accuracy was calculated comparing the responses obtained for samples of prednisone reference standard with
those obtained for placebo spiked with prednisone at 16.0, 20.0, and 24.0 µg mL-1 (levels 80%, 100%, and 120%).
The test was applied separately for batches A, B, and C. The recovery found for all concentrations and batches was between 98% and 102% (Table V), demonstrating method accuracy (Green, 1996; ICH, 2005).
Robustness
The mean content obtained in the evaluation of robustness in the seven tested conditions (n = 6) ranged from 98.94% to 99.39% with RSD between 0.50% and 0.62%. The result obtained for each tested condition was compared using ANOVA. The calculated F value (0.48)
FIGURE 3 - (A) Chromatograms of prednisone reference standard at 14.0 µg mL-1 and placebo sample using the optimized
conditions of the chromatographic method. (B) Expanded chromatograms of (A). (C) Spectrum of ultraviolet absorbance in the range 200-400 nm for prednisone.
TABLE IV - Data from repeatability and intermediate precision
Replicate Content (%)
Day 1 Day 2
1 98.31 99.97
2 100.39 99.28
3 100.86 98.74
4 98.96 98.16
5 99.68 98.50
6 100.27 99.48
Mean 99.75 99.02
RSD (%) 0.96 0.68
TABLE V - Data from accuracy experiments
Batch Level (%) Recovery (%)
A 80 100.61
100 99.94
120 100.79
B 80 99.19
100 99.77
120 99.56
C 80 100.51
100 99.73
120 100.32
Mean 99.38
was lower than the F critical (2.37) at the significance level of 5%, showing that there was no significant statistical diference between evaluated means. Therefore, the method can be considered robust in the assessed conditions.
Analysis of capsules
After development and validation, the proposed method was used to evaluate content and uniformity of dosage units (using the content uniformity test) in three batches of prednisone capsules. In assay, six replicates of the samples were prepared for each batch. The acceptable level of prednisone was 95% to 105% of the labeled amount. The results are shown in Table VI. Only batch A showed content within the established range, meeting the assay test. Batches B and C presented results out of speciication and therefore would not be approved.
The content of prednisone for batches A, B, and C were 105.10%, 96.08%, and 97.17% when the spectrophotometric method was employed (Barancelli, Ferreira, 2007). These results were higher than those obtained with the chromatographic method. Therefore, the spectrophotometric procedure overestimated the results due to the interferences of excipients.
The content uniformity test was assessed assaying individually the amount of prednisone in 10 capsules. This procedure was performed for the three available batches (Table VII). The mean contents and the standard deviations were used to calculate the acceptance value, which must not be higher than 15.0.
The three batches complied with the recommended requirements for the test of content uniformity, since the acceptance values (2.52, 8.84, and 12.46 for batches A, B, and C, respectively) were lower than the maximum allowed value (Farmacopeia Brasileira, 2010).
CONCLUSIONS
The developed and validated method proved to be linear, precise, accurate, selective, robust, and therefore appropriate for assessing the quality of capsules containing prednisone. Moreover, this method has advantages in terms of speed of analysis when compared with the methods described in the literature for the analysis of prednisone in API and tablets. Also, it excluded the inconvenience of working with tetrahydrofuran, an unstable and considerably toxic solvent. Therefore, this method can be used in quality control of capsules and formulation studies.
ACKNOWLEDGEMENTS
The authors would like to thank CNPq, FAPEMIG, CAPES, and ANVISA for the financial support and Associação Nacional de Farmacêuticos Magistrais (ANFARMAG) for donating active pharmaceutical ingredients and the three batches of capsules.
REFERENCES
AGÊNCIA NACIONAL DE VIGILÂNCIA SANITÁRIA. ANVISA. Resolução RE nº 899, de 29 de maio de 2003.
Guia para validação de métodos analíticos e bioanalíticos.
Diário Oicial [da] República Federativa do Brasil, Brasília, DF, Poder Executivo, de 2 junho de 2003.
TABLE VII - Results from content uniformity of three batches of
prednisone capsules employing the developed method
Unit Batch (%)
A B C
1 97.57 93.41 89.35
2 98.53 92.90 88.01
3 98.00 94.13 90.94
4 97.41 92.12 88.25
5 99.60 91.57 88.20
6 100.09 91.07 88.21
7 98.62 91.31 88.08
8 100.37 92.69 89.27
9 99.53 92.53 90.78
10 98.31 91.53 88.80
Mean 98.80 92.33 88.99
Standard deviation 1.04 0.99 1.09
RSD (%) 1.05 1.07 1.23
Acceptance value 2.52 8.74 12.46
TABLE VI - Results from assay of three batches of prednisone
capsules employing the validated method
Replicate Content (%)
Batch A Batch B Batch C
1 98.65 93.51 89.63
2 98.88 92.92 90.32
3 98.32 92.61 90.25
Mean 98.62 93.01 90.07
BARANCELLI, R.; FERREIRA, J.R.N. Avaliação físico-química de cápsulas manipuladas de prednisona no
municipio de Erechim. Evidência, v.7, n.1, p.51-62, 2007.
BRASIL. Ministério da Saúde. Relação nacional de
medicamentos essenciais 2013. 8.ed. Brasília: Ministério
da Saúde, 2014.
CLARK, D.E. Peroxides and peroxide-forming compounds.
Chem. Health & Safety, Sep-Oct, p.12-22, 2011.
FARMACOPEIA BRASILEIRA. 5.ed. Brasília: Anvisa, 2010.
GENNARO, A.R. Remington: a ciência e a prática da farmácia.
20.ed. Rio de Janeiro: Guanabara Koogan, 2004. 2210p.
GILROY, D.W.; LAWRENCE, T.; PERRETTI, M.; ROSSI, A.G. Inlammatory resolution: new opportunities for drug discovery. Nat. Rev. Drug Discov., v.3, n.5, p.717-726, 2003.
GOODMAN, L.S.; GILMAN, A.; BRUNTON, L.L., LAZO, J.S.; PARKER, K.L.(Eds.) Goodman & Gilman: as bases
farmacológicas da terapêutica. 10.ed. Rio de Janeiro:
MGraw Hill, 2010. 2112p.
GREEN, J.M. A practical guide to analytical method validation.
Anal. Chem., v.68, p.305A-309A, 1996.
INTERNATIONAL CONFERENCE ON HARMONISATION.
ICH. Validation of analytical procedures: text and
methodology (Q2 R1). Switzerland, 2005.
L A A N , R . F. ; J A N S E N , T. L . , VA N R I E L , P. L . Glucocorticosteroids in the management of rheumatoid
arthritis. Reumathology, v.38, n.1, p.6-12, 1999.
MARKMAN, B.E.O.; KOSCHTSCHAK, M.R.W.; AURICCHIO, M.T. Otimização e validação de método farmacopeico para veriicar possíveis desvios de qualidade de matérias-primas e cápsulas manipuladas contendo
hormônios tireoideanos. Rev. Inst. Adolfo Lutz, v.66, n.3,
p.268-274, 2007.
MOFFAT, A.C.; OSSELTON, M.D.; WIDDOP, B. Clarke’s
analysis of drugs and poisons. 3.ed. London: Pharmaceutical Press, 2004. 1248p.
RANG, H.P.; DALE, M.M.; RITTER, J.M.; GARDER, P.
Farmacologia. 6.ed. Rio de Janeiro: Elsevier, 2007. 808p .
RODRIGUES, R.V.; DOS SANTOS, F.S.; JUNQUEIRA, M.S.; VENTURA, F.M.; MARTINS, A.T.; SCANNAVINO, F.L. Corticosteroides: precrição clínica e efeitos metabólicos.
Rev. Assoc. Bras. Odontol., v.16, p.233-135, 2008.
SAGCAL-GIRONELLA, A.C.P.; SHERWIN, C.M.T.; TIRONA, R.G.; RIEDER, M.J.; BRUNNER, H.I.; VINKS, A.A. Pharmacokinetics of prednisolone in childhood-onset systemic lupus erythematosus (cSLE). Clin. Ther., v.33, n.10, p.1524-1536, 2011.
SOUZA, S.V.C.; JUNQUEIRA, R.G. A procedure to assess linearity by ordinary least squares method. Anal. Chim.
Acta, v.552, n.1-2, p.25-35, 2005.
Received for publication on 11st April 2016