Accoustic immitance measures
in infants with 226 and 1000
hz probes: correlation with
otoacoustic emissions and
otoscopy examination
Summary
Michele Vargas Garcia1, Marisa Frasson de
Azevedo2, José Ricardo Testa3
1 Specialist, Speech and Hearing Therapist.
2 PhD, Adjunct Professor - Universidade Federal de São Paulo-UNIFESP/ Escola Paulista de Medicina.
3 PhD, Adjunct Professor of Otorhinolaryngology - Universidade Federal de São Paulo/UNIFESP/Escola Paulista de Medicina/EPM.
Universidade Federal de São Paulo/ UNIFESP- Escola Paulista de Medicina/EPM
Send correspondence to: Michele Vargas Garcia - Rua Borges Lagoa 512 apto. 92 B 04038-000 São Paulo SP. CAPES.
This paper was submitted to the RBORL-SGP (Publishing Manager System) on 25 August 2007. Code 4741. The article was accepted on 2 November 2007.
A
udiological evaluation in infants should include the middle ear (immitance measures and otoscopy) and also a cochlear evaluation. Aim: To check which tympanometry tone test (226 Hz or 1000 Hz), transient otoacoustic emissions and otoscopy. Methods: Transient otoacoustic emissions were taken from sixty infants ranging from zero to four months of age. The babies were assigned to two groups of 30 infants each, according to the presence or absence of otoacoustic emissions (OAE). All babies have undergone tympanometry with probe tones of 226 and 1000 Hz and ENT evaluation. Results: Tests performed with 1000 Hz probe tone were more sensitive in identifying middle ear disorders. In children with normal tympanograms, both probe tones (226 and 1000 Hz) showed high specificity. All correlations were significant when the 1000 Hz probe tone was used. Conclusion: The high frequency probe tone (1000 Hz) presented the most significant correlation with OAE and otoscopy in infants from zero to four months of age.Keywords: hearing, child, middle ear, acoustic impedance tests.
original article Braz J Otorhinolaryngol
INTRODUCTION
The early diagnosis of hearing impairment (HI) in children must enjoy special attention from health care pro-fessionals, especially from pediatricians, otolaryngologists and speech and hearing therapists.
In order to have a trustworthy audiologic diag-nosis in infants, it is necessary to assess the middle ear conditions, because they can cause temporary conductive hearing loss and impact cochlear function studies.
In order to assess cochlear function (outer hair cell integrity), the infants are submitted to Evoked Otoacoustic Emissions recording and analysis, and the transient click stimulus (TOAE) is the one recommended for neonatal auditory screening1,2.
Pressure variations in the external auditory canal and/or in the middle ear impact the amplitude, spectrum and reproducibility of Evoked Otoacoustic Emission res-ponses3.
When the newborn does not respond to the Oto-acoustic Emissions test, it is necessary to submit him/her to an otolaryngological evaluation in order to look for alterations in the external auditory canal and/or the middle ear. Together with medical evaluation, it is necessary to assess acoustic immittance values in order to assess the infant’s middle ear conditions.
Acoustic immittance measures contribute with information about middle ear mobility and the auditory pathway integrity at this level. They are very much used in clinical practice with infants for being an objective evaluation providing the tympanometric curve and the acoustic reflexes.
Conventional tympanometry is carried out with the 226Hz test tone and the results with this tone have con-siderable diagnostic value for elderly, adult and pediatric patients starting at 6 years of age; however, in relation to newborns and infants, there are controversies. Studies have shown that infants without OAE can have a normal tympanometric curve at the study with 226Hz test tone, even when there are conductive alterations. Thus, the application of the highest test tone (1,000Hz) has been suggested by some authors, because mild middle ear pro-blems would not be detected by the 226Hz4,5 probe.
On the other hand, in studies carried out in Brazil, Carvallo6 and Linares7 advocated the use of the 226Hz
probe in children from 0 to 8 months, since they found matching results in their assessments.
Starting from the aforementioned considerations, we can stress that it is very important that the tympanometric curve be obtained with accuracy. Thus justifying the need to study tympanometric curves by means of two test-tones (226Hz and 1000Hz) and check if there is any difference in the tympanometric responses in relation to tones, as well as doing a joint analysis of the Transitory Otoacoustic Emission Test and otolaryngological medical evaluation.
Thus, in this study we aim at checking which test tone for tympanometry (226Hz or 1000Hz) is more correla-ted with the otorhinolaryngology evaluation and the results from the Otoacoustic Emissions by transient stimulus in infants from zero to four months.
MATERIALS AND METHOD
This study was approved by the Ethics in Research Committee, under protocol # 0723/06.
Following ethic principles of research with human beings, the parents and/or guardians agreed with their children’s participation in this study and signed the free and informed consent form.
The sample was made up of 60 infants, of both genders, of an age range from zero to four months, distri-buted in two groups. Group I: Thirty infants with Transient Otoacoustic Emissions and Group II: thirty infants without Transient Otoacoustic Emissions.
In order to make up the groups, the infants had to be between zero and four months, with and without risk indicator for hearing impairment. We ruled out all the infants with external acoustic canal malformation, since it would make it impossible to evaluate them in this study, as well as infants with neurological alterations and/or genetic syndromes.
Each evaluation was carried out following this study’s protocol. This study was considered a double blind, since the examiners were not aware of results from the other tests the infants were submitted to. The otorhinolaryngologist did not know to which group the infant belonged to, and the researcher was not aware of the medical evaluation results and only had access to all the results after the conclusion of the exams the infants were submitted to. All the evaluations were carried out on the same date. The parameters considered in this study were the following:
1. Otoscopic exam: the infants were assessed by the otorhinolaryngologist for otoscopy, to check the conditions of the external acoustic meatus and the tympanic mem-brane. For this study, the tympanic membrane conditions were considered, and were classified as normal or altered (retracted hyperemic, opaque, perforated, and bulged). The physician in charge of the evaluation has more than fifteen years of experience with newborns.
2. Recording and analysis of the Otoacoustic Emis-sions by Transient Stimulus (TOAE): The infants were submitted to Transient Otoacoustic Emissions recording and analysis, considering Finitzo’s criteria (1998) recom-mended by Chapchap (1996)8 and Azevedo (2003)9, and
they were: click stimulus, with 75-83 dBpeSPL stimulus intensity, in the frequency range between 1,500 and 4,000Hz. TOAE was considered present when the signal/ noise ratio by frequency band was ≥ 3 dB for 1,500Hz and
reproducibility considered was ≥50% and the probe sta-bility ≥70%. In the absence of these responses, the infant did not have otoacoustic emissions. The transient stimuli otoacoustic emissions were carried out with the infants inside a sound treated booth. The equipment used was the ILO 96-Otoacoustic Emissions Analyzer, coupled to a microcomputer, using the “Quickscreener”.3. Acoustic
Immittance Measures: tympanometry was carried out in the infants by means of a Middle Ear Analyzer: Impedance Audiometer- AT235h- Interacoustics. The tympanometric curve was carried out by the 226Hz and the 1000Hz test tones. The tympanometry was captured in two frequencies in order to observe whether there would be a differen-ce in the infants’ tympanometric curves, and the probe suggested in the literature to assess this age range is the 1000Hz probe. The tympanometric curves were classified according to Jerger (1970)10 and Carvallo (1992)6 in: Type
A - a single admittance peak between -150 and +100 daPa and 0.2 to 1.8ml volume; Type C - Admittance peak shif-ted towards the negative pressure side; type D - Double peak curve; asymmetrical curve - peak at high positive pressure; inverted curve - with inverted shape in relation to the normal curve and B-type flat curve - without an admittance peak. The statistical analyses were carried out by means of the chi-square test.
RESULTS
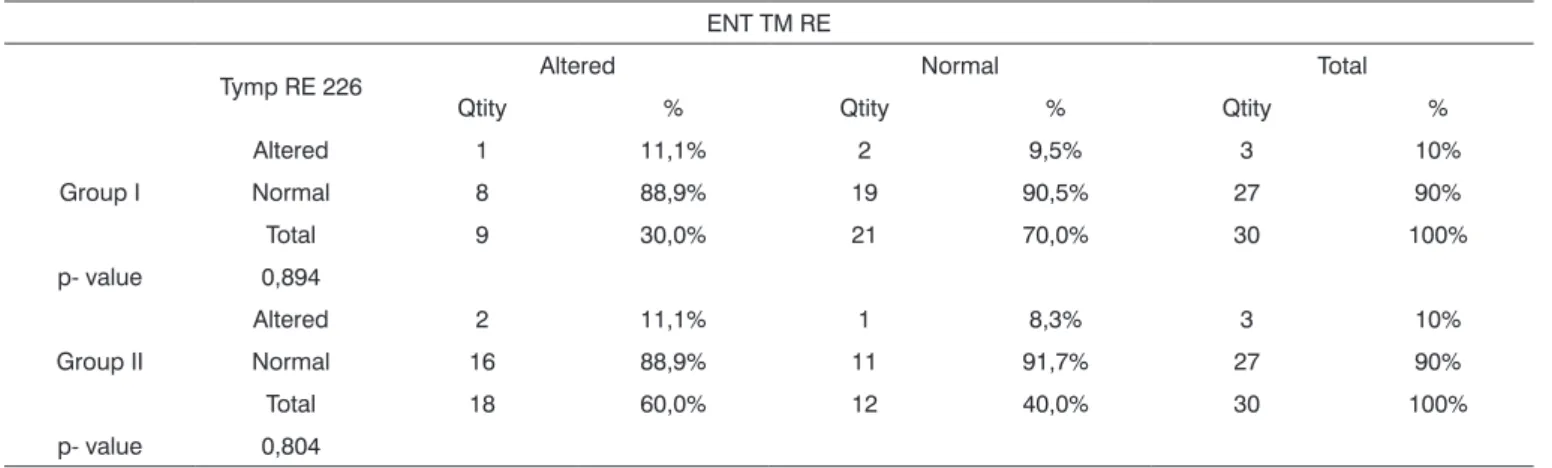
The results are being presented by ear (right and left) and by group (emissions present and absent). Firstly we analyzed the tympanometry findings with the 226Hz test tone in relation to the otoscopic evaluation, consi-dering tympanic membrane conditions. Tables 1 and 2 show the correlations between the tympanometry findings with the 226Hz test tone and the otoscopic evaluation for both ears.
We did not find any statistically significant correla-tion between the otoscopic evaluacorrela-tion and the tympano-metry findings with the 226Hz tone test.
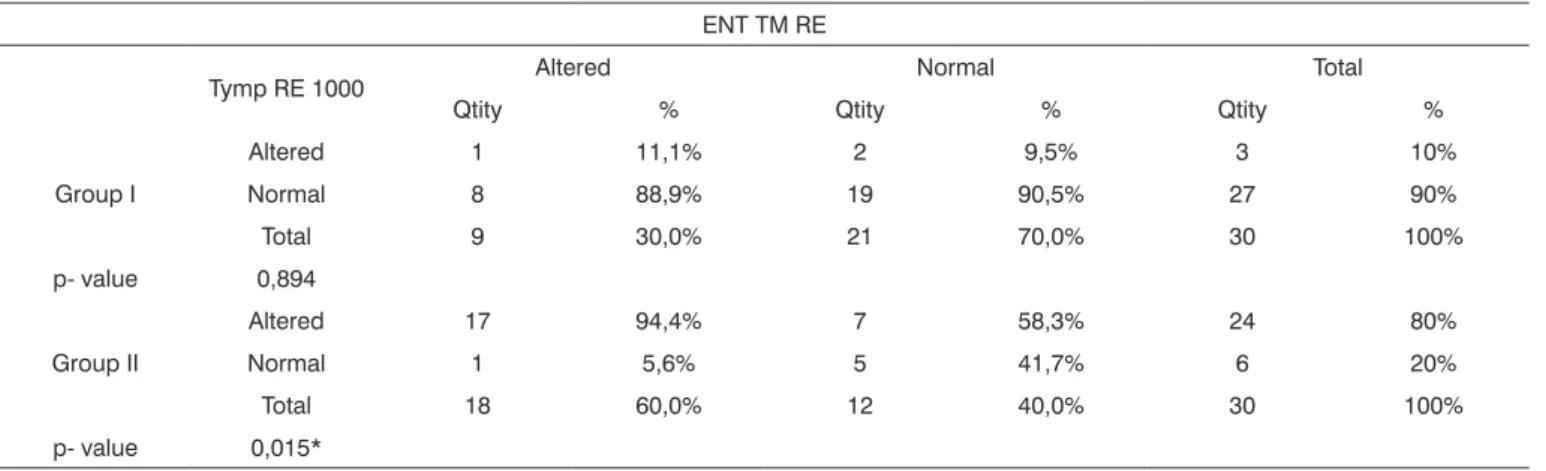
We analyzed the tympanometry findings with the 1000Hz test tone in relation to the otoscopic evaluation (tympanic membrane conditions) in both groups, which is shown on Tables 3 and 4.
There was a statistically significant difference in group II both for evaluations with alterations (conside-ring a retracted tympanic membrane, hyperemic, opaque, perforated, bulged and/or B or C tympanometric curve), as well as for evaluations within normal values in relation to the 1000Hz test tone when compared to the otoscopic evaluation. We did not find any perforated tympanic membrane.
Following, we present a Chart (Chart 1) summa-rizing the descriptive measures: specificity, sensitivity, accuracy, false positive, false negative and p-value (chi-squared).
It was possible to see that the 1,000Hz test tone in tympanometry was more sensitive in Group II and more specific in Group I, and the 226Hz test tone was more specific for groups I and II.
We tried to see which tympanometry tone test (226Hz or 1,000Hz) has a greater correlation with the oto-acoustic emissions in infants in order to observe the type of tympanometric curve in each test tone for each group studied, in order to facilitate the diagnosis of conductive hearing disorders, especially in group II. If the professional is aware of this correlation, he/she can be more efficient in referring the patient to a differential diagnosis and it enhances the speed of the audiologic diagnostic.
Tables 5 and 6 showed the tympanometry findings and their correlations with the 226Hz test tone and otoa-coustic emissions for both ears in both groups.
We did not see statistically significant differences
Table 1. Tympanometry with the 226Hz test tone and right ear otoscopic evaluation in both groups. ENT TM RE
Tymp RE 226 Altered Normal Total
Qtity % Qtity % Qtity %
Group I
Altered 1 11,1% 2 9,5% 3 10%
Normal 8 88,9% 19 90,5% 27 90%
Total 9 30,0% 21 70,0% 30 100%
p- value 0,894
Group II
Altered 2 11,1% 1 8,3% 3 10%
Normal 16 88,9% 11 91,7% 27 90%
Total 18 60,0% 12 40,0% 30 100%
p- value 0,804
Table 2. Tympanometry with the 226Hz tone test and left ear otoscopic evaluation in both groups. ENT TM LE
Tymp LE 226 Altered Normal Total
Qtity % Qtity % Qtity %
Group I
Altered 2 18,2% 1 5,3% 3 10%
Normal 9 81,8% 18 94,7% 27 90%
Total 11 36,7% 19 63,3% 30 100%
p- value 0,256
Group II
Altered 1 14,3% 5 21,7% 6 20%
Normal 6 85,7% 18 78,3% 24 80%
Total 7 23,3% 23 76,7% 30 100%
p- value 0,333
*significant p-value < 0.05 (5%). Legend: group I: infants with otoacoustic emissions, group II: infants without otoacoustic emissions; LE: Left ear; TM: tympanic membrane, Tymp: tympanometry; ENT: otolaryngologist. Qtity: Quantity
Table 3. Tympanometry with the 1000Hz test tone and right ear otoscopic evaluation in both groups. ENT TM RE
Tymp RE 1000 Altered Normal Total
Qtity % Qtity % Qtity %
Group I
Altered 1 11,1% 2 9,5% 3 10%
Normal 8 88,9% 19 90,5% 27 90%
Total 9 30,0% 21 70,0% 30 100%
p- value 0,894
Group II
Altered 17 94,4% 7 58,3% 24 80%
Normal 1 5,6% 5 41,7% 6 20%
Total 18 60,0% 12 40,0% 30 100%
p- value 0,015*
*significant p-value < 0.05 (5%) Legend: group I: infants with otoacoustic emissions, group II: infants without otoacoustic emissions RE: right ear; TM: tympanic membrane, Tymp: tympanometry; ENT: otolaryngologist
Table 4. Tympanometry with 1000Hz test tone and left ear otoscopic evaluation in both groups. ENT TM LE
Timp OE 1000 Altered Normal Total
Qtity % Qtity % Qtity %
Group I
Altered 4 36,4% 2 10,5% 6 20%
Normal 7 63,6% 17 89,5% 24 80%
Total 11 36,7% 19 63,3% 30 100%
p- value 0,804
Group II
Altered 19 95,0% 4 40,0% 23 77%
Normal 1 5,0% 6 60,0% 7 23%
Total 20 66,7% 10 33,3% 30 100%
p- value 0,001*
We notice that for the 1,000Hz test tone there is a statistically significant relationship between the tympa-nometry curve and the otoacoustic emissions, and this relation is valid for both ears from both groups. When we compare the tympanometry test tone with the otoacoustic emissions, the 1,000Hz test tone has a high sensitivity and specificity percentage.
DISCUSSION
The detection and follow up of otologic diseases are paramount, especially in the first months of life. In the pediatric otolaryngological practice, the identification of
Chart 1. Summary of the descriptive values: specificity, sensitivity, accuracy, false positive, false negative and p-value (chi-squared) in relation to the otorhinolaryngological assessment and multiple frequencies tympanometry.
Test tone and ENT Tymp RE 226 Tymp RE 1,000 Tymp LE 226 Tymp LE 1,000 ENT TM RE ENT TM RE ENT TM LE ENT TM LE
Accuracy Group I 66,7% 66,7% 66,7% 70,0%
Group II 43,3% 73,3% 46,7% 83,3%
Sensitivity Group I 11,1% 11,1% 18,2% 36,4%
Group II 11,1% 94,4% 25,0% 95,0%
Specificity Group I 90,5% 90,5% 94,7% 89,5%
Group II 91,7% 41,7% 90,0% 60,0%
+PV Group I 33,3% 33,3% 66,7% 66,7%
Group II 66,7% 70,8% 83,3% 82,6%
-PV Group I 70,4% 70,4% 66,7% 70,8%
Group II 40,7% 83,3% 37,5% 85,7%
p-value Group I 0,894 0,894 0,256 0,088#
Group II 0,804 0,015* 0,333 0,001*
*Significant p-value < 0.05 (5%). group I: Legend: infants with otoacoustic emissions, group II: infants without otoacoustic emissions; LE: left ear; TM: tympanic membrane, Tymp: tympanometry; ENT: otolaryngologist.
Table 5. Tympanometry with the 226Hz test tone and the otoacoustic emissions in the right ear for both groups.
Tymp RE 226
Altered Normal Total
Qtity % Qtity % Qtity %
Group I 3 50,0% 27 50,0% 30 50%
p-value 1,000
Group II 3 50,0% 27 50,0% 30 50%
p-value 1,000
Total 6 10,0% 54 90,0% 60 100%
*Significant p-value < 0.05 (5%) Legend: group I: infants with otoa-coustic emissions; group II: infants without otoaotoa-coustic emissions; RE: right ear; TM tympanic membrane; Tymp: tympanometry; ENT: otolaryngologist; Qtity: Quantity
Table 6. Tympanometry with the 226hz test tone and otoacoustic emissions in the left ear from both groups.
Timp OE 226
Altered Normal Total
Qtity % Qtity % Qtity %
Group I 3 33,3% 27 52,9% 30 50%
p-value 0,278
Group II 6 66,7% 24 47,1% 30 50%
p-value 0,278
Total 9 15,0% 51 85,0% 60 100%
*Significant p-value < 0.05 (5%) Legend: group I: infants with otoa-coustic emissions; group II: infants without otoaotoa-coustic emissions; LE: left ear; TM tympanic membrane; Tymp: tympanometry; ENT: otolaryngologist; Qtity: Quantity
in the correlation between otoacoustic emissions and the 226Hz probe tympanometry, both for altered and normal patients from the two groups.
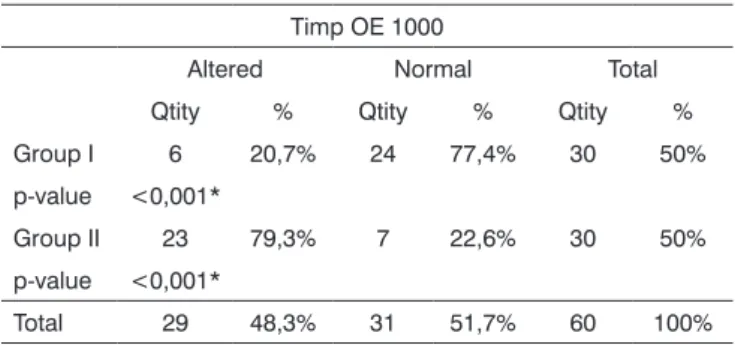
The correlations between the 1,000Hz tympano-metry and the otoacoustic emissions are presented on Tables 7 and 8.
We did find a statistically significant correlation for the 1,000Hz test tone and the otoacoustic emissions both for infants with abnormalities in their evaluations as well as those who were found normal in both groups.
children with acute disorders and febrile and/or painful manifestations is among the most frequent problems.
All the results available must be used in an attempt to detect these alterations. The otologic evaluation of middle ear dysfunctions in infants is more accurate when added to otorhinolaryngological evaluation and immit-tance tests.
Infant’s middle ears can have otitis because of numerous causes and, according to Paparella11, if well taken care of, they do not leave sequelae; however, if left untreated it can become a chronic disease. According to Ingvarsson et al.12 and Santos13 it is one of the frequent
problems that most happen to children.
Having these quotations in mind, it is very impor-tant to accurately diagnose otitis media cases and the combination of an otorhinolaryngological evaluation and tympanometries represent an efficacious and feasible combination. The Joint Committee on Infant Hearing14
suggests that acoustic immittance in infants must be part of the audiologic battery of tests. Purdy, Willians15 mentions
the need to better use tympanometry in infants.
Otoscopic evaluation in infants must be carried out by an experienced physician, because the external acoustic meatus in very small, thus making it difficult to see the tympanic membrane. Besides experience, it is necessary to have a good otoscope that enhances view. In the present investigation, the otoscopic evaluations met these needs. In order to carry out the tympanometry, all the infants were in a light sleep and the procedure was carried out in a fast and careful way in order to properly seal the external auditory canal, as recommended by Carvallo16.
In this study, one of the goals was to correlate the multiple frequencies tympanometry with the otoscopic evaluations in order to check for results’ reliability as well as to observe the sensitivity and specificity of the tests employed.
In our study, there was no statistically significant correlation between the otoscopic evaluation and the 226Hz test tone tympanometry findings (Tables 1 and 2). When the otoscopic evaluation presented some alteration, the 226Hz test tone was within normal limits. The statis-tical analyses were carried out by ear, thus, for the right ears in group I, 88.9% of the tympanometric assessments were normal with altered otoscopic evaluation (Table 1). For the left ear, in the same group, 81.8% of the ears had normal tympanometry exams and had altered otoscopic evaluation (Table 2). Group II also had high percentages of normal tympanometric curves and alterations seen in the otoscopic evaluation, 88.9% for the right ear and 85.6% for the left ear (Tables 1 and 2).
The 1000Hz test tone was correlated with the otoscopic evaluation, we found a statistically significant difference in group II, both for the altered evaluations (considering the tympanic membrane retracted, hyperemic,
Table 7. Tympanometry with the 1,000Hz test tone and otoacoustic emissions in the right ear for both groups.
Tymp RE 1000
Altered Normal Total
Qtity % Qtity % Qtity %
Group I 3 11,1% 27 81,8% 30 50%
p-value <0,001*
Group II 24 88,9% 6 18,2% 30 50%
p-value <0,001*
Total 27 45,0% 33 55,0% 60 100%
*Significant p-value < 0.05 (5%) Legend: group I: infants with otoa-coustic emissions; group II: infants without otoaotoa-coustic emissions; RE: right ear; TM tympanic membrane; Tymp: tympanometry; ENT: otolaryngologist; Qtity: Quantity
Table 8. Tympanometry with the 1,000Hz test tone and otoacoustic emissions in the left ear for both groups.
Timp OE 1000
Altered Normal Total
Qtity % Qtity % Qtity %
Group I 6 20,7% 24 77,4% 30 50%
p-value <0,001*
Group II 23 79,3% 7 22,6% 30 50%
p-value <0,001*
Total 29 48,3% 31 51,7% 60 100%
*Significant p-value < 0.05 (5%) Legend: group I: infants with otoa-coustic emissions; group II: infants without otoaotoa-coustic emissions; LE: left ear; TM tympanic membrane; Tymp: tympanometry; ENT: otolaryngologist; Qtity: Quantity
Chart 2. Accuracy, sensitivity and specificity values obtained from the correlation between the multiple frequency tympanometry and the otoacoustic emissions.
Emissions RE LE
226Hz 1000Hz 226Hz 1000Hz
Accuracy 50,0% 85,0% 55,0% 78,3%
Sensitivity 50,0% 88,9% 66,7% 79,3%
Specificity 50,0% 81,8% 52,9% 77,4%
+PV 10,0% 80,0% 20,0% 76,7%
-PV 90,0% 90,0% 90,0% 80,0%
p-value 1,000 <0,001* 0,278 <0,001*
opaque, perforated, bulged and/or B and C tympanometric curve) as well as for the normal evaluations (Tables 3 and 4). In this group, for the right ear, 94.4% of the ears were altered in both evaluations (Table 3) and regarding the left ear, 95% of the ears also had alterations (Table 4).
The tests’ sensitivity and specificity were checked by means of statistical tests. It was possible to observe that the 226Hz test tone has high specificity percentage for both groups I and II, being around 90% in both groups for both ears. Thus, this test tone is able to pick those evaluations which are within normal limits. The 1,000Hz tone test had high sensitivity (94.4% for the right ear and 95% for the left ear) in group II, and it was appropriate to identify those altered evaluations. It was also specific for Group I (90.5% for the right ear and 89.5% for the left ear (Chart 1)).
Between the two study groups, we assessed 60 infants, 31 (51.6%) had altered bilateral otoscopy and tym-panometry with the 1,000Hz test tone, 24 (40%) infants had bilateral alteration and 8 (14%) had unilateral alteration, adding up to 54% of infants with altered tympanograms. Thus, it is possible to see the proximity of alterations pi-cked by the otoscopic evaluation and the 1,000Hz test tone tympanometry (51.6% and 54%) reinforcing the validity of both tests for this diagnosis.
Cone-Wesson et al.17 carried out a study with a
group of infants between 8 and 12 months. They used the 226Hz test tone and found 58% of infants with middle ear alterations. In the present investigation, the higher percen-tages of alterations were found with the 1,000Hz test tone, similar to what was found by the author. The sample’s age range is different, as are the test tones used, but the number of children with alterations matched ours (54%).
The 1,000Hz test tone use indications in infant tympanometry come from anatomical and physiological differences in the middle ear, as described by Holte et al.18, Moore19.
Margolis, Hunter20 stressed that the mass
compo-nents are higher in high frequency waves (such as the 1,000Hz, for example) and the lower in the low frequency probes (as the 226Hz, for example). These statements help to justify the findings of the present investigation.
The 1,000Hz tympanometry and the otorhinolaryn-gological evaluation were sensitive to identify middle ear alterations and this finding exists in many studies (Franche et al.21; Purdy et al.22, Sutton et al.)23. Margolis3 also
advo-cates the routine use of tympanometry with the 1,000Hz test tone to assess infants’ middle ears.
In this study, Group II had 23 (76% of the group) infants with bilateral alteration in their tympanometric curve with the 1,000Hz test tone. Campbell25 stresses the
importance of diagnosing conductive hearing alterations so as not to delay the diagnosis of conductive and cochlear pathologies. In this study, only one infant (4%) from Group
II was diagnosed as having a cochlear alteration, and this diagnosis happened early on, thus yielding treatment at the proper time.
All the infants diagnosed with middle ear alterations by means of the otoscopic evaluation and tympanometry received immediate medical treatment and were reasses-sed within 10 days. Thus, it was possible to have early diagnosis and treatment, avoiding a possible diagnostic delay, as mentioned by Campbell24.
In terms of the type of otorhinolaryngological alteration found, in Group I (infants with OAE present), 66.6% of the ears were within the normal range, 1.7% with ear drum retraction; 1.7% with hyperemia and 30% with opacity. In Group II, 40% of the infants had normal evaluations, 3.3% had retracted tympanic membranes, none had hyperemia and 56.7% had opacity of the ear drum. It was then possible to observe that in Group II (infants without OAEs) there were more cases of tympanic membrane opacity. In a study carried out by Saeed et al.25
they performed tympanometry and otoscopy in children with otitis media with effusion and concluded that they were sensitive for the diagnosis of middle ear effusion during acute otitis media. These findings are in agreement with those from the present study, since the middle ear alteration was identified. In the current study there were no infants with middle ear effusion, but they had opaci-ty, retraction and hyperemia. They were all treated and followed up by the physician.
Saes et al.26 studied 195 children from zero to two
years of age to investigate middle ear alterations. The children were submitted to otoscopy and tympanometry. They found that 68.4% of the infants had one or more episodes of middle ear effusion in their first two years of life and the age at which this was more prevalent was between four and 12 months. In this study’s sample, all the infants had between zero and six months of age, being within the period mentioned in the study above, which found more middle ear alterations. The findings from the present study agree with those from Saes et al.26, since 76%
of the infants from Group II had tympanometry alteration (Table 8) and 63.4% of the infants from the same group had altered otorhinolaryngological exam.
In a study led by Rhode27 there was a greater
cor-relation between the 1,000Hz tympanometry and OAE and BEAP, however, not with otoscopy. There were more alterations seen at otoscopy (43% of the sample’s ears) than at the tympanometry (1% of the sample’s ears), thus, there was no good correlation among the assessments. These results differ from those of the present study, because the correlation between the otoscopy and the 1,000Hz tym-panometry was significant (Tables 3 and 4).
Capellini28 states that it is not necessary to use the
the otorhinolaryngological exam for normal infants from zero to six months of age. The author’s finding are in agreement with those from the present study, because the specificity found for the 226Hz tone in normal infants was higher than 90% (Chart 1). Thus, the 226Hz test tone tympanometry is able to accurately analyze infants with normal middle ears.
The analyses of the methods used to carry out the tympanometry is paramount for the speech and hearing therapist to be sure about obtaining results, because the tympanometric curve difference interferes in the type of hearing loss the infant may have. The middle ear immit-tance study offers a large number of practical diagnostic applications, such as, for example, information about the functional integrity of the tympanic-ossicular system.
Middle ear mechanic-acoustic properties in new-borns must be studied, because correlations with evoked otoacoustic emissions are important to speed up the diagnosis of conductive hearing loss. Tympanometric stu-dies with infants below six months of age have not been broadly carried out and are necessary in order to enhance the use of tympanometry in the auditory diagnosis at this age range.
According with Northern and Downs29, middle and
outer ear structures change with the child’s development, becoming more like the adult ones at the age of nine years.
In the present study, one of the goals was to check the relationship between multiple frequency tympanome-try and the OAEs, in order to analyze which had the best correlation.
In the sample studied here, there was no statistical significant difference in the correlation between otoa-coustic emissions and the 226Hz tympanometry, both for altered cases as well as for the normal patients in both groups (Tables 5 and 6). Both for Group I and Group II, we noticed that, for the right ear, 50% of the infants’ ears had normal tympanometric curves, and this was not sta-tistically significant (Table 5). The same happened to the left ear, in Group I, 52.9% were normal and for Group II, 47.1% were normal (Table 6). Thus, the 226Hz test tone did not present significant data for this correlation in the two groups studied.
There was a statistically significant correlation for the 1,000Hz test tone and the otoacoustic emissions for infants with abnormalities in the exams as well as for tho-se who had normal results in both groups (Tables 7 and 8). For the right ear of Group I infants, we observed that 81.8% of the tympanometries were normal, and for those in Group II, 88.9% had alterations (Table 7). As to the left ear, for Group I, 77.4% of the tympanometries were nor-mal and for Group II, 79.3% of the tympanometries were altered (Table 22).
Silva30 and Callandrucio et al.31 carried out a study
with infants using OAEs and the 1,000Hz test tone tympa-nometry and found good correlations between the tests, and the same was found in this study’s sample.
Vartiainem32 and Keefe et al.33 mention that the
otoacoustic emissions are very sensitive to middle ear alterations, and this is in agreement with the findings of our study. In the current investigation, of the 30 infants evaluated in Group II, 29 (96.6%) had uni or bilateral di-sease, and thus failed the OAEs. Only 1 (4.4%) infant was diagnosed with sensorineural hearing loss by the BAEP, after treatment of the conductive hearing loss.
In Group I, the 30 infants had OAEs, and 22 (73% of the group) had normal tympanometric curve, with the 1,000Hz test tone being normal in both ears; 1 (0.03% of the group) bilaterally altered and 7 (20% of the group) with unilateral alteration. Even with an altered tympanometric curve, the infants passed the OAEs test. It is believed that this middle ear disease could have been in an initial or final stage, and this did not interfere in the OAEs results. This finding agrees with the one stated by Ameed (1995)34 who says that the presence or absence of OAEs is asso-ciated with the type of fluid present in the middle ear, and effusion with mucous is the one that has the greatest likelihood of failing TOAE.
In this study, the conductive alterations were preci-sely diagnosed with the 1,000Hz tone test tympanometry, thus, the failure of otoacoustic emissions in Group II was associated with this alteration, and this confirmed that it is not a cochlear alteration.
The findings from this study are in agreement with the statement from Carvallo, Ravagnani and Sanches35 who
say the combined application of the acoustic immittance and otoacoustic emissions measures can clarify issues re-garding the level of middle ear involvement which prevent OAEs capture.
Studies such as the one from Zapala36 and
Koivu-nem et al.37 correlated the OAEs with multiple frequency
tympanometries in newborns in order to check for con-ductive hearing loss. In the present investigation, there is an agreement with the findings of the aforementioned authors, since they report greater reliability with the 1,000Hz test tone in tympanometries performed with the OAEs. Sutton et al.23, McKinley et al.38 Margolis3 believe
this correlation between OAEs and the 1,000Hz test tone tympanometry is good.
The study by Soares39 is in agreement with the
findings of the present investigation, because they also found a good correlation between OAEs and the 226Hz tympanometry for normal infants of the same age range. In the current study, the 226Hz test tone had high specificity (Chart 1), being reliable to identify normal evaluations.
The findings of the present investigation are in agreement with those from Rhodes et al.27 who
the results from the otoacoustic emissions and the BAEP and found a greater correlation with the high frequency tympanometry.
In the present study, 8% of the Group II infants (without OAE) had type C tympanometric curve with the 1,000Hz test tone, indicating negative pressure in the middle ear. This finding is in agreement with those from Marshall et al.40 who reported that small quantities of
mi-ddle ear negative pressure could affect OAEs’ amplitude and spectrum.
For this correlation studied (OAEs and acoustic immittance values), the 1,000Hz test tone sensitivity was of 88.9% for the right ear and 79.3% for the left ear. The specificity of this same tone was of 81.8% for the right ear and 77.4% for the left ear (Chart 2). Studies like the ones led by Himelfarb et al.41 have already proven that the higher test tone for infant tympanometry would cap-ture more alterations than the lower tone, establishing more sensitivity. These findings as to the sensitivity of the 1,000Hz test tone agree with other studies by Hunter & Margolis42, Willians et al.43, Keefe & Levi4.
Ho et al.44 reported on the difficulties researchers
have to differentiate the conductive from the cochlear disorder when the infant fails the OAE test. This was not seen in the present investigation because we used the 1,000Hz test tone tympanometry, which was sensitive enough to identify middle ear alterations together with the otolaryngological alteration.
CONCLUSION
The 1,000Hz tone test showed a statistically signifi-cant correlation with the otolaryngological evaluation and the results from the otoacoustic emissions in infants from zero to four months of age. The 1,000Hz test tone tympa-nometry was more sensitive to identify middle ear altera-tions and both test tones (226 and 1000Hz) were specific to identify the tympanograms of infants with OAEs.
REFERENCES
1. Parrado MES. Emissões otoacústicas em recém-nascidos. In: Basseto MCA, Brock R, Wajnsztejn R. Neonatologia: um convite a atuação fonoaudiológica.São Paulo: Lovise; 1999. cap.38.
2. Weber BA, Diefendorf A. Triagem auditiva neonatal. In: Musiek FE e Rintelmann, WF Perspectivas atuais em avaliação auditiva. São Paulo: Manole; 2001. cap. 11. p. 323
3. Margolis RH, Trine MB. Influence of middle-ear disease on otoacoustic emissions. In: Robinette MS, Glattke TJ. Otoacoustic Emissions Clinical Applications. New York : Thieme ; 1997. p. 130-150.
4. Keefe DH, Levi H. Maturation of the middle and external ears: acoustic power- based responses and reflectance tympanometry. Ear Hear. 1996; 17:361-73.
5. Margolis RH, Bass-Ringdahl S, Hanks WD, Holte L, zapala DA. Tympanometry in newborn infants: 1KHz norms. J Am Acad Audiol . 2003;14:383-92.
6. Carvallo RMM. Medida de Imitância Acústica em Crianças de zero a oito meses de idade [tese de doutorado]. São Paulo: universidade Federal de São Paulo-Escola Paulista de Medicina;1992.
7. Linares A E. Medidas imitanciométricas em crianças com ausência de emissões otoacústicas: do nascimento aos oito meses de idade [Dissertação de mestrado]. Faculdade de Medicina da universidade de São Paulo/uSP. São Paulo, 2006.
8. Chapchap MJ. Detecção precoce da deficiência auditiva. RN - 4ªed. São Paulo: Sarvire; 1995. pp. 561-7.
9. Azevedo MF. Emissões otoacústicas. Figueiredo MS. Emissões otoa-cústicas e BERA. São José dos Campos: Pulso; 2003. cap.02. 10. Jerger J. Clinical experience whith impedance audiometry. Arch
Otolaryng . 1970;92:311-24.
11. Paparella MM. Pathology of sensorineural hearing loss in otitis media. Ann Otolaryngol . 1972;81:632-47.
12. Ingevarsson L, Lundgren K, Olfsson B. Epidemiology of acute otitis media in children. Acta Otolaryngol .1982; Suppl 388:1-52. 13. Santos, TMMS. Otite Média: Implicações para o desenvolvimento
da linguagem. In: Schochat E. Processamento Auditivo. São Paulo: Lovise; 1996.
14. Joint Committee on Infant Hearing. (2000). Position Statmene. Ava-liable from: www. asha.com.org. Acesso em: 05 july 7
15. Purdy SC, Williams MJ. High Frequency Tympanometric: a valid and reliable immittance test protocol for young infants? New z Audiologic Soc Bull . 2000;10:9-24.
16. Carvallo RMM. Imitanciometria, In: Tratado de Fonoaudiologia. São Paulo: Editora Roca; 2004.
17. Cone- Wesson B, Ramirez GM. Hearing sensitivity in newborns estimated from ABRs to bone conducted sounds. J Am Audiol. 1997;8:299-307.
18. Holte L, Margolis RH, Cavanaugh RM. Developmental changes in multifrequency tympanograms. Audiology . 1991;30:1-24.
19. Moore JK, Lintchicum FH. Auditory System. In: Paxinos G, Mai JK. The Human Nervous System. 2nd ed. San Diego: Elsevier Academic Press; 2004.p. 1241-79.
20. Margolis RH, Hunter LL. Timpanometria: princípios básicos e aplica-ções clínicas. In: Musiek FE, Rintelmann WI, editores. Perspectivas atuais em avaliação auditiva. São Paulo: Manole; 2001. p.85-126. 21. Franche GLS, Tabajara LMV, Arrarte JLF, Saffer M. Otoscopia e
timpanometria no diagnóstico da otite média secretora. J Pediatric .1998;74(5):365-7.
22. Purdy SC, Williams MJ. High Frequency Tympanometric: a valid and reliable immittance test protocol for young infants? New z Audiologic Soc Bull. 2000;10:9-24.
23. Sutton G, Baldwin M, Brooks D, Gravel J, Thornton R. Tympanometry in neonates and infants under 4 months: a recommended test protocol (online). Manchester, 2002. (Citado 2005 Jul 18). Disponível em http: //www.nhsp.info/getdata.php?1d=135.
24. Campbell PE, Harris CM, Handricks S, Sirimanna T. -Bone conduc-tion auditory brainstem responses in infantis. J Laryngol Otol . 2004; 118:117-22.
25. Saeed J, Coglianese CL, McCormick DP, Chonmaitree T. Otoscopic and tympanometric findings in acute otitis media yielding dry tap at tympanocentesis. Pediatric Infect Dis J . 2006;25(10):960-1. 26. SaesSO, Goldberg TBL, Montovani JC. Secreção na orelha média em
lactentes - ocorrência, recorrência e aspectos relacionados J Pediatr . 2005;81(2): 133-8.
27. Rhodes MC, Margolis RH, Hirsch JE, Napp AP. Hearing Screening in the newborn intensive care nursery: comparison of methods. Otola-ryngol Head Neck Surg . 1999;120:799-808.
28. Capellini SA. Medidas de imitância em crianças nascidas a termo e pré-termo, de 24 horas de vida a seis meses de idade: estudo com-parativo [dissertação de mestrado]. São Paulo: PuC/SP; 1996. 29. Northern J, Downs MP. Hearing in children 5th ed. Philadelphia. PA:
Lippincott Williams, Wilkins; 2001.
30. Silva KA. Achados timpanométricos em neonatos: medidas e inter-pretações [Dissertação]. São Paulo: Pontifícia universidade Católica; 2005.
32. Vartiainem MDE. Otitis Media with effusion in children with congenital or early-onset hearing impairment. J Otolaryngol .2000;29(4):221-3. 33. Keefe DH, Folsom RC, Gorga MP, Vohr BR, Bulen JC, Norton SJ.
Identification of neonatal hearing impairment: ear-canal measu-rements of acoustic admittance and reflectance in neonates. Ear Hear.2000;21:443-61.
34. Ameed RG. The effects of chronic otitis média with effusion on the measurement of transiently evoked.otoacustic emission. Laringoscope . 1995;105:589-95.
35. Carvallo RMM, Ravagnani MP, Sanches SGG. Influência dos padrões timpanométricos na captação de emissões otoacústicas. Acta Awho . 2000;19(1):18-25.
36. Zapala D. Predictive value of high frequency tympanometry and otoacustic emissions in the perinatal period. Poster presented at XV Biennial Symposium of international Evoked Response Audiometry Study Group; 1997.
37. Koivunem P, uhari M, Laitakari K, Alho OP, Luotonem J. Otoacustic emissions and tympanometry in children with otitis media. Ear Hear . 2000;21:212-17.
38. Mckinley AM, Grose JH, Roush J. Multi-frequency tympanometry and evoked otoacoustic emissions in neonates during the first 24 hours of life. J Am Acad Audiol .1997;8:218-23.
39. Soares E, Guerrero SMAG, Azevedo MF. Estudo Comparativo das Triagens Auditivas por Emissões Otoacústicas Evocadas Transientes, Observação Comportamental e Medidas de Emitância Acústica em Crianças com e sem Risco para Deficiência Auditiva. Rev Bras Otor-rinolaringol. 1998;64(3):221-7.
40. Marshall L, Heller LM, Westhusin LJ. Effect of negative middle-ear pressure on transient-evoked otoacoustic emissions. Ear Hmiddle-ear. 1997;18(3):218-26.
41. Himelfarb Mz, Popelka GR, Shanon E. Tympanometry in normal neonates. Speech Hear Res . 1979; 22(1):179-91.
42. Hunter LL, Margolis RH. Multifrequency tympanometry: Current clinical application. Am J Audiol. 1992;1:33-43.
43. Willians MJ, Purdy SC, Barber, CS. High frequency probe tone tympanometry in infants with middle ear effusion. Aust J Otolaryngol.1995;2:169-73.