Efferent auditory system: its
effect on auditory processing
Summary
Fernanda Acaui Ribeiro Burguetti1, Renata Mota
Mamede Carvallo2
1 Doctoral degree, researcher in the Laboratório de Investigação Fonoaudiológica em Audição Humana da FMUSP. 2 Livre-docência (habilitation), associate professor, Speech Therapy Course, Faculdade de Medicina da USP.
Faculdade de Medicina da Universidade de São Paulo.
Address for correspondence: Fernanda Acaui Ribeiro Burguetti - R. Dr José Francisco Graziosi 98 apto. 31 Jardim Judith Sorocaba SP 18047-201. This paper was submitted to the RBORL-SGP (Publishing Manager System) on 12 June 2007. Code 4598.
The article was accepted on 25 August 2007.
A
uditory processing depends on afferent and efferent auditory pathways integrity. The efferent auditory system may be assessed in humans by two non-invasive and objective methods: acoustic reflex and otoacoustic emissions suppression. Aim: Analyze the efferent auditory system activity by otoacoustic emission suppression and acoustic reflex sensitization in human subjects with auditory processing disorders. Method: Prospective study: fifty children with auditory processing disorders (study group) and thirty-eight children without auditory processing disorders (control group) were evaluated using otoacoustic emission with and without contralateral noise; and acoustic reflex with and without contralateral facilitating stimuli. Results: OAE suppression mean value was equal to or less than 1.50 dB for the control group, and equal to or less than 1.26 dB for the study group. The mean sensitization reflex value was equal to or less than 14.60 dB for the study group and equal to or less than 15.21 dB for the control group. There was no statistically significant difference between the responses from the control group and the study group in both procedures.Conclusion: The study group had lower OAE suppression
values and higher acoustic reflex sensitization values when compared to the control group.
Keywords: reflex, otoacoustic emissions, hearing tests, spontaneous, hearing disorders.
original article Rev Bras Otorrinolaringol
INTRODUCTION
The hearing system is composed of integrated afferent and efferent auditory pathways. At lower levels, efferent fibers predominantly emerge from the superior olivary complex nucleus and course towards the cochlea (the efferent olivocochlear tract or the efferent medial system). Although the role of the olivocochlear bundle in hearing is unclear, certain functions have been attributed to the olivocochlear medial system: location of sound sources, auditory attention, improved auditory sensitivity, improved detection of acoustic signals in the presence of noise, and protection.1,2,3
Efferent auditory pathways may be activated by electrical and acoustic stimuli in animals;4,5 this type of activation in humans may be done by two objective non-invasive methods: investigation of acoustic reflexes and suppression of otoacoustic emissions (OAE).6
Acoustic reflex threshold analysis make it possible to assess the role of efferent pathways in controlling the mechanical status of the middle ear and to collect in-formation about brainstem auditory pathways. Acoustic reflex thresholds may be deduced from a high frequency facilitating stimulus presented prior to or simultaneously with a reflex activating tone (sensitization).7 The function of acoustic reflex sensitization is to improve the signal within noise in complex hearing conditions by attenuating the reflex at low frequencies.8
Suppression occurs when medial olivocochlear tract fibers - by outer hair synapse action - attenuate OAE responses in the presence of contralateral noise to attenu-ate the gain from cochlear amplification, thus decreasing cochlear membrane movement.9
Some authors have underlined the importance of OAE suppression when assessing the olivocochlear complex in children with auditory processing disorders, since this complex performs an important role in hearing in the presence of noise.10 One of the main complaints in patients with altered auditory processing is the difficulty in understanding speech in noisy environments. Studies on suppression have shown that this group of patients has decreased or absent OAE suppression, suggesting that the inhibitory effect of the efferent system is decreased.11,12
The year 2000 Consensus Conference on the Diag-nosis of Auditory Processing Disorders in School-aged Children reaffirmed the indication of electroacoustic pro-cedures (OAE and immitance testing), as well as behavioral and electrophysiological test, to increase precision in the diagnosis of auditory processing disorders.13 Use of these procedures for assessment purposes may help advance knowledge about the efferent function in children with altered processing of hearing as characterized by loss of figure-background abilities and auditory closure.
The underlying hypothesis in this study was that the
activity of the efferent auditory system in subjects with al-tered auditory processing presenting speech understanding difficulties in the presence of competing sounds may be decreased, as demonstrated by changes in OAE suppres-sion responses and in acoustic reflex sensitization.
The purpose of this study was to verify efferent auditory system activity using OAE suppression and acous-tic reflex sensitization in subjects with altered auditory processing.
SERIES AND METHOD
This was a prospective study of 88 male and fema-le subjects aged 9 and 10 years, seen at the Serviço de Audiologia Clínica do Centro de Docência e Pesquisa em Fonoaudiologia (Clinical Audiology Unit, Center for Tea-ching and Research in Speech Therapy) of our healthcare institution. The inclusion criterion for the control group (CG) was a normal auditory processing evaluation; the inclusion criterion for the study group (SG) was a diag-nosis of any auditory processing disorder characterized by altered figure-background abilities and auditory closure as identified by Speech with Noise14 and Alternate Dichotic Dissyllable (SSW) tests.15 Both test, which assessed speech understanding in the presence of competing sounds, had to be altered for the purposes of this study.
Subjects had normal auditory thresholds (up to 20 dBNA at 250 to 8000 Hz), normal threshold logoau-diometry, and normal timpanometry. Two groups were generated: a control group (CG) consisting of 38 children (18 males and 20 females) and a study group (SG) con-sisting of 50 children (26 male and 24 female). Subjects - together with their parents or caretakers - were oriented about the aims and procedures of the study; agreement to participate required signing an informed consent form. The institution’s Research Ethics Committee approved the study (protocol nº 145/03).
A GSI 61 - Grason Stadler audiometer, Telephonics TDH 50P headphones, a Panasonic SL- S125 portable CD player and a compact disk with the assessment tests for evaluating auditory processing (elaborated by Pereira and Schochat - 1997) were used for the assessment of audi-tory processing. A middle ear analyzer GSI 33 - Grason Stadler version 2 was used for immitance testing, and an ILO 92 - Otodynamics version 5.61 cochlear emissions analyzer linked to an IBM microcomputer (Pentium IV CPU and colored monitor) was used for OAE emissions suppression testing.
OAE suppression
Tests were done with patients in a seated position on a comfortable seat within an acoustic booth. The first ear to be examined was chosen randomly, and responses were taken after adapting the probe.
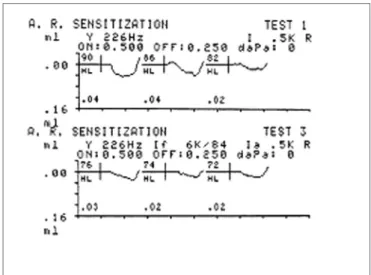
OAE suppression testing was done using clicks as activating stimuli and white noise as suppressing stimuli, generated by the B channel of the device, and presented to the contralateral ear at 60 to 65 dB, in Lyon mode; the signal/noise ratio was between 0 and +5 dB, with a 20 millisecond window (Fig. 1).
A facilitating stimulus at the maximum intensity of the device (114 dB) was presented when the acoustic reflex was absent for investigating acoustic reflex sensitization, as described above.
Ipsilateral acoustic reflex thresholds with and with no contralateral facilitating stimuli were analyzed at the end of the test. This analysis was done by comparing acoustic reflex thresholds with no facilitating stimuli subtracted from acoustic reflexes with contralateral facilitating stimuli. The analysis was done in both groups.
The Wilcoxon and the Mann-Whitney tests were used for the statistical analysis of results. The significance level for statistical inference analysis was 0.05. Statistically significant values are marked with an *, and values tending towards a difference were marked with an #.
RESULTS
Comparative study between ears of the TOAE su-ppression effect
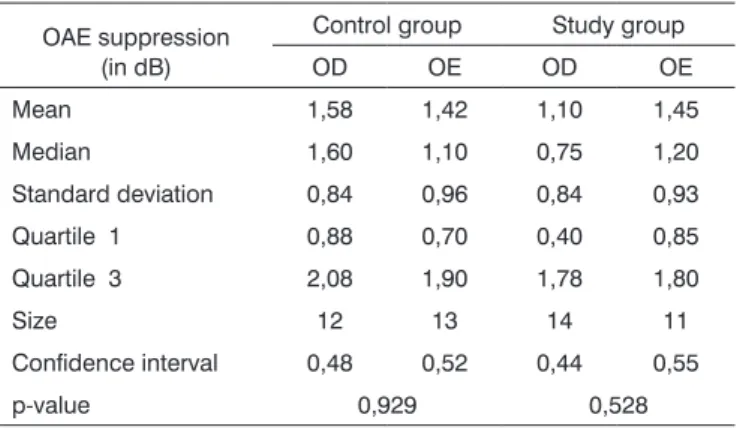
There was no statistically significant difference in the suppression effect between right ears and left ears in both groups (Table 1). There was a right ear advantage in the control group and a left ear advantage in the study group. Thus, right ear and left ear results were grouped in the subsequent analyses.
Comparative study among genders of the TOAE suppres-sion effect
There was no statistically significant difference in suppression between genders in the control group. There was a statistically significant difference between genders in the study group, in which mean TOAE suppression values were higher in females (Table 2).
Figure 1. Otoacoustic emissions in the absence and presence of contralateral white noise - Source: Centro de Docência e Pesquisa - Physical Therapy, Speech Therapy and Occupational Therapy De-partment - FMUSP
The Lyon Mode is used to obtain automatically al-ternated responses with and with no noise every 20 stimuli by means of 200 linear stimuli scans. This mode was used for rapid responses with no need to adjust the probe or the equipment for noise and noiseless conditions.
Next, responses were analyzed separately with and with no competing sounds, considering the general response at intensities above background noise. Response values in the absence of noise were subtracted from the response values with noise in both groups for calculating suppression. Positive suppression values were taken into account for results analysis.
Acoustic reflex sensitization
Ipsilateral acoustic reflex thresholds were measured at 2 dB intervals, with no facilitating stimuli, at 500, 1000, 2000 and 4000 Hz, for acoustic reflex sensitization. Ipsilate-ral acoustic reflex thresholds with contIpsilate-ralateIpsilate-ral facilitating stimuli were then obtained (pure tone at 6000 Hz), at the same intensity at which the threshold had been measured without the facilitating stimulus (Fig. 2).
Table 1. Comparative analysis among OAE suppression values in the right ear (RE) and left ear (LE) in the control and study groups.
OAE suppression (in dB)
Control group Study group
OD OE OD OE
Mean 1,58 1,42 1,10 1,45
Median 1,60 1,10 0,75 1,20
Standard deviation 0,84 0,96 0,84 0,93
Quartile 1 0,88 0,70 0,40 0,85
Quartile 3 2,08 1,90 1,78 1,80
Size 12 13 14 11
Confidence interval 0,48 0,52 0,44 0,55
p-value 0,929 0,528
Table 2. Comparative analysis among OAE suppression values in females (F) and males (M) in the control and study groups.
OAE suppression (in dB)
Control group Study group
F M F M
Mean 1,48 1,54 1,57 0,85
Median 1,30 1,30 1,45 0,60
Standard deviation 0,96 0,76 0,90 0,69
Quartile 1 0,73 1,00 0,85 0,30
Quartile 3 1,98 2,10 1,88 1,15
Size 18 7 14 11
Confidence interval 0,44 0,56 0,47 0,41
p-value 0,650 0,032*
Table 3. Comparative analysis among OAE suppression values in the control group (CG) and the study group (SG).
OAE suppression (in dB) CG SG
Mean 1,50 1,26
Median 1,30 1,00
Standard deviation 0,89 0,88
Quartile 1 0,80 0,60
Quartile 3 2,00 1,80
Size 25 25
Confidence interval 0,35 0,34
p-value 0,277
Comparative study among study and control groups of the TOAE suppression effect
There was no statistically significant difference between groups. Control group suppression values were higher compared to those of the study group (Table 3).
Comparative study among ears of acoustic reflex sensiti-zation
There was a statistically significant difference betwe-en right ears and left ears only at 2000 Hz in the control group. There was no difference in acoustic reflex sensiti-zation between ears in the study group (Table 4). As the statistical difference was found in only one comparison, the results of both ears were grouped together for subsequent acoustic reflex sensitization analyses.
Comparative study among genders of acoustic reflex sen-sitization
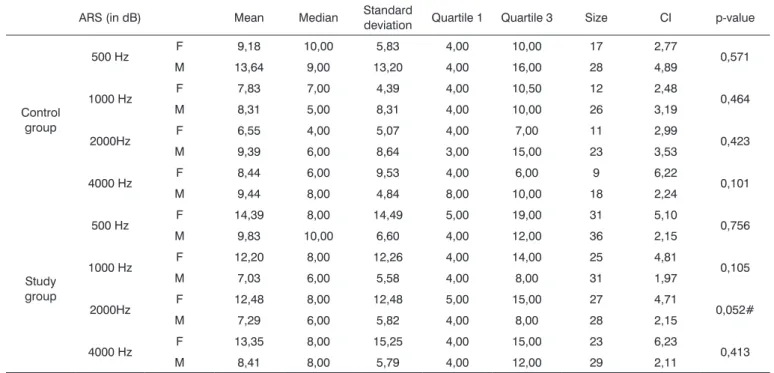
There was no statistically significant difference between genders in the control group. There was a trend towards a difference only at 2000 Hz in the study group.
Mean acoustic reflex sensitization values in females were higher than those in males (Table 5).
Comparative study among groups of acoustic reflex sen-sitization
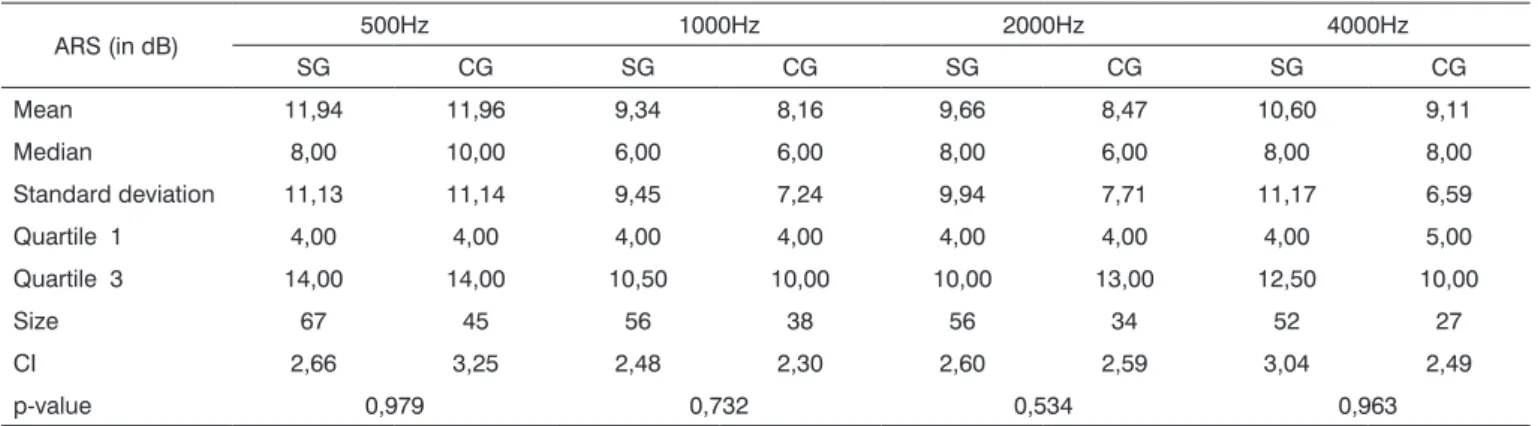
There was no statistically significant difference between the control and study groups at all investigated frequencies. Mean acoustic reflex sensitization values were higher in the study group compared to the control group at all investigated frequencies, except at 500 Hz (Table 6).
DISCUSSION
This study was planned to identify differences in auditory response patterns resulting from the efferent function in children with a diagnosis of auditory proces-sing disorders and in children with normal auditory de-velopment, based on the hypothesis that efferent auditory function is compromised in patients with altered auditory processing. Electroacoustic procedures were chosen and their responses were monitored under conditions with and with no activation of auditory efferent pathways. The fact that different responses were found for efferent pathway activation in OAE electroacoustic and acoustic reflex responses in both groups may provide clues about the functional differences associated with auditory pro-cessing disorders.
Interest in investigating variables that could diffe-rentiate electroacoustic responses in groups of children with and with no auditory processing disorders in this study was motivated by the encouraging results on OAE suppression tests in similar groups.
Table 5. Comparative analysis among acoustic reflex sensitization (ARS) values in females (F) and males (M) in the control and study groups. ARS (in dB) Mean Median Standard
deviation Quartile 1 Quartile 3 Size CI p-value
Control group
500 Hz F 9,18 10,00 5,83 4,00 10,00 17 2,77 0,571
M 13,64 9,00 13,20 4,00 16,00 28 4,89
1000 Hz F 7,83 7,00 4,39 4,00 10,50 12 2,48 0,464
M 8,31 5,00 8,31 4,00 10,00 26 3,19
2000Hz F 6,55 4,00 5,07 4,00 7,00 11 2,99 0,423
M 9,39 6,00 8,64 3,00 15,00 23 3,53
4000 Hz F 8,44 6,00 9,53 4,00 6,00 9 6,22 0,101
M 9,44 8,00 4,84 8,00 10,00 18 2,24
Study group
500 Hz F 14,39 8,00 14,49 5,00 19,00 31 5,10 0,756
M 9,83 10,00 6,60 4,00 12,00 36 2,15
1000 Hz F 12,20 8,00 12,26 4,00 14,00 25 4,81 0,105
M 7,03 6,00 5,58 4,00 8,00 31 1,97
2000Hz F 12,48 8,00 12,48 5,00 15,00 27 4,71 0,052#
M 7,29 6,00 5,82 4,00 8,00 28 2,15
4000 Hz F 13,35 8,00 15,25 4,00 15,00 23 6,23 0,413
M 8,41 8,00 5,79 4,00 12,00 29 2,11
Key: CI = confidence interval
Table 4. Comparative analysis among acoustic reflex sensitization (ARS) values in right ears (RE) and left ears (LE) in the control and study groups.
ARS (in dB) Mean Median Standard
deviation Quartile 1 Quartile 3 Size CI p-value
Control group
500 Hz OD 13,91 10,00 13,54 5,00 15,00 23 5,54 0,756
OE 9,91 9,00 7,70 4,00 12,00 22 3,22
1000 Hz OD 9,71 8,00 8,47 4,00 12,00 21 3,62 0,439
OE 6,24 4,00 4,94 4,00 8,00 17 2,35
2000Hz OD 9,44 6,00 9,20 4,00 13,00 18 4,25 0,018*
OE 7,38 6,00 5,69 2,00 11,00 16 2,79
4000 Hz OD 10,17 8,00 8,16 5,50 11,50 12 4,61 0,674
OE 8,27 8,00 5,18 5,00 10,00 15 2,62
Study group
500Hz OD 12,43 8,00 11,20 6,00 13,00 35 3,71 0,976
OE 11,41 6,00 11,20 4,00 14,00 32 3,88
1000Hz OD 9,90 6,00 11,09 2,50 13,00 30 3,97 0,419
OE 8,69 8,00 7,29 4,50 9,50 26 2,80
2000Hz OD 10,93 8,00 12,37 4,00 10,00 29 4,50 0,234
OE 8,30 8,00 6,34 4,00 10,00 27 2,39
4000Hz OD 11,30 8,00 12,02 4,00 15,00 27 4,53 0,755
OE 9,84 8,00 10,37 4,00 12,00 25 4,07
that this population tends to present altered acoustic reflex thresholds; thus the importance of investigating acoustic reflex sensitization in this population group.
Discussion about the results of TOAE suppression
There was no statistically significant difference in the results of TOAE suppression between right and left ears. Right ear values were, however, higher than left ear values in the control group, which is similar to what has been described in other studies.16,17 TOAE suppression in the study group was higher in the left ear compared to the right ear. Lack of right ear dominance in individuals with altered auditory processing may be explained by the fact that right ear advantage is usually interpreted as reflec-ting left hemisphere dominance for speech and language processing and ipsilateral auditory pathway inhibition. As subjects with altered auditory processing have difficulties in dichotic conditions, dominance of left ear suppression relative to the right ear may represent a non-existence of left hemisphere dominance.11,18
There was no statistically significant gender diffe-rence in all suppression conditions in this study. However, control group males had higher mean TOAE suppression values than females. Mean suppression values were hi-gher in females in the study group. This may be related to the fact that males are at a higher risk for altered au-ditory processing and oral communication in general. A hormone-related (testosterone) hypothesis may explain a higher incidence of males with developmental conditions, possibly due to a smaller corpus callosum. The splenium (posterior portion of the corpus callosum), responsible for auditory and visual transmission between brain hemisphe-res, is generally wider and more bulbous in females.19 Females may thus be able to integrate visual and auditory information between both hemispheres more effectively than males, which may explain decreased OAE responses in the presence of contralateral noise.
The mean suppression value was 1.50 dB in the control group and 1.26 dB in the study group. The stan-dard deviation showed that there was not a homogeneous distribution between groups. TOAE suppression values vary, as shown in the literature (see Chart 1).
The differences among values shown in Table 7 may be explained by variations in the parameters used in each study. Thus, suppression values in each of these studies cannot be compared directly, since they were collected under different conditions and with different stimuli. Lack of homogeneity of suppression values was also found in another study,24 wherein the authors described that similar presented stimuli for OAEs yields different responses in different subjects, and that such intersubject variability is reflected in suppression levels.
There was no statistically significant difference when comparing suppression between the control and study groups. However, suppression values in the control group were higher compared to the study group, which suggests a decreased inhibitory effect of the efferent auditory system in children with auditory processing disorders; this findings has been reported in other studies.11,18 Hearing, however, is a complex mechanism involving many peripheral (such as the ear) and central (such as the auditory cortex) ana-tomical structures. Each one of these has a specific and determinant role in hearing. Given the complexity of this system, it is impossible to attribute a single function to any structure, as the system operates as a whole, and any ability may involve more than one structure. Thus, the ability to understand speech in noise, although attributed to the efferent auditory system, surely involves other anatomical structures such as the reticular formation. Evidence sug-gests that when the ascending reticular activation system is stimulated the cortex becomes more alert and focused. The system thus reacts more readily to an important stimulus compared to a non-important stimulus. This may be one of the mechanisms involved in selective attention and the ability to hear in the presence of noise.25
Table 6. Comparative analysis among acoustic reflex sensitization (ARS) in the control group (CG) and the study group (SG).
ARS (in dB) 500Hz 1000Hz 2000Hz 4000Hz
SG CG SG CG SG CG SG CG
Mean 11,94 11,96 9,34 8,16 9,66 8,47 10,60 9,11
Median 8,00 10,00 6,00 6,00 8,00 6,00 8,00 8,00
Standard deviation 11,13 11,14 9,45 7,24 9,94 7,71 11,17 6,59
Quartile 1 4,00 4,00 4,00 4,00 4,00 4,00 4,00 5,00
Quartile 3 14,00 14,00 10,50 10,00 10,00 13,00 12,50 10,00
Size 67 45 56 38 56 34 52 27
CI 2,66 3,25 2,48 2,30 2,60 2,59 3,04 2,49
p-value 0,979 0,732 0,534 0,963
All of this may explain why there was no statisti-cally significant difference among suppression values in the groups with and with no altered auditory processing even when there were different mean responses in each group.
Discussion of acoustic reflex sensitization results
There was no statistically significant mean difference in the comparative analysis of acoustic reflex sensitization values between right and left ears in the study group. A statistically significant difference was found between ears only at 2000 Hz in the control group wherein right ear values were higher. Another study26 found no statistically significant difference between ears in females with no auditory alterations; however, left ear mean values were higher at all investigated frequencies compared to the right ear.
The comparison of acoustic reflex sensitization between genders in the control group revealed that there was a statistically significant difference at 500, 1000 and 2000 Hz, with higher mean values in males. There was a
trend towards a difference at 2000 Hz in the study group wherein mean values in females were higher compared to males. A study27 about sensitization in neonates at no risk for auditory disorders found no gender differences. Females, however, had higher sensitization means compa-red to males. Such gender differences may be explained by the same reasons given for OAE suppression value comparisons.
Higher sensitization values were found at 500 Hz, with a mean 11.94 in the study group and a mean 11.96 in the control group. There is significant variability among acoustic reflex sensitization values in the literature, as shown in Chart 2.
Acoustic reflex sensitization differences among va-lues - as with suppression - may be attributed to stimuli variations (whether ipsi or contralateral) and frequency and intensity features; there may also be differences in the samples.
There was no statistically significant difference in sensitization values between groups with and with no
Chart 1. Distribution of mean OAE suppression values in various studies.
Authors Year Study population OAE suppression
Musiek et al.20 1994 General population 2 a 3 dB
Ryan and Kemp21 1996 Normal hearing -2,6 a 3,8 dB
Hood et al.22 1996 Normal hearing 0,33 a 1,38 dB
Muchnik et al.11 2004 Auditory processing disorders 0,89 a 1,62 dB
Kumar and Vanaja23 2004 Children with no school complaints 0,87 a 1,6 dB
Clarke et al.18 2006 Specific language disorders 2,4 a 2,5 dB
Sanches and Carvallo12 2006 Auditory processing disorders 1,04 a 1,39 dB
This study 2007 Normal hearing 1,31 dB
This study 2007 Auditory processing disorders 1,11 dB
Chart 2. Distribution of mean acoustic reflex sensitization values in various studies.
Authors Year Study population Sensitization
Hughes28 1954 Normal hearing 6 dB
Deutsch29 1973 Normal hearing 4 a 6 dB
Chobot, Wilson30 1977 Normal hearing Até 5 dB
Blood, Greenberg 31 1981 Normal hearing 21,9 dB
Blood, Greenberg 31 1981 Sensorineural hearing loss 6,1 dB
Jeck et al.8 1983 Normal hearing 10 a 12 dB
Carvallo and Soares26 2004 Normal hearing 6,7 a 17,2 dB
Soares and Carvallo27 2006 Normal hearing neonates 7,2 a 21dB
This study 2007 Normal hearing 8,71 a 15,21 dB
altered auditory processing. Study group values, however, were higher than control group values at the frequencies that were investigated (except at 500 Hz). As acoustic reflex sensitization is related with the efferent auditory system, and that one of the functions of this system is cochlear protection against intense sound, it may be inferred that this system is more effective (increased inhibitory effect) in subjects with altered auditory processing, which would in-terfere with speech understanding in the presence of com-peting sounds. Furthermore, efferent auditory pathways are activated in the presence of loud sound, altering the cochlear mechanism by means of the external hairy cells, which would decrease the traveling wave magnitude.1
A lower TOAE suppression effect and higher acous-tic reflex sensitization in the study group may be related to the stimulus intensity used in both procedures, and conse-quently to the different functions of the activated efferent auditory system. The maximum suggested suppression intensity for evaluating efferent auditory function without middle ear muscle interference is 70 dB. Sensitization, however, requires obtaining an acoustic reflex threshold at a higher intensity to reach a more peripheral efferent portion. It may thus be inferred that the efferent portion evaluated by TOAE suppression is related with improved speech understanding function in noisy environments, as ambient noise occurs at an intensity similar to that used in the test. The stimulus intensity in sensitization is higher and may harm the cochlea if used for prolonged time pe-riods. Thus it may be suggested that the efferent portion evaluated by this procedure is related with the cochlear protection function against intense sounds.
It is important to continue the investigation of ob-jective methods for assessing subjects with auditory pro-cessing disorders, as this population group had different suppression and acoustic reflex sensitization responses.
CONCLUSION
Mean OAE suppression values were higher in the control group compared to the study group, although this difference was not statistically significant.
Mean acoustic reflex sensitization values were hi-gher in the study group compared to the control group, although this difference was not statistically significant.
REFERENCES
1. Hill JC, Prasher DK, Luxon LM. Evidence efferent effects on auditory afferent activity and their functional relevance. Clin Otolaryngol 1997; 22:394-402.
2. Bruel MLF, Sanchez TG, Bento RF. Vias auditivas eferentes e seu papel no sistema auditivo. Arq Otorrinolaringol 2001;5(2):62-7.
3. Hood LJ, Berlin CI. Clinical applications of otoacoustic emissions. In: Berlin CI, Hood LJ, Ricci A. (Eds.) Hair cells micromechanics and otoacoustic emissions: new developments. San Diego: Singular
Publishing - Thomsen Learning;2001. p. 121-37.
4. Liberman MC, Brown MC. Physiology and anatomy of single olivoco-chlear neurons in the cat. Hear Res 1986;24(1):17-36.
5. Popelar J, Valvoda J, Syka J. Acoustically and electrically evoked con-tralateral suppression of otoacoustic emissions in guinea pigs. Hear Res 1999;135(1-2):61-70.
6. Hood LJ. A review of objective methods of evaluating auditory neural pathways. Laryngoscope 1989;109(11):1745-8.
7. Kumar A, Barman A. Effect of efferent-induced changes on acoustical reflex. Int J Audiol 2002;41:144-7.
8. Jeck LT, Ruth RA, Schoeny ZG. High frequency sensitization of the acoustic reflex. Ear Hear 1983;4(2):98-101.
9. Guinan Jr. JJ, Backus BC, Lilaonitkul Aharonson V. Medial olivocochlear efferent reflex in humans: otoacoustic emission (OAE) measure-ment issues and the advantages of stimulus frequency OAES. JARO 2003;4:521-40.
10. Chermak GD, Musiek FE. Eletrophysiologic assessment of central auditory processing disorders. In: Chermak GD, Musiek FE. Central Auditory processing disorders: new perspectives. San Diego: Singular Publishing Group;1997. p. 129-50.
11. Muchnik C, Roth DAE, Othman-Jebara R, Putter-Katz H, Shabtai EL, Hildesheimer M. Reduced medial olivocochlear bundle system function in children with auditory disorders. Audiol Neurootol 2004;9:107-14.
12. Sanches SGG, Carvallo RMM. Contralateral suppression of transient evoked otoacoustic in children with auditory processing disorders. Audiol Neurootol. 2006;11:366-372.
13. Jerger J, Musiek FE. Report Of The consensus conference on the diagnosis of auditory processing disorders in school aged children. J Am Acad Audiol 2000;11:467-74.
14. Schochat E, Pereira LP. Teste de Fala com Ruído. In: Pereira LD. Schochat E. Processamento Auditivo Central. Manual De Avaliação. São Paulo: Lovise 1997: 99-102.
15. Borges ACC. Adaptação do teste SSW para a língua portuguesa: nota preliminar. Acta Awho. 1986;5 (Suppl 1): 38-40.
16. Silva CS. A supressão da emissão otoacústica transiente na presença de ruído branco contralateral. [Monografia]. São Paulo: Escola Paulista de Medicina;1997.
17. Durante AS, Carvallo RMM. Contralateral suppression of otoacoustic emission in neonates. Int J Audiol 2002;41:211-5.
18. Clarke EM, Ahmmed A, Parker D, Adams C. Contralateral suppression of otoacoustic emissions in children with specific language impair-ment. Ear Hear 2006;27(2):153-60.
19. Katz J, Wilde L. Desordens do processamento auditivo. In: Katz J. Tratado de Audiologia Clínica. 4ª. Ed. São Paulo: Manole;1999. p. 486-98 .
20. Musiek FE, Smurzynski J, Bornstein SP. Otoacoustic emission testing in adults: an overview. AM J Otol. 1994;15 (Suppl.1):21-8.
21. Ryan S, Kemp DT. The influence of evoking stimulus level on the neural suppression of transient evoked otoacoustic emissions. Hear Res 1996;94(1-2):140-7.
22. Hood LJ, Berlin CI, Hurley A, Cecola RP, Bell B. Contralateral suppres-sion of transient-evoked otoacoustic emissuppres-sions in humans: intensity effects. Hear Res 1996;101(1-2):113-8.
23. Kumar AU, Vanaja CS. Functioning of olivocochlear bundle and speech perception in noise. Ear Hear 2004;25(2):142-6.
24. De Ceulaer GD, Yperman M, Daemers K, Driessche KV, Somers T, Offeciers FE, Govaerts PJ. Contralateral suppression of transient evoked otoacoustic emissions: normative data for a clinical test set-up. Otol Neurotol 2001;22:350-5.
26. Carvallo RMM, Soares JC. Efeito do estímulo facilitador no limiar de reflexo acústico. Rev Bras Otorrinolaringol 2004;70(2): 200-6. 27. Soares JC, Carvallo RMM. Redução do limiar do reflexo acústico
em neonatos sem risco auditivo. Rev Bras Otorrinolaringol 2006; 72(1):49-54.
28. Hughes JR. Auditory sensitization. J Acoust Soc Am 1954; 26(6):1064-70.
29. Deutsh L. Auditory sensitization in the human stapedius reflex. J Aud Res 1973;13:301-4.
30. Chobot JL, Wilson WR. The effect of sensitization on the acoustic reflex as a function of frequency. J Aud Res 1977;17:99-104. 31. Blood IM, Greenberg HJ. Low-level acoustic reflex thresholds.