Brazilian Journal of Physics, vol. 35, no. 3B, September, 2005 741
Monte Carlo Simulation of a Position Sensitive Gamma Ray Detector
Marcelo de Almeida and Maur´ıcio Moralles
Centro do Reator de Pesquisas, Instituto de Pesquisas Energ´eticas e Nucleares, Caixa Postal 11049, CEP 05422-970, S˜ao Paulo, SP, Brazil
Received on 13 November, 2004
The Monte Carlo method was employed to obtain the response of a position sensitive gamma ray detector. The basic unit consists of a scintillator bar coupled to two photon detectors. Determination of the position of interaction is obtained from the ratio of the light intensity measured at each extremity of the bar. Association of two or more detectors of this type can be used to build a system with potential use in positron emission tomography. For practical purposes, a CsI(Tl) bar with dimensions of 15×1×1 cm3was considered. Simu-lations were performed with the GEANT4 toolkit, using the physical processes of low-energy electromagnetic extension. Light attenuation coefficient and energy resolution of CsI(Tl) bars were included according to data found in the literature. Results obtained from detector irradiation with 511 keV annihilation photons indicate that the position of interaction can be determined with uncertainty of 3 mm. Simulations of positron sources placed between two detectors were also performed and two dimensional images were obtained.
1. INTRODUCTION
Nowadays positron emission tomography (PET) systems are widely used in nuclear diagnostic medicine. In this ima-ging technique positron-emitting isotopes are introduced into the patient, and the two 511 keV photons emitted following electron-positron annihilation are observed in coincidence. Typical PET scanners have many detection basic units, for-med by several small scintillator crystals coupled to position-sensitive photomultiplier tubes [1]. The aim of this work is to study a new concept of PET systems, in which the basic unit consists of a small CsI(Tl) scintillator bar coupled to two photodiodes in its extremities. With this type of basic unit, it would be possible to build a low-cost compact PET system.
This study has been developed through computer simula-tions using the Monte Carlo method, implemented with the GEANT4 toolkit [2]. CsI(Tl) crystal was chosen because its emission spectrum have the maximum at 550 nm, which is suitable for photodiode readout. Recent developments on the growth of CsI(Tl) crystals allows the production of this scin-tillator with low afterglow, which makes it better suited for tomography applications [3]. Parameters for the CsI(Tl) bars were extracted from the experimental work of Labanti et al. [4].
2. SIMULATION OF BASIC DETECTION UNIT
The detector simulation was performed by using the low-energy electromagnetic extension of the GEANT4 toolkit. GEANT4 is a package of C++ classes that allows the deve-lopment of codes for Monte Carlo calculations which invol-ves the interaction of radiation with matter. Recent versions of GEANT4 have a low-energy extension for electromagne-tic processes, which was validated for use in medical physics applications [5].
In this work, the considered interactions were Rayleigh scattering, Compton scattering, photoelectric effect, ioniza-tion and bremsstrahlung. The simulated basic detector unit consisted of a small CsI bar of dimensions 15×1×1 cm3
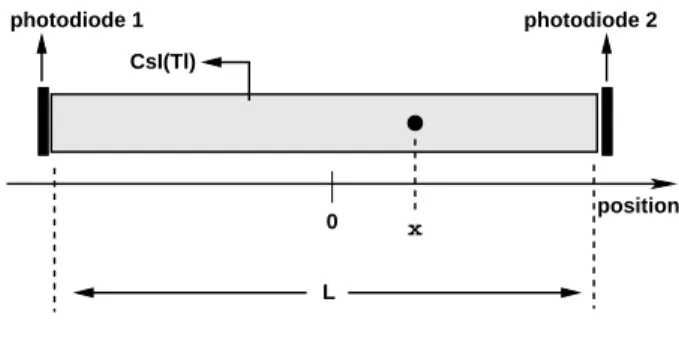
cou-pled to two photodiodes at the scintillator bar extremities (Fig. 1). The chosen dimensions were based in the experimental work of Labanti et al. [4], from where we extracted parame-ters for the modelling of the optical and electronic response of this detector. Since Tl concentrations are very low in real scintillators, assuming the bar material as pure CsI becomes a good approximation for the simulation purpose.
CsI(Tl)
0
L x
position photodiode 2 photodiode 1
FIG. 1: Scheme of the basic detection unit.
The light intensity observed by each photodiode corres-ponds to a fraction of the light emitted by the radiation in-teraction, attenuated along the bar until it reaches the photo-diode. According to the scheme shown in Fig. 1, the signals E1andE2, of the left and right photodiodes respectively, are calculated through
E1=KE0
2 exp(−α( L
2+x)), (1)
and
E2=KE0
2 exp(−α( L
2−x)), (2)
whereKis a constant,E0is the energy deposited in detector,L is the crystal bar length andαis the light attenuation coeffici-ent. The value ofα=0.099 cm
742 Marcelo de Almeida and Maur´ıcio Moralles
0 50 100 150 200 channel
0 500 1000 1500
counts/channel
right photodiode signal left photodiode signal
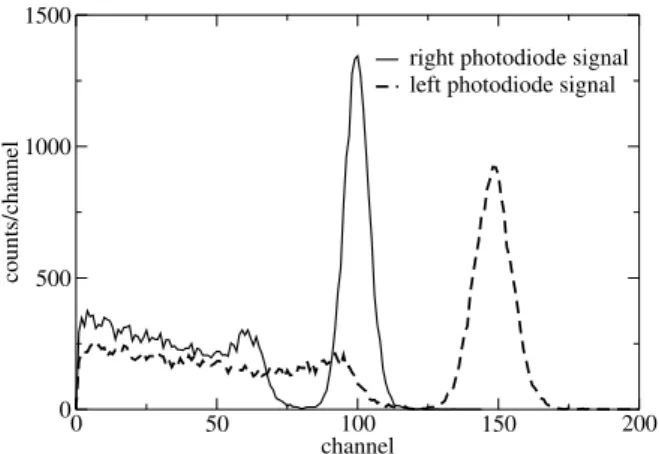
FIG. 2: Photodiode signals for incidence position of 5.5 cm relative to the left extremity of the bar.
The position of interaction are determined from the signals of the photodiodes through the expression [6]
x=2α1 lnE2
E1. (3)
The position sensitivity was obtained by simulating a well collimated source of 511 keV gamma rays placed in different positions. The gamma rays were directed perpendicular to the surface of the bar at different distances relative to the ex-tremities. A Gaussian dispersion corresponding to an energy resolution of 10% (FWHM) was applied to the photodiode re-adout signals (E1andE2). This corresponds to characteristic energy resolution for CsI(Tl) [6]. Fig. 2 shows spectra of the signals of each photodiode for incidence position of 5.5 cm relative to the left extremity of the bar.
The position was calculated for several incident points and its uncertainty was determined as 0.32 cm in the central region of the bar, excluding 2.5 cm of both extremities. This result is in agreement with the experimental one [4]. Deterioration of the energy resolution was observed when the interactions occur at distances of less than 2.5 cm from the extremities of the detector bar.
3. TWO DETECTORS SYSTEM
In order to evaluate a system that allows the determination of the position of a positron source in space, an arrangement composed by two parallel detectors at a distance of 15 cm was simulated as shown in Fig. 3. The source was positioned between the detector bars, and emitted two 511 keV photons in opposite sense, with direction given by a random angle in the range of 360 degrees.
The simulation provided the signals from the photodiodes readout, and the position of interaction in both crystal bars were calculated for each event. We assume one event as the set of interactions and performed calculations from the radi-ation emission till the readout of the photodiodes. One event provides two pairs of numbers, each pair corresponding to the photodiode readout of one bar.
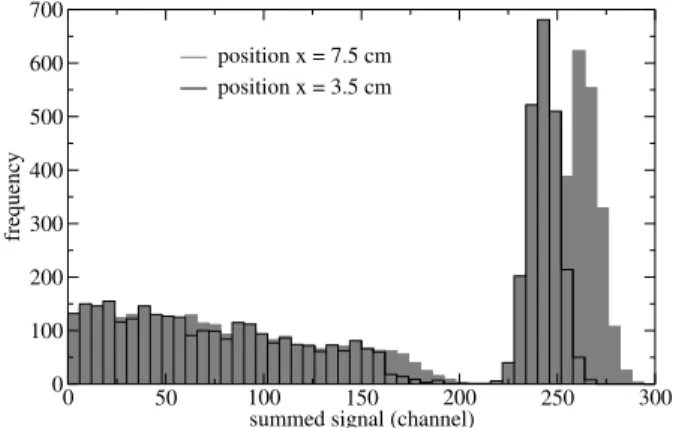
Three validation conditions were applied to the data. Every event which did not satisfy one of those conditions was exclu-ded. At first, all events with no signal in one of the detector bars were excluded, which means that there was no interaction in one of the bars. The second condition validated the interac-tion posiinterac-tion: all events with interacinterac-tion posiinterac-tion determined as less than 2.5 cm from any detector extremity were conside-red not valid, because of the resolution deterioration mentio-ned above. This condition limited the usable region to 10 cm centered at the midpoint of the bar. Finally, the third condi-tion eliminated events with partial absorpcondi-tion of the 511 keV energy. This condition excluded Compton scattered photons in either of the crystal bars. It is well known that Compton scattering in the detectors and in the environment can produce wrong determination of the source position. Fig. 4 shows that when total absorption of the 511 keV photons occurs in the crystal bar, the sum of the signals of both photodiodes is at least in channel 200. This value was used as threshold for the third validation condition.
4. VISUALIZATION OF THE SYSTEM RESPONSE
A simple algorithm was used to visualize the response of the system, which was performed by summing lines in a discrete plane represented by a matrix. For each event one straight line was plotted from the determined positions of in-teractions in the detector bars, as shown in Fig. 5. Counts are added to the cells of the matrix that are crossed by the line. After several events, in the case where there is only one source, the cell with the largest number of counts corresponds to the source position.
An example with five sources is shown in the surface plot of Fig. 6. In this case the grid has 20×20 cells (each cell has 5×
5 mm2), the sources have the same activity and were placed in positions corresponding to cells at(5,5),(5,15),(10,10), (15,5)and(15,15). Although this method of visualization is not suitable to determine the distribution of sources in a realistic case of medical imaging, peaks are observed in Fig. 6, corresponding to the five source positions.
position X
position Y
✁
object source
Brazilian Journal of Physics, vol. 35, no. 3B, September, 2005 743
0 50 100 150 200 250 300
summed signal (channel) 0
100 200 300 400 500 600 700
frequency
position x = 7.5 cm position x = 3.5 cm
FIG. 4: Summed signal (E1+E2) for incidence positions of 3.5 and 7.5 cm relative to the left extremity of the bar.
FIG. 5: Representation of a line defined by one event in the discrete plane between the two detectors.
Z
Y
X
FIG. 6: Surface plot of the summed lines for five sources.
5. CONCLUSION
This work presents a successfully application of GEANT4 low-energy extension in a problem of medical physics inte-rest. The simulation of the studied position sensitive detector was in agreement with experimental results and provided sup-port for an application in tomography. The visualization of the system response is very limited for medical imaging purpose, although the results encourage development of more sophisti-cated method for image reconstruction.
Acknowledgments
This research was supported by CNPq (Conselho Nacional de Desenvolvimento Cientfico e Tecnolgico - Brasil).
[1] W.W. Moses, Nucl. Instr. and Meth. A471, 209 (2001). [2] S. Agostinelli et al., Nucl. Instr. and Meth. A506, 250 (2003). [3] Products catalogue of Moltech GmbH. Website
http://www.mt-berlin.com.
[4] C. Labanti et al, Nucl. Instr. and Meth. A310, 327 (1991).
[5] J-F. Carrier, L. Archambault, L. Beaulieu, Med. Phys.31, 484 (2004).