Article
Printed in Brazil - ©2017 Sociedade Brasileira de Química0103 - 5053 $6.00+0.00
*e-mail: [email protected]
†In memoriam
Coencapsulation of
trans
-Dehydrocrotonin and
trans
-Dehydrocrotonin:hydroxypropyl-
β
-cyclodextrin into Microparticles
Waldenice A. Morais,a,b Benício de Barros Neto,c,† Isabella M. F. Cavalcanti,a
Francisco H. Xavier Junior,a Nereide S. Santos-Magalhãesa and Maria Aparecida M. Maciel*,d
aLaboratório de Imunopatologia Keizo-Asami (LIKA), Universidade Federal de Pernambuco (UFPE), Av. Prof. Moraes Rego, 1235, Cidade Universitária, 50670-901 Recife-PE, Brazil
bDepartamento de Farmácia, Universidade Federal do Rio Grande do Norte (UFRN), Campus Universitário, s/n, Lagoa Nova, 59012-570 Natal-RN, Brazil
cDepartamento de Ciências Exatas e da Natureza, Universidade Federal de Pernambuco (UFPE), Av. Prof. Luís Freire, s/n, Cidade Universitária, 50740-540 Recife-PE, Brazil
dDepartamento de Química, Universidade Federal do Rio Grande do Norte (UFRN), Campus Universitário, s/n, Lagoa Nova, 59078-970 Natal-RN, Brazil
The aim of this study was to develop and characterize poly-ε-caprolactone (PCL) and poly(D,L-lactic-co-glycolic)-acid (PLGA) microparticles containing coencapsulated trans-dehydrocrotonin
(t-DCTN) and t-DCTN:hydroxypropyl-β-cyclodextrin inclusion complex (t-DCTN:HP-β-CD),
with t-DCTN loaded at concentrations ranging from 11.25 to 45.00 mg. A preformulation study
was carried out using a 24-1 fractional factorial design. Microparticles were prepared using the
double w/o/w emulsion-solvent evaporation method. The coencapsulated t-DCTN:HP-β-CD-loaded
PLGA microparticles (t-DCTN/t-DCTN:HP-β-CD/PLGA-MPs) presented a smaller particle
size (9.6 ± 0.1 µm) and higher drug loading (13.93 ± 0.05%, corresponding to 90.1 ± 0.3% of
encapsulation efficiency, EE) and t-DCTN-loaded PLGA microparticles (t-DCTN/PLGA-MPs)
presented particle size of 37.0 ± 0.2 µm and drug loading of 10.12 ± 0.01% (EE of 71.2 ± 0.1%).
The coencapsulation of t-DCTN and t-DCTN:HP-β-CD into PLGA microparticles increased drug
loading (50%) and improved the drug controlled release (k2 = 0.0475 and De = 0.0475 × 10⁻¹¹ cm2 s-1).
Taking into account these findings, new oral formulation of PLGA microparticles containing
coencapsulated t-DCTN and t-DCTN:HP-β-CD are available as biocompatible drug delivery
systems for further pharmacological purposes.
Keywords: trans-dehydrocrotonin, cyclodextrin, PLGA microparticles, coencapsulation, fractional factorial design
Introduction
The diterpene 19-nor-clerodane trans-dehydrocrotonin (t-DCTN) is the major compound isolated from the stem bark of Croton cajucara Benth (Euphorbiaceae).1
Earlier studies showed t-DCTN as an important bioactive compound that presents numerous biological activities, among them anti-ulcerogenic,2 anti-tumorigenic3 and
anti-glycemic.4 However, the therapeutic applications of
this natural product are hindered by the
t-DCTN-dose-dependent cytotoxicity in hepatocytes5 and also its low
solubility in water.1 These problems could be solved by
the encapsulation of t-DCTN into polymeric delivery systems that modulate its therapeutic dose, bioavailability and toxic effects.
(PCL) and poly(D,L-lactic-co-glycolic)-acid (PLGA), are the most widely used materials in the preparation of drug delivery systems. Several methods have been described to prepare microparticles, including double emulsion-solvent evaporation.6-10
Microparticle characteristics such as particle size, drug encapsulation efficiency and drug release properties can be affected by the concentration and viscosity of solvent, cosolvent, stabilization, surfactant, drug and polymer types. These variables effects can be quantitatively assessed by means of factorial experimental design, which is usually the starting point for the optimization of pharmaceutical formulations.11
Inclusion complexes of drugs with cyclodextrins (CDs) have been entrapped into microparticles in order to optimize the properties of solubility, stability, release and therapeutic of the biocompounds.12,13 Based on a
novel approach aiming at controlled profile for release of hypnotic agent zolpidem (ZP) with simultaneous use of hydroxypropyl-β-cyclodextrin (HP-β-CD) added to the aqueous phase and ZP to the organic phase on PLGA and poly(DL-lactide) (PDLLA) microparticles, it was possible to evaluate the coencapsulated effect of free drug ZP and HP-β-CD.14 Generally the coencapsulation strategy refers
to simultaneous encapsulation of different molecules such as drugs, markers, chemical entities, polymers.14,15
HP-β-CD is a cyclodextrin (CD) with a large hydrophobic cavity (0.70 nm) and is well tolerated in human beings, which turns it suitable for in vivo applications. HP-β-CD is the preferable cyclodextrin derivative on the pharmaceutical industry to be used for improving drug solubility or drug complexation, mainly because of its highly water-solubility and low toxicity, and the capability to form more stable drug-inclusion complexes.16-18
In this sense, trans-dehydrocrotonin was earlier complexed with β-cyclodextrin and the t-DCTN-inclusion complex showed to be able to reduce t-DCTN cytotoxicity in both rat hepatocytes (3.5-fold; IC50 = 500 and 144 µM)
and V79 fibroblasts (1.7-fold; IC50 = 676 and 400 µM) for
free and complexed drug, respectively.19
In the sequence, it was developed a new formulation such as t-DCTN-loaded PLGA microparticles and for that it was achieved high drug encapsulation efficiency (85.5 ± 3.9%).20 This system presents an initial release of
19.4% at 2 h and attained 55.6% maximum drug release within twenty-five hours. The hypoglycemic effect of the t-DCTN-loaded PLGA microparticles showed 26.8% reduction in glucose levels in animals, compared with 14.3% reduction by treatment using free t-DCTN.
The aims of the present study were to optimize t-DCTN loading in biodegradable PCL and PLGA
microparticles using a two-level factorial experimental design, and to improve drug loading by using the concept of drug coencapsulation with drug:cyclodextrin inclusion complexes (t-DCTN and t-DCTN:HP-β-CD). The physicochemical and release characteristics of t-DCTN-loaded microparticles were investigated for further pharmacological purposes.
Experimental
Materials
Plant material was collected in Jacundá, Pará State (Amazon region, Brazil) and identified by Nelson A. Rosa. A voucher specimen (No. 247) has been stored in the Herbarium of the Museu Paraense Emílio Goeldi (Belém-PA, Brazil). The diterpene 19-nor-clerodane trans-dehydrocrotonin (t-DCTN) was extracted and purified from the stem bark of Croton cajucara Benth, as previously described.1
Poly(D,L-lactic-co-glycolic)-acid (PLGA 50/50, inherent viscosity 0.57 dL g-1) was
purchased from Birmingham Polymers (Alabama, USA). Poly-ε-caprolactone (PCL, MW ca. 14,000 Da), polyvinyl alcohol (PVA, MW ca. 13,000-17,000 Da), polyethylene glycol (PEG, MW ca. 4,000 Da), trehalose and 2-hydroxypropyl-β-cyclodextrin (HP-β-CD, MW ca. 1,380, degree of substitution ca. 0.6) were acquired from Sigma-Aldrich (St. Louis, USA). Tween 80 was supplied by Labsynth (São Paulo, Brazil). Purified water was produced by a water purification system (UP 900, Human Corporation, Korea). All reagents used were of analytical grade.
Preparation of t-DCTN:HP-β-CD inclusion complex
The t-DCTN:HP-β-CD inclusion complex (1:1 molar ratio) was prepared using the freeze-drying technique. Appropriate amounts of drug and HP-β-CD were dissolved in ethanol:water solution (1:1), stirred for 48 h at 25 °C, cooled by immersion in liquid nitrogen and lyophilized (EZ-DRY, FTS System, US) for 48 h. The amount of t-DCTN in the inclusion complex was determined using a UV-Vis-validated method.17 The standard curve of
t-DCTN in acetonitrile was prepared at concentrations ranging from 1 to 20 µg mL-1. To extract the drug from
the inclusion complex, a sample of t-DCTN:HP-β-CD, equivalent to 1 mg of t-DCTN, was weighed and mixed with 10 mL of methanol and acetonitrile mixture (1:10). The sample was then diluted with acetonitrile in order to produce a theoretical drug concentration of 10 µg mL-1.
Preparation of microparticles
Two different polymeric matrices of PCL and PLGA were tested to encapsulate t-DCTN into microparticles resulting in the following formulations: (1) t-DCTN/ PCL-MPs; (2) t-DCTN:HP-β-CD/PCL-MPs; (3) t-DCTN/ PLGA-MPs; (4) t-DCTN:HP-β-CD/PLGA-MPs and the (5) coencapsulated t-DCTN/t-DCTN:HP-β-CD/ PLGA-MPs. Initially, preformulation studies of unloaded PCL microparticles were conducted using a 24-1 fractional
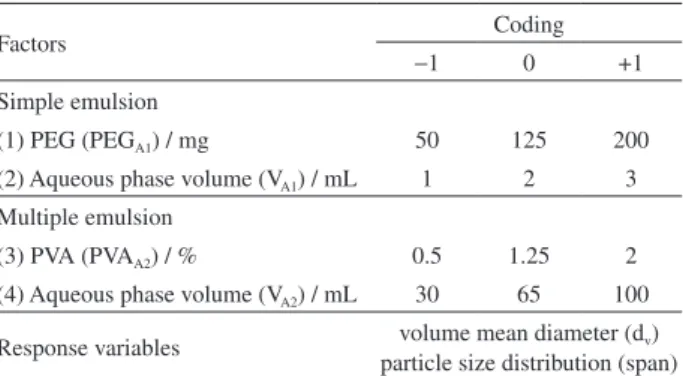
factorial design in order to optimize the system. Next, PLGA microparticles were produced in the same conditions as PCL microparticles in order to evaluate the influence of the polymer matrix on drug encapsulation into microparticles. The real factor levels were coded as shown in Table 1. The effects of four independent factors of the simple (i) and multiple (ii) emulsions were evaluated as follows: (i) factor 1 (PEGA1 = 50, 125 or 200 mg) and factor 2 (inner aqueous
phase volume, VA1 = 1, 2 or 3 mL); (ii) factor 3 (PVAA2 = 0.5,
1.25 or 2%) and factor 4 (aqueous continuous phase volume, VA2 = 30, 65 or 100 mL). The optimum response variables
for microparticles were a volume mean diameter (dv) less
than 10 µm and a particle size distribution (span) below 2. A design matrix was then generated with a randomized order and consisted of eleven batches of microparticles (from M1 to M11). To provide an estimate of the pure error of the responses, a central point run in triplicate was provided (M9-M11). The statistical analyses of the data were carried out using the Statistica® software (version 6).
The microparticles were prepared using a water-in-oil-in-water (w/o/w) double emulsion followed by the solvent evaporation technique. Initially, a simple emulsion (w/o) was prepared by dissolving PCL (225 mg) in dichloromethane (6 mL). The organic solution was emulsified with 1-3 mL phosphate buffer solution (pH 7.4) containing PEG (50-200 mg) using an ultra-turrax T25 (IKA, Germany) at
8,000 rpm for 1 min. This first emulsion was then added in the outer aqueous phase (30-100 mL) containing PVA (0.5-2%, m/v) and emulsified at 8,000 rpm for 30 s, resulting in a double emulsion (w/o/w). This emulsion was then maintained under agitation at 400 rpm for 2 h allowing the solvent evaporation. The microparticles were recovered by centrifugation (Kubota KN-70 centrifuge, Japan) at 3,000 rpm for 10 min and rinsed three times with distilled water to remove the excess emulsifiers. Finally, the microparticles were dispersed in 2 mL of trehalose aqueous solution (1%, m/v), frozen at −80 °C and lyophilized (EZ-DRY, FTS System, USA) at 200 mbar for 48 h. Lyophilized microparticles were stored at 25 ± 1 °C in a vacuum desiccator.
Based on the factorial design results for the unloaded PCL microparticles, PCL and PLGA microparticles containing t-DCTN (11.25-22.50 mg) or t-DCTN:HP-β-CD inclusion complex (11.25-22.50 mg) were prepared. t-DCTN was dissolved in the organic phase and t-DCTN:HP-β-CD in the aqueous phase. In the case of coencapsulation, t-DCTN was dissolved in the organic phase and t-DCTN:HP-β-CD in the aqueous phase of the simple emulsion.
Characterization of microparticles
Particle size analysis
The volume mean diameter and size distribution of the microparticles were determined using the laser diffraction technique (particle size analyzer, Microtrac® S3500, USA).
Samples of lyophilized microparticles (10 mg) were dispersed in Tween 80 solution (0.04%, m/v), sonicated for 10 min and then analyzed. The span values were calculated using the equation 1.
Span = d(v,0.9) − d(v,0.1)/d(v,0.5) (1)
where d(v,0.9), d(v,0.5) and d(v,0.1) are the volume mean
diameters, expressed in µm, determined at the 90th, 50th and
10th particle distribution percentiles, respectively.
Zeta potential measurements
The surface charge of the microparticles was evaluated by electrophoretic mobility (µE) measurements using a Zeta-Meter System 3.0+ (Zeta-Meter, USA). Samples of
microparticles (0.5%) were dispersed in 1 mM NaCl, sonicated for 10 min and analyzed at 25 °C. The results are reported as the mean of ten runs and expressed by the zeta potential (ζ, mV).
Morphological analyses
The microscopic aspect of microparticles was evaluated using scanning electron microscopy (SEM, FEI, Quanta Table 1. Factor levels and response variables used in the 24-1 fractional
factorial design to prepare unloaded microparticles
Factors Coding
−1 0 +1
Simple emulsion
(1) PEG (PEGA1) / mg 50 125 200
(2) Aqueous phase volume (VA1) / mL 1 2 3
Multiple emulsion
(3) PVA (PVAA2) / % 0.5 1.25 2
(4) Aqueous phase volume (VA2) / mL 30 65 100
Response variables volume mean diameter (dv)
200 FEG, Hillsboro, USA). The samples were prepared from dispersion of lyophilized microparticles in deionized water. The dispersion of microparticles was dropped onto a piece of silica wafer and dried in a desiccator. Next, the wafer piece was sealed with colloidal gold on stubs for low vacuum analysis at 10 kV and magnification of approximately 5,000×.
Porosity analysis
The porosity parameters of the microparticles were evaluated using the gas adsorption technique. Measurements were performed using the accelerated surface area and porosimetry system (ASAP 2420, Micrometrics, Norcross, USA). Before analysis, a sample of lyophilized microparticles (100 mg) was placed in a volumetric tube, degassed under vacuum at 20 °C for 48 h, immersed in liquid nitrogen and then exposed to nitrogen under controlled pressure. The pressure at which adsorption equilibrium occurred was measured and the ideal gas equation applied to determine the amount of gas adsorbed on the surface of the microparticles. Silica-alumina pellets (specific surface area 215 ± 6 m2 g-1;
mean pore diameter of 11.5 nm) were used as standard. The specific surface area was calculated using the Brunauer-Emmett-Teller (BET) method.21 The pore size
distribution was determined by the adsorption branch of the N2 isotherm (1.7-300 nm diameters range) using the
Barret-Joyner-Halenda (BJH) model.7
Drug encapsulation efficiency and drug loading
Lyophilized microparticles (5 mg) were dissolved in a mixture of dichloromethane and methanol (25 mL, 3:2, v/v) and sonicated for 10 min. The amount of t-DCTN in the microparticles was determined at 238 nm using a standard curve of t-DCTN in methanol, at concentration ranging from 1 to 20 µg mL-1. The drug content values
were used to calculate the drug loading (equation 2) and encapsulation efficiency (equation 3). The experiments were carried out in triplicate.
(2)
(3)
where DL is drug loading, EE is drug encapsulation efficiency and t-DCTN is the biocompound trans-dehydrocrotonin. The content is the measured drug concentration and total means the theoretical amount of drug in microparticles.
In vitro drug release kinetics
The release kinetics of t-DCTN into microparticles was carried out using the dissolution technique in sink conditions, considering t-DCTN solubility at pH 7.4 PBS (37 °C) equal to 36.6 ± 3.2 µg mL-1.19 Samples
of microparticles were placed in 200 mL of phosphate buffer (0.2 M, pH 7.4) at 37 ± 1 °C under magnetic stirring. At predetermined time intervals an aliquot of the release medium (1 mL) was withdrawn and replaced by fresh medium. After filtration of samples (0.22 µm membrane filter, Millipore, USA), the t-DCTN content was determined using a spectrophotometer at 244 nm.22
The in vitro release profiles of t-DCTN from different microparticle formulations were plotted as the percentage of released t-DCTN as a function of time. The kinetic experiments were conducted in triplicate.
The experimental release data were fitted using an exponential simplified model derived from the analytical solution for the Fick’s second law for spherical microparticles.23
(4)
A first order approximation of the equation 4 establishes that:
(5)
where D is the diffusion coefficient and R is the average radius of the microparticles.
The approximated model used to fit experimental data is represented as follows:
(6)
where Mt and M∞ are the absolute cumulative amount of
drug released at time t and infinite time, respectively; k1 is
a model constant and k2 is a rate constant associated with
the drug diffusion coefficient in the polymeric matrix.23
Statistical analysis
Results and Discussion
Preformulation study of PCL microparticles
The factorial design was used to select the ideal formulation of PCL microparticles for further incorporation of t-DCTN and t-DCTN:HP-β-CD inclusion complex. A 24-1 fractional factorial design was carried out to evaluate
the effect of variables on the size pattern of empty PCL microparticles obtained using the double emulsion/solvent evaporation technique.
The factors of the simple emulsion (PEGA1 and VA1) and
the double emulsion (PVAA2 and VA2) strongly influenced
the response variables dv and span of the microparticles as
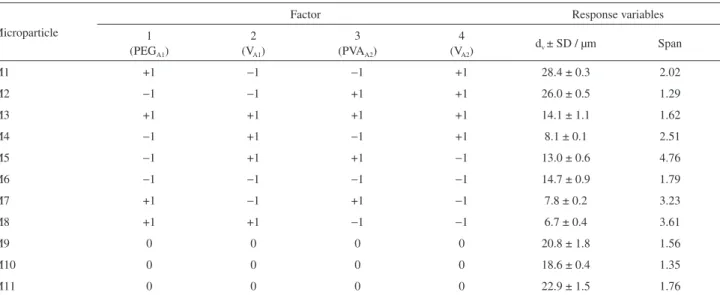
shown in Table 2. The values of volume mean diameter of empty PCL microparticles ranged from 6.68 to 28.41 µm and span values from 1.56 to 4.76.
The interaction effects of factors in the factorial design of empty PCL microparticles are summarized in Table 3. The effect value indicates the magnitude of the impact of each factor as well as its interactions. The signal effect, positive (+) or negative (−), indicates when the response variable is modified as a function of the variation factor. A positive effect means that the output increases with an increase in the variable level and a negative effect means that the output increases with a decrease in the variable level.10 The data clearly indicate the significant effects of
the factors VA1 and VA2 on dv and span of PCL microparticles
(R2 = 0.989). The internal aqueous phase volume had a
negative effect (−8.20) and the external aqueous phase
volume a positive effect (8.61) on particle size. This means that a decrease in the dv can be achieved with an increase
in VA1 and a decrease in VA2. VA1 and VA2 present main
positive (0.835) and negative (−1.488) effects in the span, respectively. Thus a change in one of the significant factors of the factorial design (VA1 and VA2) causes opposite effects
on the size and span of the PCL microparticles. Taking into account the formulation M8 (VA1 = 3 mL and VA2 =
30 mL), a smaller dv (6.68 ± 0.43 µm) and a higher span
(3.61) were found.
The significant interaction effects were 1 by 3 on dv (−7.92), and 1 by 2 on span (−1.243) of the PCL
microparticles. The results showed that the interaction of the factors PEGA1 and PVAA2 causes a decrease in dv
Table 2. Volume mean diameter (dv) and particle size distribution (span) of unloaded PCL microparticles obtained by the emulsion/solvent evaporation
technique using a 24−1 fractional factorial designa
Microparticle
Factor Response variables
1 (PEGA1)
2 (VA1)
3 (PVAA2)
4 (VA2)
dv ±SD / µm Span
M1 +1 −1 −1 +1 28.4 ± 0.3 2.02
M2 −1 −1 +1 +1 26.0 ± 0.5 1.29
M3 +1 +1 +1 +1 14.1 ± 1.1 1.62
M4 −1 +1 −1 +1 8.1 ± 0.1 2.51
M5 −1 +1 +1 −1 13.0 ± 0.6 4.76
M6 −1 −1 −1 −1 14.7 ± 0.9 1.79
M7 +1 −1 +1 −1 7.8 ± 0.2 3.23
M8 +1 +1 −1 −1 6.7 ± 0.4 3.61
M9 0 0 0 0 20.8 ± 1.8 1.56
M10 0 0 0 0 18.6 ± 0.4 1.35
M11 0 0 0 0 22.9 ± 1.5 1.76
PCL = 225 mg. PEG: Polyethylene glycol; PVA: polyvinyl alcohol; PCL: poly-ε-caprolactone; SD: standard deviation. aLevels are coded as indicated in
Table 1.
Table 3. The interaction effects estimated from the response values in the 24-1 fractional factorial design of unloaded PCL microparticles
Factor Effect 1 (dv) Effect 2 (span)
1 −1.21 0.033
2 −8.20 0.853
3 0.19 0.432
4 8.61 −1.488
1 by 2 1.61 −1.243
1 by 3 −7.92 −0.443
1 by 4 5.39 −0.113
PCL: poly-ε-caprolactone; dv: volume mean diameter. The values showed
(7.82 µm, M7), and the interaction of the factors PEGA1 and
VA1 produced a decrease in the span of PCL microparticles.
The fractional factorial design allowed the production of PCL microparticles with a smaller size (< 19 µm) but higher span values (> 1.76, except for M2 and M3) in relation to M9, because of the counter acting effects of the factors on the response variables.
It has been reported that the particle size increases as the volume of the continuous phase (VA2) increases.24,25
A large volume of the continuous phase provides a high concentration gradient of the organic solvent across the phase boundary by diluting the solvent, leading to a fast solidification of the polymer and increasing the size of the microparticles. For VA1, an opposite effect was found, which
increases when the inner aqueous phase increases the size of the microparticles. This effect is in disagreement with literature, but studies were carried out changing only one independent factor at time.24-26 On the contrary, in the present
study, interactions of four independent factors responsible to form microparticles were analyzed at the same time.
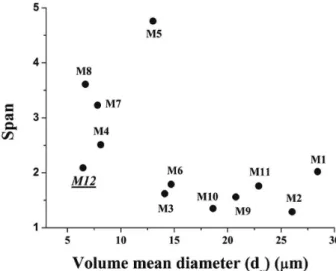
In the present study, the authors sought to produce microparticles with a mean particle size < 10 µm and a span value < 2. In this way a new microparticle formulation (M12) was produced based on statistical optimization: PCL (225 mg) and PEG (125 mg) with a VA1 of 2 mL to form
the simple emulsion, and PVA (1.25%) and VA2 of 45 mL
as the continuous phase. As expected, M12 presented a smaller dv (6.45 ± 0.53 µm) and a slightly higher span (2.09)
(Figure 1). The variation in the inner/external aqueous phase (w1/w2) ratio had a great influence on the size of the
PCL microparticles. The smallest value of dv (6.45 µm)
was found for the w1/w2 ratio of 1/22.5 (M12). However,
small dv values were also found for w1/w2 ratios varying
from 1/10 (6.7 µm, M8) and 1/30 (7.8 µm, M7).
The increase in particle size of PCL microparticles with an increase in the external aqueous phase volume can be attributed to a decrease in the mixing efficiency of emulsion phases associated with larger volumes during the stirring process. A reduction in mixing efficiency of emulsion phases probably produced an increase in the size of the simple emulsion droplets, resulting in the formation of large microparticles. The decrease in the diameter and the increase in the polydispersion (span) of microparticles with the increase in the internal aqueous phase volume were possibly caused by the increase in volume fraction of the dispersed continuous phase.7 Using the w/o/w double
emulsion technique, the viscosity of the polymer phase may also be influenced by the presence of the inner water phase. Thus, a decrease in viscosity in the dispersed phase of the microparticles resulted in a larger size distribution.20
PEG and PVA were used in order to stabilize the internal phase of the simple emulsion and the continuous phase of the multiple emulsion, respectively. As previously reported, the increase in surfactant concentrations causes a reduction in the size of microspheres.7,20
t-DCTN-loaded PCL and PLGA microparticles
The t-DCTN loading into PCL and PLGA microparticles ranged from 11.25 to 45.0 mg for a drug/polymer ratio ranging from 1:5 to 1:20 (Table 4). The presence of t-DCTN influenced the particle size of the PCL microparticles. A remarkable increase in the size and span of PCL microparticles has been observed with the augmentation in the initial amount of t-DCTN from 11.25 to 22.5 mg. The volume mean diameter of t-DCTN/PCL-MPs ranged from 25.8 to 49.3 µm and the span from 1.39 to 2.12. It should be noted that the smallest size was found at the 1:20 drug/polymer ratio (25.8 µm). The presence of the drug can increase the viscosity of the dispersed phase, resulting in an increase in the size of droplets in the emulsification medium, which leads to an augmentation of the mean size of microparticles.7
The encapsulation efficiency of t-DCTN/PCL-MPs ranged from 18.1 (11.25 mg t-DCTN) to 49.7% (22.50 mg t-DCTN) and the drug loading increased from 0.79 to 4.06%. As expected, the t-DCTN loading in microparticles improved with the increase in the drug amount. In fact, it is well established that drug efficiency encapsulation into microparticles generally increases with an augmentation in the drug/polymer ratio.10
The volume mean size of t-DCTN/PLGA-MPs was smaller (16-37 µm) than t-DCTN/PCL-MPs (26-49 µm). The span values varied slightly from 0.81 to 1.42 for t-DCTN contents ranging from 11.25 to 45.00 mg (1:20-1:5 Figure 1. Scatterplot of volume mean diameter and span of unloaded
polymer/drug ratio). Drug encapsulation efficiency and drug loading increased from 58.8 to 75.7% and from 2.36 to 10.12% (m/m), respectively (Table 4). The increase in the drug/polymer ratio influenced the particle size of the PLGA microparticles due to the high affinity of t-DCTN with the PLGA matrix. This higher drug/polymer affinity causes an increased retention of the drug in the organic phase and improved emulsion stability during the formation of microparticles.27
t-DCTN:HP-β-CD-and t-DCTN/t-DCTN:HP-β-CD-loaded microparticles
Hydroxypropyl-β-cyclodextrin (HP-β-CD) was chosen to prepare inclusion complex because it was expected to
improve the aqueous solubility of t-DCTN in comparison to β-cyclodextrin (β-CD), as previously described.19 Thus
the incorporation of t-DCTN:HP-β-CD inclusion complex (120 mg equivalent to 22.5 mg of t-DCTN) into PLC or PLGA microparticles (1:10 drug/polymer ratio) was carried out.
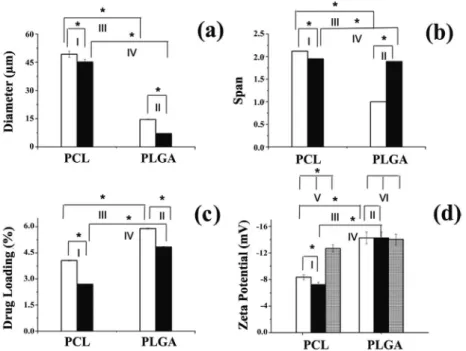
Figure 2 shows the physicochemical characteristics of PCL and PLGA microparticles containing t-DCTN and t-DCTN:HP-β-CD inclusion complex. The encapsulation of t-DCTN or t-DCTN:HP-β-CD into PCL matrix produced slight differences in the volume mean diameter and span (Figures 2a and 2b, respectively). Also, t-DCTN-loaded PCL microparticles presented dv of 49.3 ± 1.6 µm and span of 2.12,
while the t-DCTN:HP-β-CD-loaded PCL microparticles presented dv of 45.1 ± 1.4 µm and span of 1.95.
Table 4. Size properties, encapsulation efficiency and drug loading of t-DCTN in PCL and PLGA microparticles
Polymer t-DCTN / mg Drug:polymer ratio Particle size (dv ± SD) / µm
Span DL ± SD /
(%, m/m) EE ± SD / %
PCL
11.25 1:20 25.8 ± 0.1 1.39 0.79 ± 0.01 18.1 ± 0.2
15.00 1:15 42.2 ± 3.2 1.82 2.07 ± 0.02 34.2 ± 0.4
22.50 1:10 49.3 ± 1.6 2.12 4.06 ± 0.02 49.7 ± 0.2
PLGA
11.25 1:20 15.8 ± 0.1 0.81 2.36 ± 0.02 58.8 ± 0.4
15.00 1:15 16.3 ± 0.4 1.02 3.34 ± 0.01 62.7 ± 0.1
22.50 1:10 14.6 ± 0.2 1.00 5.90 ± 0.03 75.7 ± 0.4
45.00 1:5 37.1 ± 0.2 1.42 10.12 ± 0.01 71.2 ± 0.1
PCL: poly-ε-caprolactone (225 mg); PLGA: poly(D,L-lactic-co-glycolic)-acid (225 mg); EE: encapsulation efficiency; DL: drug loading; dv: volume mean
diameter; SD: standard deviation.
In the PLGA matrix, a significant decrease in particle size and an increase in span values were found in the presence of t-DCTN:HP-β-CD (dv = 7.1 µm and
span = 1.89) in comparison with t-DCTN (dv = 14.6 µm
and span = 1.00) (Figures 2a and 2b, respectively). Drug loading decreased from 4.1 to 2.7% and from 5.90 to 4.84% when t-DCTN:HP-β-CD inclusion complex was incorporated into PCL and PLGA matrices, respectively (Figure 2c). This may be due in part to the fact that the droplets of the internal aqueous phase containing the soluble inclusion complex t-DCTN:HP-β-CD can diffuse to the external aqueous phase more easily during the formation of microparticles.28 PCL microparticles with a larger size
presented a smaller drug loading than PLGA microparticles for both t-DCTN and t-DCTN:HP-β-CD inclusion complex (Figure 2c). DL of the hydrophilic drug:inclusion complex encapsulated into PLGA microparticles is higher than into PCL-microparticles, considering that PLGA is less hydrophobic than PCL.29-31 Based on these findings, the
encapsulation of drugs into microparticles is affected by different factors such as particle size, drug/polymer interactions and emulsion stability during the preparation process of microspheres.
The zeta potential of PCL-based microparticles changed with the incorporation of t-DCTN (−8.4 ± 0.4 mV) or t-DCTN:HP-β-CD (−7.2 ± 0.4 mV) in comparison with the empty microparticles (−12.7 ± 0.6 mV) (Figure 2d). The slight decrease in zeta potential in relation to empty microparticles could be the result of a fraction of the drug being adsorbed on the particle surface, which may influence the surface charge. In contrast, no changes were observed after the incorporation of t-DCTN (−14.3 ± 0.9 mV) or t-DCTN:HP-β-CD (−13.9 ± 0.9 mV) into PLGA microparticles (−14.0 ± 0.8 mV), thus confirming the higher affinity of t-DCTN with the PLGA and its incorporation into the core of the polymeric matrix. As previously demonstrated, PLGA microparticles are negatively charged and this surface charge is associated with carboxylic groups of this polyester.27
The PLGA matrix provided higher drug loading, a smaller particle size and a narrow size distribution. This suggests a higher affinity between the drug and polymer matrix, thereby inducing higher drug incorporation into PLGA-based microparticles. Based on these findings, a study was performed to improve drug loading by changing the drug:polymer ratio from 1:10 to 1:5. Figure 2c shows that drug loading changed from 5.90 ± 0.03% to 10.12 ± 0.01% (m/m) for microparticles containing only t-DCTN (t-DCTN/PLGA-MPs).
Drug loading increased from 4.84 ± 0.02% (m/m) for PLGA microparticles containing only t-DCTN:HP-β-CD
at the 1:10 drug:polymer ratio, to 13.93 ± 0.05% (m/m), containing t-DCTN and t-DCTN:HP-β-CD coencapsulated at the 1:5 drug:polymer ratio. The particle size and span values changed from 7.1 ± 0.11 µm (span = 1.89) for t-DCTN:HP-β-CD to 9.6 ± 0.11 µm (span = 1.57) for coencapsulated t-DCTN and t-DCTN:HP-β-CD.
The presence of t-DCTN in the organic phase appears to have a great influence on the increased viscosity of the dispersed emulsion phase, as a higher particle size in microparticles containing only t-DCTN (37.1 µm) was observed in comparison with t-DCTN and t-DCTN:HP-β-CD coencapsulated at the 1:5 drug:polymer ratio (9.6 µm). It has been reported that the increased viscosity in the dispersed phase may increase the size of microspheres.7 The conception of drug coencapsulation
with drug:cyclodextrin inclusion complex promoted in augmentation of drug loading into PLGA-microparticles by the fact of using both the free hydrophobic drug, placed in the organic phase during microparticles preparation, and t-DCTN:HP-β-CD inclusion complex, which certainly improved the solubility of drug, placed in the aqueous phase during the preparation of the microparticles.
Morphological characteristics of microparticles
The morphological characteristics of the PCL and PLGA microparticles containing t-DCTN and t-DCTN:HP-β-CD inclusion complex are shown in SEM micrographs (Figure 3). t-DCTN-loaded microparticles prepared with PCL were spherical in shape with a smooth surface (Figure 3a), while PLGA based-microparticles showed a porous surface and inner structure (Figure 3c). These results are in disagreement with the dense and nonporous microspheres obtained in our previous study. This can be attributed to the modification of the w/o/w parameters, such as the increase in the external aqueous phase and increased amount of PEG in the inner aqueous phase. All these parameters increased the osmotic gradient and resulting flux of water from w2 to w1/polymer phase.20
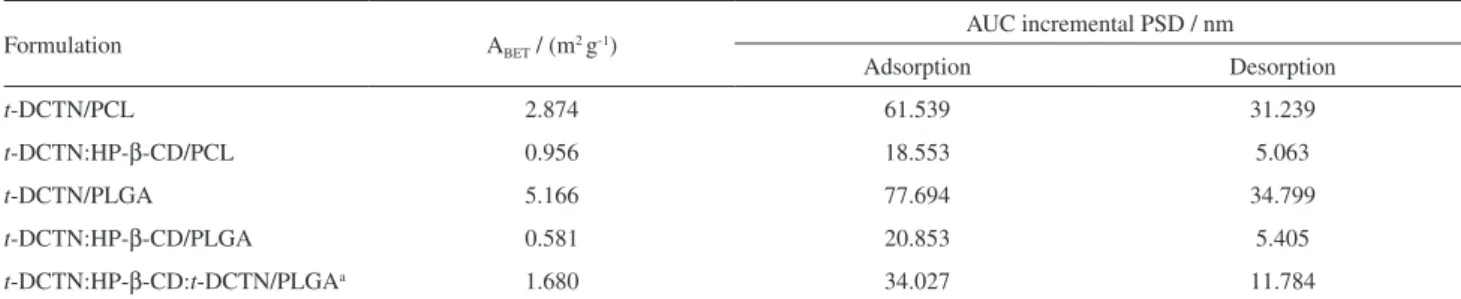
Porosity analysis of microparticles
The integrated area under the curve (AUC) applied to the incremental pore size distribution (PSD) of adsorption/ desorption (AUCads/AUCdes) branches of isotherm was
determined in order to characterize the porosity of the microspheres. The results showed that the increase in the
specific surface area of microparticles (ABET) correlated
with an increase in the porosity parameters (specific surface area and pore size distribution). This indicates that a higher specific surface area was associated with a higher porosity of the microparticles (Table 5). The PLGA microparticles containing only t-DCTN at the 1:10 drug:polymer ratio presented porosity parameter values (ABET = 5.166 m2 g-1; AUCads = 77.694 and AUCdes = 34.799)
greater than PCL microparticles (ABET = 2.874 m2 g-1;
AUCads = 61.539 and AUCdes = 31.239) (Table 5). However,
the incorporation of t-DCTN:HP-β-CD inclusion complex into microparticles produced a significant decrease in the porosity parameters, irrespective of the polymeric matrix, PCL (ABET = 0.956 m2 g-1; AUCads = 18.553
and AUCdes = 5.063) and PLGA (ABET = 0.581 m2 g-1;
AUCads = 20.853 and AUCdes = 5.405).
The PLGA microspheres containing t-DCTN and t-DCTN:HP-β-CD coencapsulated at the 1:5 drug:polymer ratio presented intermediate porosity parameter values (ABET = 1.680 m2 g-1; AUCads = 34.027 and AUCdes = 11.784)
compared with the ones containing only t-DCTN. This emphasizes the greater influence of t-DCTN:HP-β-CD inclusion complex on the porosity properties, as was also observed in the morphological analysis using SEM microscopy. The higher porosity of the PLGA microparticles containing only t-DCTN could be a result of the higher viscosity of the polymer solution and the smaller time required for PLGA reaction27 as compared
with PCL. It has already been reported that a more rapid flux of solvent across the o/w interface stresses the precipitated polymer film and may cause an increase in the porosity of the PLGA microparticles. Additionally, it suggests that the presence of PEG in the inner water phase could trigger strong interactions between PLGA/CH2Cl2
systems. As previously demonstrated in the literature, a high osmotic pressure in the internal aqueous phase of the double emulsion generates an influx of water toward the inner aqueous phase. The occurrence of this process during particle hardening generally results in the formation of a Figure 3. SEM micrographs of PCL and PLGA microparticles containing
t-DCTN or t-DCTN:HP-β-CD inclusion complex at the 1:10 drug:polymer ratio: (a) t-DCTN/PCL (5,000×); (b) t-DCTN:HP-β-CD/PCL (4,042×); (c) t-DCTN/PLGA (5,000×); (d) t-DCTN:HP-β-CD:PLGA (5,000×) and, (e) t-DCTN/t-DCTN:HP-β-CD/PLGA coencapsulated at the 1:5 drug:polymer ratio (5,000×).
Table 5. Specific surface area and pore size distribution of the PCL and PLGA microparticles containing t-DCTN
Formulation ABET / (m2 g-1)
AUC incremental PSD / nm
Adsorption Desorption
t-DCTN/PCL 2.874 61.539 31.239
t-DCTN:HP-β-CD/PCL 0.956 18.553 5.063
t-DCTN/PLGA 5.166 77.694 34.799
t-DCTN:HP-β-CD/PLGA 0.581 20.853 5.405
t-DCTN:HP-β-CD:t-DCTN/PLGAa 1.680 34.027 11.784
porous surface.32 This porosity effect was less important
in microspheres containing t-DCTN:HP-β-CD because the presence of the inclusion complex might have inhibited the interaction of PEG with polymeric matrices.
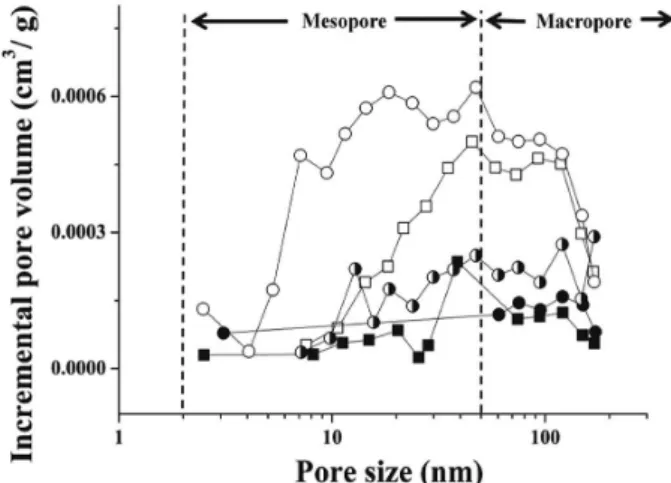
The analysis of the N2 adsorption isotherm profiles
using the BJH model showed that the PCL and PLGA microspheres present meso- (2-50 nm) and macro-pores (> 50 nm) ranges according to the IUPAC classification (Figure 4). The BJH curves (incremental pore volume vs. pore size) showed a higher pore volume at the meso-pore range and a decrease in the population of mesopores smaller than 50 nm for microspheres containing t-DCTN:HP-β-CD inclusion complex in both polymeric matrices. As previously reported for the specific surface area, the incorporation of t-DCTN:HP-β-CD inclusion complex into microspheres decreased the pore volume. This decrease in pore volume of the microspheres can be ascribed to the change in the solvent removal rate and the longer reaction time required for t-DCTN:HP-β-CD as compared to t-DCTN.
Release kinetics of t-DCTN and t-DCTN:HP-β-CD inclusion complex from microparticles
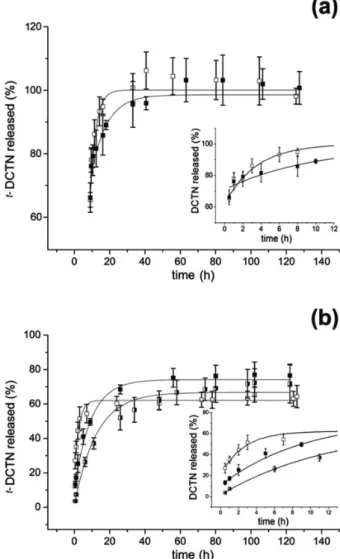
In the present study, microparticles were prepared with two different polymeric matrix PCL and PLGA containing the drug (t-DCTN), the drug:cyclodextrin inclusion complex (t-DCTN:HP-β-CD) or the coencapsulated drug and drug:inclusion complex (t-DCTN/t-DCTN:HP-β-CD) and the in vitro drug release properties were evaluated. The release profiles of t-DCTN from microparticle formulations
are illustrated in Figures 5a and 5b: t-DCTN into PCL microparticles and t-DCTN into PLGA microparticles, respectively.
Analyzing kinetic data of t-DCTN from microparticles within the first 8 hours (Figure 5), a drug release of almost 78% from PCL-microparticles was verified, while only 40% was released from PLGA-microparticles within 2 hours of the kinetics. However, in the presence of HP-β-CD in PLGA-microparticles, that is to say, the drug in cyclodextrin inclusion complex, a decrease of 45% on the drug release was found. In addition the coencapsulation of t-DCTN/t-DCTN:HP-β-CD, reduced the drug release. This phenomenon can be explained by the porosity of microparticles. Moreover, the presence of HP-β-CD diminished the porous and the mean volume diameter of PCL or PLGA microparticles containing t-DCTN.
The presence of the t-DCTN:HP-β-CD inclusion complex improved physicochemical properties of microparticles by decreasing their porosity and the volume mean diameter. In fact, t-DCTN:HP-β-CD improved drug loading and controlled drug release in PLGA-microparticles, probably due to the enhancement of the t-DCTN affinity by this matrix.
To understand the controlling drug diffusion mechanisms from these systems, experimental data of kinetics was fitted using a simplified exponential model (equation 6), based on the analytical solution of Fick’s second law of diffusion23 and fitted curves are presented in Figure 5.
As it can see from Figure 5, a good agreement between theoretical and experimental data was found (r ≥ 0.96), indicating the simple mass transport diffusion mechanism of microparticulate systems.
The calculated kinetic parameters of t-DCTN-loaded microparticles using equation 6 are summarized in Table 6. The kinetic profile of t-DCTN into PLGA microparticles changed with a ten-fold decrease in the rate constant by the coencapsulation of t-DCTN:t-DCTN:HP-β-CD (k2 = 0.048).
When performing the best-fit kinetic model using equation 6, the resulting values for the constant k1 should
be of the order of magnitude of 6/π2≅ 0.6079, with typical
values in the range from 0 to 1. It is worthy to note that the variability of the experimental data and the terms eliminated in the original approach,23 resulting in equation 6, also
contribute to not result in the theoretical expected k1 value,
which would be obtained only in an ideal scenario and considering the full model, taking into account the other despised terms of the equation. The k1 values obtained
in fittings, which range between 0.2988 and 0.8724, are perfectly compatible, as expected when the validity of the kinetic model is assumed.
Taking into account that k2 is the rate constant associated
with the diffusion coefficient, to note that equation 6 results in a release rate decaying exponentially with time:
(7)
Thus, the k2 value drives the rate decrease and very small
values result in virtually constant rate over a long period of kinetics. For the last two results in Table 6, the k2 values
decreased significantly about one order of magnitude. This features a slowest t-DCTN release compared with the t-DCTN:HP-β-CD. The values of the k2 constant enable
getting estimated effective diffusion coefficients (De) of
the t-DCTN in the microparticle formulations, according
to: . Thus the values of De were calculated and
appended in Table 6.
The effective diffusion coefficient of t-DCTN was dependent on the type of polymeric matrix. De of
t-DCTN in PCL is 4.1249 × 10⁻¹¹ (cm2 s-1), while a D e of
6.0548 × 10⁻¹¹ (cm2 s-1) was found for of t-DCTN in PLGA.
In addition, the presence of t-DCTN:HP-β-CD in the both PCL and PLGA matrices decreased the effective diffusion coefficient. It is worth to mention that t-DCTN:HP-β -CD:t-DCTN/PLGA microparticles has smaller diameter of particles and as a result the lower diffusion coefficient, thereby resulting in a more controlled release of t-DCTN.
Conclusions
The use of a factorial design represented a new approach to the study of the influence of formulation parameters on the size properties of empty PCL microspheres and optimization of these controlled drug delivery systems Figure 5. In vitro release of t-DCTN from microparticles: (a) PCL and
(b) PLGA. t-DCTN-loaded microparticles (white squares); t -DCTN:HP-β-CD-loaded microparticles (black squares) at the 1:10 drug:polymer ratio and t-DCTN:HP-β-CD/DCTN-loaded microparticles at the 1:5 drug:polymer ratio (white/black squares). Each point represents the mean of three different experiments ± SD. Lines represent the non-linear fitting of the Fickian diffusion model.
Table 6. Calculated release parameters and estimated diffusion coefficient of t-DCTN into PCL and PLGA microparticles containing t-DCTN, t -DCTN:HP-β-CD inclusion complex and the coencapsulated t-DCTN/t-DCTN:HP-β-CD, using an exponential model
t-DCTN Formulation (Drug:polymer ratio=1:10)
Exponential model
r² R / µm De× 1011 /
(cm2 s-1)
k1 k2
t-DCTN/PCL 0.3155 0.2412 0.9623 24.65 4.1249
t-DCTN:HP-β-CD/PCL 0.2988 0.1637 0.9818 22.65 2.3428
t-DCTN/PLGA 0.6993 0.4037 0.9860 7.30 6.0548
t-DCTN:HP-β-CD/PLGA 0.7002 0.0626 0.9900 3.55 2.2204
t-DCTN:HP-β-CD:t-DCTN/PLGAa 0.8724 0.0475 0.9911 4.80 3.0802
t-DCTN: trans-dehydrocrotonin; PCL: poly-ε-caprolactone; PLGA: poly(D,L-lactic-co-glycolic)-acid; HP-β-CD: 2-hydroxypropyl-β-cyclodextrin; r2: correlation coefficient; R: mean radius of microparticles; D
to encapsulate t-DCTN and t-DCTN:HP-β-CD inclusion complex using the double emulsion/solvent evaporation method. t-DCTN was successfully encapsulated into PCL and PLGA microspheres with a higher encapsulation efficiency and drug loading at the 1:10 drug/polymer ratio. The t-DCTN:HP-β-CD inclusion complex decreased encapsulation efficiency, drug loading, particle size and porosity parameters at the 1:10 drug/polymer ratio in both polymeric matrices. The coencapsulation of t-DCTN with t-DCTN:HP-β-CD inclusion complex at the 1:5 drug/polymer ratio increased encapsulation efficiency and drug loading in PLGA microspheres maintaining small values of particle size and span. The results suggest a smaller affinity of t-DCTN with the PCL matrix in relation to PLGA, owing to its lower encapsulation, higher modification of the surface charge, higher burst effect and faster release profiles regardless of particle size and porosity characteristics. From these findings novel oral formulations of PLGA microparticles containing t-DCTN and/or t-DCTN:HP-β-CD were obtained for application in further in vivo pharmacological studies.
Acknowledgments
W. A. M. is grateful for a PhD scholarship from the Brazilian Council for Scientific and Technological Development (CNPq). The authors thank the Pernambuco State Foundation for the Advancement of Science (FACEPE). This research was supported in part by the CNPq, Brazil (Grant No. 474071/2007-3).
References
1. Maciel, M. A.; Pinto, A. C.; Arruda, A. C.; Pamplona, S. G.; Vanderlinde, F. A.; Lapa, A. J.; Echevarria, A.; Grynberg, N. F.; Colus, I. M.; Farias, R. A.; Luna Costa, A. M.; Rao, V. S.; J. Ethnopharmacol. 2000, 70, 41.
2. Rodriguez, J. A.; Hiruma-Lima, C. A.; Souza Brito, A. R.; Hum. Exp. Toxicol. 2004, 23, 455.
3. Grynberg, N. F.; Echevarria, A.; Lima, J. E.; Pamplona, S. S.; Pinto, A. C.; Maciel, M. A.; Planta Med. 1999, 65, 687. 4. Farias, R. A.; Rao, V. S.; Viana, G. S.; Silveira, E. R.; Maciel,
M. A.; Pinto, A. C.; Planta Med. 1997, 63, 558. 5. Rodriguez, J. A.; Haun, M.; Planta Med. 1999, 65, 522. 6. Zidan, A. S.; Sammour, O. A.; Hammad, M. A.; Megrab, N. A.;
Hussain, M. D.; Khan, M. A.; Habi, M. J.; AAPS PharmSciTech 2006, 7, E1.
7. Li, M.; Rouaud, O.; Poncelet, D.; Int. J. Pharm. 2008, 363, 26. 8. Vilos, C.; Velasquez, L. A.; J. Biomed. Biotechnol. 2012, 2012,
1.
9. Dorati, R.; Genta, I.; Colzani, B.; Modena, T.; Bruni, G.; Tripodo, G.; Conti, B.; AAPS PharmSciTech 2015, 16, 1129. 10. Soudry-Kochavi, L.; Naraykin, N.; Nassar, T.; Benita, S.; J.
Controlled Release 2015, 217, 202.
11. Bruns, R. E.; Scarminio, I. S.; Barros-Neto, B.; Statistical Design - Chemometrics, 1st ed.; Elsevier: Amsterdam, 2005. 12. Sajeesh, S.; Sharma, C. P.; Int. J. Pharm. 2006, 325, 147. 13. Filipović-Grčić, J.; Voinovich, D.; Moneghini, M.; Bećirević
-Laćan, M.; Magarotto, L.; Jalšenjak, I.; Eur. J. Pharm. Sci. 2000, 9, 373.
14. Trapani, G.; Lopedota, A.; Boghetich, G.; Latrofa, A.; Franco, M.; Sanna, E.; Liso, G.; Int. J. Pharm. 2003, 268, 47. 15. Agashe, H.; Lagisetty, P.; Saho, K.; Bourne, D.; Grady, B.;
Awasthi, V.; J. Nano Res. 2011, 13, 2609.
16. Gould, S.; Scott, R. C.; Food Chem.Toxicol. 2005, 43, 1451. 17. Loftsson, T.; Duchêne, D.; Int. J. Pharm.2007, 329, 1. 18. Gidwani, B.; Vyas, A.; BioMed Res. Int.2015, 2015, 1. 19. Correa, D. H.; Melo, P. S.; Carvalho, C. A.; Azevedo, M. B.;
Duran, N.; Haun, M.; Eur. J. Pharmacol. 2005, 510, 17. 20. Morais, W. A.; Costa, M. P.; Paixão, A. D.; Maciel, M. A.;
Santos-Magalhães, N. S.; J. Microencapsulation 2009, 26, 529. 21. Wischke, C.; Schwendeman, S. P.; Int. J. Pharm. 2008, 364,
298.
22. Santos-Magalhães, N. S.; Maciel, M. A. M.; Lira, M. C. B.; Morais, W. A.; Lapenda, T. L. S.; Lat. Am. J. Pharm. 2012, 31, 97.
23. Klose, D.; Siepmann, F.; Elkharraz, K.; Siepmann, J.; Int. J. Pharm. 2008, 354, 95.
24. Jeffery, H.; Davis, S. S.; O’Hagan, D. T.; Pharm. Res.1993, 10, 362.
25. Li, X.; Deng, X.; Yuan, M.; Xiong, C.; Huang, Z.; Zhang, Y.; Jia, W.; Int. J. Pharm.1999, 178, 245.
26. Conti, B.; Genta, I.; Modena, T.; Pavanetto, F.; Drug Dev. Ind. Pharm.1995, 21, 615.
27. Mao, S.; Xu, J.; Cai, C.; Germershaus, O.; Schaper, A.; Kissel, T.; Int. J. Pharm. 2007, 334, 137.
28. Bibby, D. C; Davies, N. M.; Tucker I. G.; Int. J. Pharm.2000, 197, 1.
29. Dong, C.-M.; Guo, Y.-Z.; Qiu, K.-Y.; Gu, Z.-W.; Feng, X.-D.; J.Controlled Release2005, 107, 53.
30. Jyothi, N. V.; Prasanna, N. P. M.; Sakarkar, S. N.; Prabha, K. S.; Ramaiah, P. S.; Srawan, G. Y.; J. Microencapsulation2010, 27, 187.
31. Makadia, H. K.; Siegel S. J.; Polymers 2011, 1, 1377. 32. Ungaro, F.; De Rosa, G.; Miro, A.; Quaglia, F.; La Rotonda,
M. I.; Eur. J. Pharm. Sci. 2006, 28, 423.