Dry Sliding Wear Behaviour of Aluminium 5059/SiC/MoS
2Hybrid Metal Matrix
Composites
Ajith Arul Daniela*, Sakthivel Murugesana, Manojkumara, Sudhagar Sukkasamya
Received: January 06, 2017; Revised: August 11, 2017; Accepted: August 24, 2017
The present study is to investigate the inluence of weight percentage of silicon carbide (SiC) (5,10 %, 15%) and particle size (10,20,40µm) of SiC and constant 2% of Molybdenum disulphide(MoS2)
is reinforced with aluminium matrix. Wear performance of the composite was carried out through pin-on-disc method to calculate friction coeicient and wear resistance of the composites. The experiments were conducted by varying the sliding speed of (1.5,2.5 &3.5 m/s), loads (30,50&70N) with sliding distance ranges from (500, 1000& 1500m) under dry sliding conditions. Taguchi plan of experiments and ANOVA method was carried out to ind the outcome of reinforcement ceramic particles, sliding distance, sliding speed, and applied load over the friction coeicient and wear rate. The result reveals that applied load and sliding distance are the most inluencing factors for friction coeicient. Load and percentage of SiC indicates the most afecting factor for wear rate. Worn out surface of the composites were studied by optical microscopic image and Gwyddion software. To conclude, it was interfered that 15% weight percentage of SiC at 10µm ofers better wear resistance and friction coeicient in AHMMCs.
Keywords: Armor Aluminium, Silicon Carbide, Gwyddion, Wear rate, Co-eicient of Friction.
*e-mail: [email protected]
1. Introduction
During recent days Hybrid metal matrix composites are generating a wide interest in the area of research. It ofers high strength, fracture toughness, stifness than monolithic materials and it can withstand high elevated temperature in corrosive conditions. Among that Aluminium MMC (AMMC) is majorly used in defence, aircraft, automobile and mining applications owing to its good tribological and mechanical properties. In general MMC contains two phases named as matrix phase which is the base metal and reinforced phase which is added to modify the properties of the material. Aluminium is the material mostly used as base matrix due to its lightweight, high strength and easy availability on the earth at lowest price 1-4.Ceramic particles with aluminium
alloy can be efectively fabricated by stir casting technique. Such that the developed MMC exhibits uniform distribution of the ceramic particles with matrix material5.The dry sliding
wear of Al composites fabricated through squeeze casting method and found that the alloy having SiC ibers exhibits low wear rate than the base aluminium alloy material. In addition to, by reinforcing the ceramics with aluminium alloy, it exhibits better mechanical, thermal resistance and high wear resistance. Hardness is increased with adding hard reinforced like SiC and increases the resistance against wear 6.The wear behaviour of automobile break pad material
added with aluminium/SiC MMCs which the composites are fabricated through stir casting method. The pin-on-disc
test reveals that the MMCs ofer better wear resistance. The increase of weight percentage of Al2O3 reduces the plastic
deformation of the composite and increases the wear resistance7.
By adding Al2O3, the hardness of the composites increases
which leads to decrease in wear loss of the AMMC. Micro cracking and abrasion leads to material loss at lower speed8.
Mechanical properties like hardness, tensile strength and impact strength increases when the weight percentage of SiC increases, on the other hand friction and wear performance improves while increasing the wt% of SiC and alumina upto 25%9,10. Addition of high amount of SiC decreases the
elongation which tends the composite material transform from ductile to brittle which leads to machining diiculties
11. At low sliding speed and pressure the speciic wear rate
increases when the percentage of reinforcement decreases. To overcome the drawback of hard reinforcement, soft materials like graphite and MoS2are added as secondary reinforcement
which ofers lubrication against wear12.
Hybridization of reinforcements plays a major role in enhancing the properties of MMCs7.These composites
combines the property of primary and secondary reinforcement to provide improved unique characteristics which cannot the established by a single material13. Addition of solid lubricant
increases the compressibility and helps to improve the part density in which 3% of MoS2 will give optimized wear
behaviour and volume percentage more than 5% reduces the hardness of the composite14. Wear capacity improves
with addition of MoS2 at high loads
15. Addition of MoS 2
decreases the co-eicient of friction because it forms a
aDepartment of Mechanical Engineering, Anna University Regional, Campus Coimbatore, 641046,
moisture absorbed layer on the matrix16.By adding graphite
(Gr) as reinforcement in AMMCs has been reported as a better solution in lowering the wear rate due to its self lubricating property, but on the other side it cripples mechanical potency of the composites. At the same time addition of silicon carbide (SiC) improves both mechanical strength and wear resistance of materials. Wear rate of hybrid composite with graphite is less than free graphite composite.Al-Al2O3-Gr
composite provides better wear behaviour and the addition of Gr as secondary reinforcement reduces the machining diiculties. High amount of Gr will reduce wear due to the fracture toughness17.Al-SiC-Gr hybrid composite has better
wear behaviour than Al-SiC and Al-Gr composites18. From
the literature it can be noted that Gr and MoS2 are the most
used solid lubricants in the composite. Further, it is important to note that graphite loses its solid lubricant properties at vacuum atmospheres whereas lubricant property of MoS2
is not afected by the environment.
The fabrication route of MMCs plays a vital role in mechanical and tribological behaviour and it was found that stir casting specimens have superior mechanical behaviour when compared with powder metallurgy specimens9. Utilization
of stir casting technique improves wettability and excellent bonding between the ceramics and the metal. In addition to, these methods are typically cost efective18-22.It is a simple and
lexible method for large quantity productions23-25. Taguchi
based system is signiicant for designing the experiments in an improved quality structures. Orthogonal array provides better results with reduced number of experiments in an optimum setting for input parameters. This technique accomplishes the incorporation of design of experiments (DOE)26.DOE is the most
efective statistical methods to study the inluence of multiple variables and entails a series of steps to undergo the process27.
DOE by taguchi techniquein SiCp-Gr reinforced composites reveals less wear loss when compared with SiCp-reinforced MMCs28.In bulk metallic glass composites the worn out surface
is analyzed to ind wear loss by using SEM with white light interferometer(WLI) images using Gwyddion software29.
2. Experimental Work
2.1 Material selection
Al5059is a high corrosion resistant alloy with magnesium as primary alloying element. The composition of Al 5059 is given in table 1. Silicon carbide is selected as reinforcement because of durability and low density. The primary reinforcement is silicon carbide having diferent particle sizes (10, 20 and 40µm) in a particulate form which is added into the molten metal at various weight percentages of 5%, 10% and 15%. Because of low friction property MoS2a soft solid lubricant
material is added as the secondary reinforcement at constant weight percentage of 2%. SiC as a brittle reinforced material easily combines with light weight ductile AMMC.
2.2Composite preparation
Many researchers suggested that liquid phase method is the most suitable and cost efective method for compositepreparation14. So, stir casting with compocasting
formulation is chosen as fabrication technique because of uniform distribution of reinforcement. SiC and MoS2 were
preheated in a crucible till 450ºC.The base matrix metal aluminium 5059 ingots are placed in the crucible and heated upto 7500 Cinside the furnace and then the preheated SiC
and MoS2 are added at chosen percentage to the base metal.
2% of Mg is added to the mixture to increase wettability between base matrix and reinforcement24,25. Mechanical stirrer
is inserted into the molten metal and powered for a period of 8mins at 350 rpm in order to blend the reinforcement in base metal. After completion of stirring the liquid mixture is poured into the die (100x70x50mm) and allowed to solidify.
2.3 Hardness test
Table 2 shows the hardness value (BHN) of diferent composites with respect to particle size (10, 20, 40 µm) and weight percentage (5, 10, 15 %) of SiC. Among the AMMCs, the composite reinforced with 15 % SiC at 10µm particle size have the better hardness value. From the table it can be noted that MMC hardness increases with increase in SiC percentage and also higher hardness values are exhibited by the smaller particle reinforced MMCs. Higher hardness value of reinforced SiC leads to increase in hardness of the MMC. Surface area of the smaller particles is higher when compared to larger particles in the matrix which tends to superior hardness of the smaller particle reinforced MMCs26.
2.3 Microstructure
Microstructure of the developed composites was analyzed through scanning electron microscope in order to identify the distribution of reinforcement particles on matrix material. The specimens were prepared as per the required size with the help of wire cut EDM and polished with 300, 600, 1200 and 2000 grit emery sheets. Figure 1a shows the presence of SiC at 5% level at 10µm and constant weight percentage of MoS2.Similarly, Figures1b and 1c illustrate the occurrence
of SiC at 10% at 10µm and 15% at 10 µm.
2.4 Dry sliding wear
Table 1. Chemical composition of Aluminium 5059
Elements Mg Cr Cu Fe Mn Si Ti Zn Zr Al
% 5-6 0.3 0.4 0.5 0.6 0.45 0.2 0.4 0.05 Bal
Table 2. Composition of Aluminium MMC with hardness
SiC size (µm) 10 10 10 20 20 20 40 40 40
SiC weight % 5 10 15 5 10 15 5 10 15
BHN 83 84.52 86.66 78.33 82.33 83.6 75.16 76 78.3
Figure 1. SEM images of Al5059/SiC/MoS2
value of wear rate and co-eicient of friction. After each experiment, the disc and pins are cleaned with acetone to eliminate impurities and wear debris attached on composite
(1)
Where W is the wear rate of the sample, Δmg is the weight loss by sample after wear test, and S is the sliding distance.
(2)
Where µ is the friction co-eicient of the sample, FF is the friction factor of the sample, and L is the load applied on sample.
2.5 Design of experiments
In order to achieve better performance of products and processes Design of Experiments (DOE) is a best technique used for experimentation.The Design of Experiment (DOE) technique is adopted in this study to plan the sequence and scheme of investigation. Designing the experiment suitable to a particular problem situation is an important issue.In the present study ive control factors such as particle size and weight percentage of SiC, load, sliding speed and sliding velocity with each three levels are chosen and the values are given in table 3. For the selected process parameters, the best suited array is L27 orthogonal array that is shown in table 4.
In Taguchi method, the response are analyzed in terms of Signal-to-Noise (S/N) ratio, which accounts the sensitiveness of an output measured to the noise factor or uncontrollable factor. The proper S/N ratio must be chosen among the three 'Larger is better', 'Nominal is best' and 'Smaller is better'. The current purpose of this problem is to minimize the wear rate and friction coeicient of the composite material. Hence, the S/N ratio for smaller is better which is selected and calculated using the following formula.
(3)
3. Result and Discussion
3.1 Analysis of process parameters
The objective of the experiment is to ind out the control factors which inluence the minimum wear rate and coeicient of friction with S/N table using Minitab 16 software. An
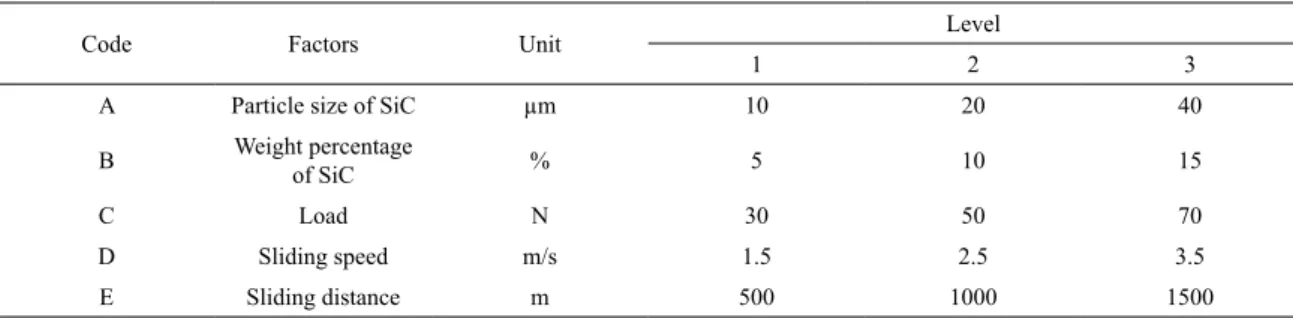
Table 3. Process parameters and their levels
Code Factors Unit Level
1 2 3
A Particle size of SiC µm 10 20 40
B Weight percentage of SiC % 5 10 15
C Load N 30 50 70
D Sliding speed m/s 1.5 2.5 3.5
E Sliding distance m 500 1000 1500
orthogonal array of L27 shown in Table 4 was chosen to develop
the experiments. The S/N ratio for "smaller the better" for wear resistance and co eicient of friction at each process parameter level is depicted in Table 4. The purpose is to analyze the most contributing factors of weight& particle size of SiC with constant 2% of MoS2 on wear rate and friction
coeicient. The output experimental data is transigured into S/N ratio. Efects of input parameters such as particle size, weight percentage of SiC, sliding speed, applied load and sliding distance on wear rate and coeicient of friction were examined by signal to noise ratio. From the response graph it is clearly depicted that the most inluencing parameters could be easily identiied by seeing the graph. From the graph, optimum experimental conditions at which minimum wear rate obtained is found to be A1B3C1D1E1 i.e. Particle
size of 10 µm, Weight percentage of SiC at 15%, Load of 30N, 1.5m/s of sliding speed and 500m sliding velocity. From the graph, optimum experimental conditions at which minimum wear rate obtained is found to be A1B3C1D1E1 i.e.
Particle size of 10 µm, Weight percentage of SiC at 10%, Load of 30N, 1.5m/s of sliding speed and sliding distance at 500m.To reduce the wear rate of the composites the weight percentage of SiC should be maximum at 15%. Since the hardness of the composites are increased this tends to decrease the wear loss. Table 5 e 6 shows S/N ratio response table for wear rate and friction co-eicient. The ranking of input factor on the efect of wear behaviour is found based on the
Δ value. The high Δ value possesses the great inluence of considered factors.
The tables 5 and 6 show the efective inluence on coeicient of friction and wear rate. The most afecting factor for wear rate is exerted by applied load followed by sliding distance, sliding speed, and weight percentage and particle size of SiC. The rise in load on the composite leads to major wear loss. Because increase in applied load declines the existing tribolayer which results in conversion from mild stage to rigorous wear loss. This study also accredited higher load reduces which the wear resistance aluminum matrix composite27,30.
Weight percentage of SiC is the second factor that involves in afecting the wear rate.The wear resistance of the composite is low at 5% of weight percentage and it gradually increases with the increase in percentage of reinforcement at
/
W
=
D
mg s
/
FF L
n
=
/
log
S N ratio
10
y
n
i2
=-Table 4. L27 orthogonal array and results for Al5059/SiC/MoS2 composite
Sl.No size (µm)Particle SiC (%) Load (N) speed (m/s)Sliding distance (m)Sliding Wear rate (mg/m) S/N ratio Co-eicient of friction S/N ratio
1 10 5 30 1.5 500 0.0031 50.172 0.333 9.55 2 10 5 30 1.5 1000 0.0030 50.457 0.380 8.40
3 10 5 30 1.5 1500 0.0033 49.629 0.430 7.33 4 10 10 50 2.5 500 0.0040 47.958 0.300 10.4
5 10 10 50 2.5 1000 0.0048 46.375 0.330 9.62 6 10 10 50 2.5 1500 0.0054 45.352 0.360 8.87 7 10 15 70 3.5 500 0.0060 44.437 0.350 9.11 8 10 15 70 3.5 1000 0.0069 43.223 0.400 7.95 9 10 15 70 3.5 1500 0.0077 42.270 0.440 7.13 10 20 5 50 3.5 500 0.0073 42.733 0.190 14.4 11 20 5 50 3.5 1000 0.0084 41.514 0.250 12.0 12 20 5 50 3.5 1500 0.0090 40.915 0.280 11.0
13 20 10 70 1.5 500 0.0053 45.514 0.350 9.11 14 20 10 70 1.5 1000 0.0060 44.437 0.380 8.40
15 20 10 70 1.5 1500 0.0066 43.609 0.410 7.74 16 20 15 30 2.5 500 0.0025 52.041 0.360 8.87 17 20 15 30 2.5 1000 0.0031 50.172 0.320 9.89 18 20 15 30 2.5 1500 0.0032 49.897 0.420 7.53 19 40 5 70 2.5 500 0.0131 37.654 0.340 9.37 20 40 5 70 2.5 1000 0.0140 37.077 0.360 8.87 21 40 5 70 2.5 1500 0.0146 36.712 0.380 8.40 22 40 10 30 3.5 500 0.0046 46.744 0.310 10.1
23 40 10 30 3.5 1000 0.0054 45.352 0.330 9.62 24 40 10 30 3.5 1500 0.0060 44.437 0.340 9.37
25 40 15 50 1.5 500 0.0042 47.535 0.330 9.62 26 40 15 50 1.5 1000 0.0045 46.935 0.360 8.87 27 40 15 50 1.5 1500 0.0051 45.848 0.400 7.95
Table 5. S/N ratio response for wear rate (smaller is better)
Level Particle size(µm) SiC (%) Load (N) Sliding speed (m/s) Sliding distance (m)
1 46.65 42.99 48.77 47.13 46.09
2 45.65 45.53 45.02 44.80 45.06
3 43.14 46.93 41.66 43.51 44.30
Δ 3.51 3.94 7.11 3.61 1.73
Rank 4 2 1 3 5
Table 6. S/N ratio responsefor co-eicient of friction (smaller is better)
Level Particle size (µm) SiC (%) Load (N) Sliding speed (m/s) Sliding distance (m)
1 8.717 9.940 8.974 8.557 10.080
2 9.900 9.267 10.327 9.102 9.301
3 9.143 8.553 8.458 10.100 8.378
Δ 1.182 1.387 1.869 1.543 1.701
15% SiC. Again this study proved that the brittleness of SiC increases the wear rate while less amount of reinforcement remains the base as ductile and resist against the plastic deformation16. The response value indicates that weight
percentage range of 10 to 15% provides better wear rate due to higher hardness of the composite material. Particle size of reinforcement is the third factor that afects wear rate. Figure 2 shows that the wear rate is minimal at 10 microns and the wear loss increases with increasing the particle size. Small particle size (<10 µm) decreases the wear rate due to its ability to ill the pores and made a strong bondage with the base whereas large size particles failed and gradually increases the wear rate.
Figure 2. Inluence of various parameters on S/N ratio for wear
rate (smaller is better)
Sliding velocity is the next factor that inluences the wear rate. At minimal speed the wear loss is low, and the wear loss is increased with increasing the speed at high speed. The amount of reinforcements peeled out also increase due to the plugging action of steel counter face on the pin material but wear loss rise a little in further increase in velocity, and this might be the peeled out particles that acts as third body material which afect the wear loss. Sliding distance is the least factor that afects the wear rate. The range S/N ratio values from 47 to 42 shows that the wear loss gradually increases with increase in sliding distance. As running distance increases, the temperature increases and softens the material which leads to gradual wear loss.
Similarly igure 3 represents the optimum conditions for better co-eicient of friction that is A2B1C2D3E1. Weight
percentage of reinforcement and sliding distance must be minimal and a little rise in load ofers better friction co-eicient. Among all the control factors applied load is the major aspect for friction co-eicient of the composites in which cracks, contact area between friction pairs and de lamination increases with increase in load and extend to severe plastic deformation which leads to high tribo-surface removal. Further, friction coeicient gradually increases with increasing sliding distance ranging from 1000 to 1500m. During long running conditions the temperature also
Figure 3. Inluence of various parameters on S/N ratio for friction
co-eicient (smaller is better)
increases which soften the material that afects the friction co-eicient. MoS2 acts as a protective layer to isolate the
friction pairs and act as a solid lubricant. At high sliding distance the layers were broken into pieces and acts as third body particle that increases the friction co-eicient. Sliding velocity is the third factor that afects the friction co-eicient. Friction factor linearly decreases with increase in sliding speed at 3.5m/sec and this is due to the wettability between base and the reinforcement particles.
3.2 Analysis of variance
ANOVA is carried out to conclude the parameter which inluences wear bound such as particle size, weight percentage of SiC, load, sliding velocity and distance which inluence the quality of hybrid composite. By using ANOVA it could be determined that which is the most dominant factor which inluence the friction coeicient and wear rate by the percentage of contribution given to each particular input variable. The analysis is performed for ive input factors at 5% level of signiicance. The p- values which is below 0.05 is identiied as all the input variables are signiicant .The percentage level shows that factor C is major contributor and E is the least contributing factor on wear rate(From Table 7).It is cleared from percentage of contribution that load is the majorly afecting factor of contribution percentage (43.15%) followed by weight percentage of reinforcement (24.89%), particle size (16.12%),sliding distance (13.11%) and sliding distance (2.35%). by adding diferent weight percentage of MoS2 the consequences of weight percentage and particle
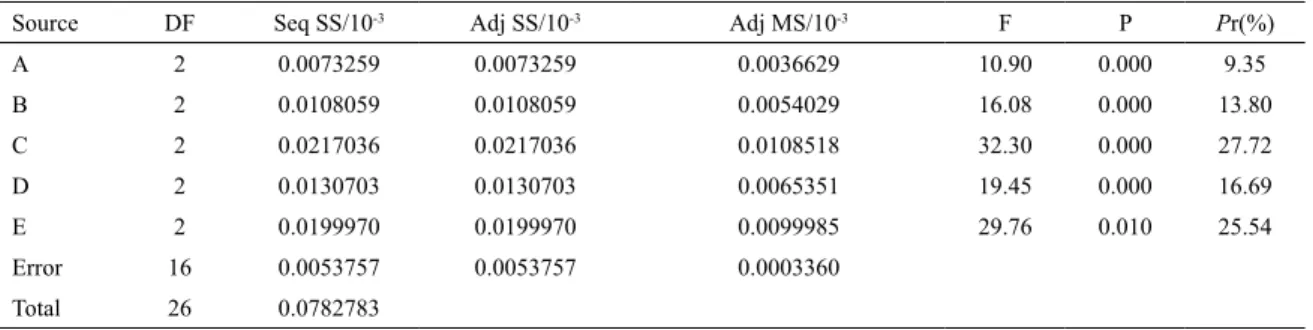
size of SiC on the wear rate of the hybrid composite material can be further investigated. Table 8 shows that factor C is the major factor that afects the friction coeicient. Pr(%) of
contribution for each factor is shown in the same table below.
3.3 Regression model
Table 7. ANOVA for wear rate of the hybrid composites
Source DF Seq SS/10-3 Adj SS/10-3 Adj MS/10-3 F P Pr(%)
A 2 0.0000445 0.0000445 0.0000222 312.19 0.000 16.12 B 2 0.0000687 0.0000687 0.0000343 481.89 0.000 24.89
C 2 0.0001191 0.0000119 0.0000595 835.48 0.000 43.15 D 2 0.0000362 0.0000362 0.0000181 253.82 0.000 13.11
E 2 0.0000065 0.0000065 0.0000033 45.66 0.000 2.35
Error 16 0.0000011 0.0000011 0.0000001
Total 26 0.0002760
Table 8. ANOVA for co-eicient of friction of the hybrid composites
Source DF Seq SS/10-3 Adj SS/10-3 Adj MS/10-3 F P Pr(%)
A 2 0.0073259 0.0073259 0.0036629 10.90 0.000 9.35 B 2 0.0108059 0.0108059 0.0054029 16.08 0.000 13.80
C 2 0.0217036 0.0217036 0.0108518 32.30 0.000 27.72 D 2 0.0130703 0.0130703 0.0065351 19.45 0.000 16.69
E 2 0.0199970 0.0199970 0.0099985 29.76 0.010 25.54
Error 16 0.0053757 0.0053757 0.0003360
Total 26 0.0782783
percentage of SiC (B), applied load(C),sliding speed(D),sliding distance(E)) and the response value (wear rate(W) and friction eicient(F)).the regression equations generated for co-eicient of friction and wear rate are as follows
Wear rate = -0.0029777+0.000102 A-0.00036 B+0.000127
C+0.0011222 D+0.000003E (4)
Co - eicient of friction = 0.28489 - 0.00039A + 0.0048 B+0.00051C - 0.0268D + 0.000066E (5)
3.4 Conirmation test
The conirmation test for dry sliding wear was carried out with set of levels and factors (as shown in table 9) to conirm the statistical analysis of this experimental work. Table 10 shows the test factors wear experiment. After conirmation test the results compared with computed results. The comparison of wear rate results of the composite shows the error range of (7.6% to 10.6%) and co-eicient of friction has the error range of (3.1% to 9.01%)
3.5 Worn out surface analysis
The variation of wear loss in Al 5059/SiC/MoS2 samples
with diferent, sliding distance, sliding speed load and weight percentage of SiC were shown in igure 4 as optical microscopic images. The optical microscopic images and Gwyddion WLI images shows that the wear tracks in various particles and weight percentage of SiC with diferent control parameters. The image clearly shows that the composites have three diferent layers. Initially, the red layer indicates the presence of reinforcement on the exterior part of the composites. Green depicts the occurrence of worn out tracks. Blue layer shows the ploughed out of reinforcement from the surface due to maximum load.
Figure 4a is the micrographic representation of Al5059/10µm/15% of reinforcement at applied load of 30N with 1.5 m/s sliding speed at a sliding distance of 500m, it shows the minute linear cracks on the worn surface that depicts gradual and minimal wear loss in these regions due to elevated hardness of the composites. In igure 4b the optical micrographic and WLI images of Al 5059/20µm/10% of SiC at a minimum load and sliding speed of 2.5m/s with the distance of 500m , it shows that the plastic low arises on the damaged surface is slightly higher due to the rise in sliding distance and decrease in percentage of SiC. In igure 4c the optical micrographic and WLI images of Al 5059/20µm/15%
Table 9. Conirmation test parameters
S/N Particle size(µm) SiC (%) Load (N) Sliding speed(m/s) Sliding distance(m)
1 10 5 38 1.7 600
2 20 10 64 2.9 1200
Table 10. Conirmation test results
Sl.No Experiment Wear rate(mg/m) Regression model Wear rate (mg/m) Error (%) co-eicient of Experiment friction
Regression model co-eicient of
friction Error(%)
1 0.0013 0.00378 7.6 0.32 0.31 3.12
2 0.0083 0.00832 6.02 0.34 0.32 5.88
3 0.016 0.01259 10.6 0.44 0.40 9.09
Figure 4. Optical microscopic and WLI images of damaged surface
of Aluminium 5059/SiC/MoS2 at various input conditions.(a)5%
&10 µm (b)10% &10 µm (c)5% &20 µm (d)15% &20 µm (e)5%& 40 µm (f)15%&40 µm
in the composites, the material hardness is minimum, therefore the wear loss occurs without efort in the layer composites.
In igure 4d the micrographic and WLI images of Al 5059/40µm/5% of SiC at a load of 70N and sliding speed of 3.5m/s with the distance of 1500m,The worn out layer of the composites increases than igure 4c due to increase in load and decrease in percentage of SiC .Figure 4e depicts the micrographic and WLI images of Al 5059/40µm/10% of SiC at a load of 50N and sliding speed of 3.5m/s with the distance of 1500m.The presence of particle size of SiC is 40µm and at maximum sliding speed the reinforcements are removed from the surface. Figure 4f the optical micrographic and WLI images of Al 5059/40µm/5% of SiC at a load of 70N and sliding speed of 3.5m/s with the distance of 1500m.At maximum process parameters and particle size with minimum weight percentage of SiC, the wear loss is maximum at minimum hardness in the composites the image also represents the completely plugged out reinforcement particles due to the rise in sliding speed. Due to increase in load the images shows large cavities that reveals that large size particles which failed to make a bondage with the base matrix and the high load on the composite samples leads to severe wear loss and long running and rotational conditions increases the temperature and soften the material which leads to severe metal removal. The MoS2particles
in the samples act as a self lubricant and form a protective coating against the frictional factors which minimize the frictional coeicient.
4. Conclusion
1. Al 5059/SiC/MoS2 composite was successfully
fabricated through stir casting method and Taguchi method was used to determine the optimized factors for Al 5059/SiC/MoS2 composite.
2. Load is the most inluencing factor which afects the wear rate of hybrid compositesalong withweight percentage of SiC, particlesize of SiC, increase in sliding velocity and distance. And the minimum wear loss occurs on A1B2C1D1E1 combination.
ANOVA test concluded that weight percentage 15% reinforcement with small size particles provides better wear rate. The major statistical inluence on wear rate is applied load (43.15%) followed by weight percentage of SiC(24.89%), particle size of SiC at applied load of 50N and maximum sliding speed
of SiC (16.12%), sliding speed (13.11%),sliding distance(2.35%).
3. The optimum condition for better friction co-efficient occurs on A2B1C2D3E1 combination,
load is the highest inluencing factor on friction co-eicient (27.72%) followed by sliding distance (25.54%),sliding speed(16.69%),weight percentage (13.80%) and particle size of SiC (9.35%). 4. The worn out surface proves that the optimal
combination of process parameters by Taguchi method is similar to that of the depicted images by Gwyddion software.
5. Acknowledgement
The authors gratefully acknowledge the help rendered by Dr. S.N. Mahalakshmi, Assistant professor of English, Department of Science and humanities, Anna University Regional Campus Coimbatore, towards enhancing the quality and presentation of this research article.
6. References
1. Harris SJ. Cast metal matrix composites. Materials Science
and Technology. 1988;4(3):231-239.
2. Chawla N, Chawla KK. Metal Matrix Composites. Springer; New York; 2006.
3. Prasad SV, Asthana R. Aluminum Metal-Matrix Composites for Automotive Applications: Tribological Considerations.
Tribology Letters. 2004;17(3):445-453.
4. Sanders RE Jr. Technology Innovation in Aluminium Products.
JOM. 2001;53(2):21-25.
5. Jaleel TKA, Raman N, Biswas SK, Murthy KSS. Efect of structural modiication and load on the wear of a hypereutectic aluminium-silicon alloy. Aluminium. 1984;60:E787-E789.
6. Modi OP, Prasad BK, Yegneswaran AH, Vaidya ML. Dry sliding wear behaviour of squeeze cast aluminium alloy-silicon carbide composites. Material Science and Engineering: A. 1992;151(2):235-245.
7. Uyyuru RK, Surappa MK, Brusethaug S. Tribological behaviour of Al-Si-SiCp composites/automobile brake pad system under
dry sliding conditions. Tribology International. 2007;40(2):365-373.
8. Modi OP, Rathod S, Prasad BK, Jha AK, Dixit G. The inluence of alumina particle dispersion and test parameters on dry sliding wear behaviour of zinc-based alloy. Tribology International. 2007;40(7):1137-1146.
9. Sajjadi SA, Ezatpour HR, Beygi H. Microstructure and mechanical properties of Al-Al2O3 micro and nano composites
fabricated by stir casting. Materials Science and Engineering: A. 2011;52(29-30):8765-8771.
10. Rebba B, Ramanaiah N. Evaluation of Mechanical Properties of Aluminium Alloy (Al-2024) Reinforced with Molybdenum Disulphide (MoS2) Metal Matrix. Procedia Materials Science.
2014;6:1161-1169.
11. Ahmad F, Jason Lo SH, Aslam M, Haziq A. Tribology Behaviour of Alumina Particles Reinforced Aluminium Matrix Composites and Brake Disc Materials. Procedia Engineering. 2013;68:674-680.
12. Kori SA, Chandrashekharaiah TM, Auradi V, Kabadi VR. Efect of Ti and B on the dry sliding wear behaviour of hypoeutectic Al-Si alloys. Industrial Lubrication and Tribology. 2008;60(1):46-55.
13. Song JI, Han KS. Efect of volume fraction of carbon ibers on wear behavior of Al/Al2O3/C hybrid metal matrix composites.
Composite Structures. 1997;39(3-4):309-318.
14. Das S. Development of Aluminium Alloy Composite for Engineering Applications. Transactions of the Indian Institute
of Materials. 2004;27(4):325-334.
15. Singh D, Singh H, Kumar S, Singh G. An Experimental investigation of Mechanical behaviour of Aluminum by adding SiC and Alumina. International Journal on Emerging
Technologies. 2012;3(1):178-184.
16. Suresh S, Sridhara BK. Efect of silicon carbide particulates on wear resistance of graphitic aluminium matrix composites.
Materials & Design. 2010;31(9):4470-4477.
17. Dolata-Grosz A, Wiekzoreck J. Tribological properties of hybrid composites containing two carbide phases. Archives of
Materials Science and Engineering. 2007;28(3):149-155.
18. He Z, Que W. Molybdenum disulide nano-materials: Structures, properties, synthesis and recent progress on hydrogen evolution reaction. Applied Materials Today. 2016;3:23-56.
19. Khan KB, Kutty TRG, Surappa MK. Hot hardness and indentation creep study on Al-5% Mg alloy matrix-B4C particle reinforced composites. Materials Science and Engineering: A. 2006;427(1-2):76-82.
20. Krishnamurthy L, Sridhara BK, Kabdul Budan D. Comparative Study on the Machinability Aspects of Aluminium Silicon Carbide and Aluminium Graphite Composites. Materials and
Manufacturing Processes. 2007;22(7-8):903-908.
21. Hashim J, Looney L, Hashmi MSJ. The wettability of SiC particles by molten aluminium alloy. Journal of Materials
Processing Technology. 2001;119(1-3):324-328.
22. Aruri D, Adepu K, Adepu K, Bazavada K. Wear and mechanical properties of 6061-T6 aluminum alloy surface hybrid composites [(SiC+Gr) and (SiC+Al2O3)] fabricated by friction stir processing. Journal of Materials Research and Technology. 2013;2(4):362-369.
23. Hashim J, Looney L, Hashmi MSJ. Metal matrix composites: production by the stir casting method. Journal of Materials
24. Naher S, Brabazon D, Looney L. Simulation of the stir casting process. Journal of Materials Processing Technology. 2003;143-144:567-571.
25. Prakash KS, Kanagaraj A, Gopal PM. Dry sliding wear characterization of Al 6061/rock dust composites. Transaction
of Nonferrous Metal Society of China. 2015;25(12):3893-3903.
26. Toptan F, Kerti I, Rocha LA. Reciprocal dry sliding wear behaviour of B4Cp reinforced aluminium alloy matrix composites. Wear. 2012;290-291:74-85.
27. Zhang L, He XB, Qu XH, Duan BH, Lu X, Qin ML. Dry sliding wear properties of high volume percentage SiCp/Cu composites
produced by pressure less iniltration. Wear.
2008;265(11-12):1848-1856.
28. Basavarajappa S, Chandramohan G, Mukund K, Ashwin M, Prabu M. Dry sliding wear behaviour of Al 2219/SiCp-Gr hybrid matrix composites. Journal of Materials Engineering
and Performance. 2006;15:668.
29. Ayyagari A, Scharf TW, Mukherjee S. Dry reciprocating sliding wear behaviour and mechanisms of bulk metallic glass composites. Wear. 2016;350-351:56-62.
30. Roy M, Venkataraman B, Bhanuprasad VV, Mahajan YR, Sundararajan G. The efect of participate reinforcement on the sliding wear behavior of aluminium matrix composites.