Key words: airlines, spinoff, strategic management.
Palavras-Chave: companhias aéreas, spinoff, estratégia.
Recommended Citation
Resumo
As empresas do setor aéreo têm sido discutidas recentemente quanto à gestão de algumas das suas divisões não-essenciais, como seus Programas de Milhagem. Uma "spinoff" é uma forma de contração que muitas empresas recentemente escolhido. Através de um spinoff, tanto a controladora quanto a controlada podem se concentrar em sua própria atividade, o que se traduz em um melhor desempenho de ambas as entidades. Este trabalho estuda as circunstâncias em que um spinoff é uma boa estratégia de ser perseguida, juntamente com algumas questões importantes que devem ser considerados para se chegar a tais acordos. Spinoffs são, basicamente, um "downsizing" da empresa-mãe e, portanto, a empresa menor deve ser economicamente mais viável por si só, do que como uma parte de sua controladora. A motivação para analisar este tema específico vem de uma questão de interesse atual: Em que circunstâncias seria vantajoso para uma companhia aérea a se desfazer de sua divisão de Programa de Milhagens, ou de outras divisões que não estão diretamente relacionados com a operação da companhia aérea? Neste trabalho, é realizada uma revisão da literatura apresentando as diferentes formas de contração corporativa e seu desempenho em diferentes circunstâncias. Três casos relacionados com a indústria da aviação são abordados: os spinoffs do TripAdvisor da agência web Expedia, do Programa de Milhagem Aeroplan da Air Canada, e do sistema de distribuição Sabre da American Airlines. Esses três casos ilustram algumas das principais questões que devem ser cuidadosamente considerados quando do spinoff de uma subsidiária. O trabalho conclui que os spinoffs são uma estratégia inteligente quando o foco da divisão removida é diferente daquele da empresa-mãe. No entanto, para salvaguardar as relações de negócios futuros, as duas entidades devem negociar acordos detalhados que são robustos o suficiente para desempenhar com sucesso em todas as circunstâncias antecipáveis.
Kutscher, E. (2014) A spinoffs study applied to the airline industry. Journal of Transport Literature, vol. 8, n. 2, pp. 134-177.
Erika Kutscher*
Abstract
Airlines have been recently debated the management of some of their non-core divisions, such as the Frequent Flyer Program (FFP). A spinoff is a form of corporate contraction that many companies have recently chosen. Through a spinoff, both the parent company and the divested subsidiary can each focus on their own activity, which translates into a better performance of both entities. This paper studies the circumstances in which a spinoff is a good strategy to pursue, along with some important issues that must be considered when reaching agreements. Spinoffs are basically a “downsizing” of the parent firm; therefore, the smaller firm must be economically more viable by itself than as a part of its parent company. The motivation for analyzing this particular topic comes from a question of current interest: Under what circumstances is it advantageous for an airline to spin off its Frequent Flyer Program, or other divisions that are not related with the airline’s operation? In this paper, an extensive literature review introduces the reader to the different forms of corporate contraction and their performance under different circumstances. Three cases related to the airline industry follow: the spinoffs of TripAdvisor from the web agency Expedia, of Air Canada’s FFP Aeroplan, and of American Airline’s distribution system Sabre. These three cases illustrate some of the key issues that must be carefully considered when spinning off a subsidiary. The paper concludes that spinoffs are a smart strategy when the focus of the spun off division is different from that of the parent company. However, to safeguard future business relationships, the two entities must negotiate detailed agreements that are robust enough to perform successfully in all foreseeable circumstances.
* Email: [email protected].
Research Directory
Submitted 14 Apr 2013; received in revised form 1 Jul 2013; accepted 7 Jul 2013
A spinoffs study applied to the airline industry
[Um estudo de "spinoffs" aplicado à indústria do transporte aéreo]
Massachusetts Institute of Technology - United States
Introduction
Managing the airline industry poses many challenges – intense competition, large fixed costs
and strong suppliers of goods and services complicate the situation. This hostile environment
forces airlines to push the boundaries and come up with creative ideas to improve the
business. Corporate restructuring is commonly used in this sector; Mergers and Acquisitions
(M&A) have been used extensively to generate synergies in costs and networks. M&A are
front-page events in newspapers worldwide, and a large number of academic studies cover
this topic. Corporate contractions such as spinoffs occur far less frequently and receive much
less attention despite the fact that they unlock significantly more value for the shareholders
than M&A do.
In the airline industry, spinning off a Frequent Flyer Program (FFP), for example, can be very
controversial. FPPs improve the profitability of the industry in two very important ways: first,
they generate a massive amount of information that boosts the capacity of the airline to
forecast passenger demand; and second, they reduce, to some extent, the price competition
among airlines by making the passenger less price sensitive. Unlike the airline industry, the
FFP business has a more benign competitive environment with low fixed costs and captive
customers.
At first glance, it appears that the FFP would be a textbook candidate for a corporate
contraction; however, only one airline has spun off that division completely. Can an airline
avoid conflict of interests between its main operations and the FFP business? Under what
circumstances is it better to separate them to maximize shareholder value? What actions are
needed to increase the chances of success in a separation? These are the type of questions that
many airlines and investors are asking.
The main goal of the paper is to understand the key factors that are important in the success of
corporate deconglomeration, focusing in particular on the airline industry. To find these key
success factors, the paper describes the different types of corporate contractions from tracking
stocks to sell-offs, covering also intermediate alternatives such as spinoffs and equity
performance of different types of corporate deconglomeration to understand what type of
performance would be expected in a generic case. Then, examples in the airline industry are
presented and analyzed in detail. Finally, this work explores and identifies new sources of
failure or success and presents conclusions and recommendations.
This paper is organized in the following way. Section 1 identifies the different types of
corporate contractions providing an historic perspective of their use and performance, along
with the theoretical sources of value and the literature concerns. Section 2 presents three
different examples of spinoffs from the airline industry in detail: Expedia and TripAdvisor,
Air Canada and Aeroplan, and American Airlines and Sabre. The last section presents
conclusions by contrasting the examples with the academic literature and with each other.
1. Corporate contractions in the finance literature
The academic finance literature includes considerable discussion of corporate expansion in
the forms of mergers and acquisitions (M&As). Literature about corporate “downsizing” is
less extensive, perhaps because breaking up can be perceived as a failure. Nevertheless, there
are still many articles and papers that focus their attention on the different forms of divesting
a firm and the results that this restructuring strategy yields. Many of these were written in the
1990s, a time in which spinoffs and other forms of corporate downsizing became very
popular. This Section summarizes the knowledge and main findings of the available literature.
It starts by defining the different forms of corporate contraction, continues by showing the
historic trends and ends by analyzing the results. Studies that analyze the source of value on
those results are then presented, closing with general concerns and costs that need to be taken
into account when performing a corporate contraction.
1.1 The different forms of corporate contraction
This section describes the most popular types of corporate contraction or divestitures and
summarizes them in four types: tracking stocks, spinoffs, equity carve-outs and sell-offs.
Typically distributed as a dividend to shareholders in the parent company, these shares can
also take the form of an initial public offering (IPO). The control of the subsidiary’s operation
remains in the hands of the parent company’s board as in one big company. However, through
this form of restructuring, investors can be aware of the profitability of parent and subsidiary
separately, which can be valuable information if the two entities are in different industries.
Tracking stocks can be useful as an acquisition currency.
In 1999, the Walt Disney Company issued tracking stocks for its web portal go.com right
when the dot-com bubble was emerging. When go.com was able to be valuated separately,
and in times when all the dot-coms were being highly valuated, Disney’s shareholders value
increased significantly. When the bubble ended, Disney decided to retire the tracking stock
(Lankford, 2000).
Spinoffs have a wide range of definitions and no common definition has emerged yet. Some authors use the term spinoff for any type of corporate contraction, while others are more
specific. This paper considers that spinoffs occur when an entire subsidiary of a parent firm
becomes an independent business with separate shares, separate managers that run the
company independently, and separate assets and liabilities. Similarly to tracking stocks, the
ownership is divided among shareholders of the parent firm as a dividend, in a pro-rata basis.
Because the new shares are just given and not sold, spinoffs (and tracking stocks) are tax-free
transactions in the US.
Two particular forms of spinoffs are split-offs and split-ups. The difference with respect to a
traditional spinoff, as explained by Tübke (2005), is that in a split-off shareholders of the
parent firm receive shares in a subsidiary in return of relinquishing their parent company
shares. Split-ups, on the other hand, occur when the parent company spins off all its
subsidiaries to its shareholders and ceases to exist. The parent shares are exchanged for shares
in one or more of the units that are spun off.
On October 31, 2011, ITT Corporation (a global manufacturer of highly engineered industrial
products and high-tech solutions) completed the split-off of its Water business, Xylem and
Defense business, Exelis. The two spinoffs were distributed in a “one-for-one” basis and the
old ITT, after the spinoff those shares were exchanged for 10 shares of Exelis, 10 of Xylem
and 5 of new ITT (Sauer, 2011).
An example of a split-up occurred in 2005 when the board of directors of Cendant decided to
break up the company. Cendant was a conglomerate built through a series of acquisitions that
included real estate companies Century 21 and Coldwell Banker, the car rental business Avis,
hotel chains Days Inn, Ramada and Super 8, and travel companies Orbitz, Cheaptickets.com
and Galileo International. After a difficult merger with CUC International (a company that
ended up being one of the biggest financial frauds in history), Cendant recognized that the
conglomerate structure was problematic and decided to split it up into separate businesses
(Gaugham, 2011).
Equity carve-outs are defined by Gaughan (2011) as a type of divestiture that involves the partial sale of equity interest in a subsidiary to outsiders. As in the previous cases, a new legal
entity is created, but with a stockholder base that may be different for that of the parent selling
company, given that part of the new firm stocks are sold to the public. Similarly to spinoffs,
the divested company has a different management team and is run as a separate firm. The two
main differences with spinoffs are, first, that an equity carve-out comes with a cash inflow
from the buyers, and therefore it is not a tax free transaction; and second, as it is a partial sale
in which the parent company generally keeps the majority of the shares, the decisions of the new management team are controlled by the parent firm’s board.
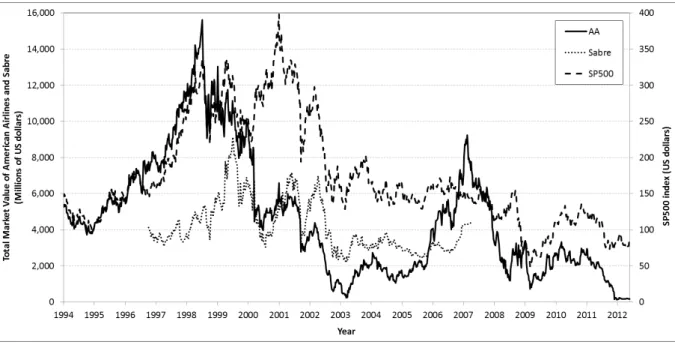
In 1996, American Airlines performed an equity carve-out for 18% of its distribution system,
Sabre. This new structure allowed Sabre to grow significantly, however, in order to gain more
independence and provide services to other airlines, Sabre spun off completely in the year
2000 and started trading as an independent company.
Sell-offs (also known as Buy-outs) are defined by Cusatis et al. (2001) as a divesting method in which the subsidiary is sold outright to another corporation or to the sub’s managers in a Leveraged Buy-Out (LBO). A sell-off is similar to an equity carve-out in the sense that it
generates a cash inflow to the parent firm, but differs in that the new divested company is
independent of the parent firm because no portion of it remains in the parent firm’s
In 1972 Air France created the hotel chain Le Méridien “to provide a home away from home for its customers.” The number of hotels grew fast and by 1991 the chain had 58 properties in Europe, Africa, the French West Indies, Canada, South America, the Middle East and
Mauritius. In late 1994, Air France sold off Le Méridien to Forte, a UK hotel giant. The
transaction allowed Air France to raise capital and better focus on its core business, the
Airline. Le Méridien also gained more focus and became very attractive to hotel companies.
As of June 2012, after several mergers and acquisitions, Le Méridien brand and management
fee business belongs to Starwood Hotels & Resorts Worldwide Inc., while the leased and
owned real estate assets belong to Starwood Capital, a company that is not affiliated with
Starwood Hotels & Resorts Worldwide Inc. (http://www.starwoodnet.com)
Table 1 summarizes the previously explained similarities and differences of the four types of
corporate contraction.
Table 1 - classification of the four types of corporate contraction
No cash inflow Cash inflow
Depends on parent firm Tracking stocks Equity carve-out
Independent of parent firm Spinoff Sell-off
Chemmanur and Liu (2011) developed a theoretical model to analyze company choices
among three of these four forms of corporate contraction: tracking stocks, equity crave-out
and spinoffs. The analysis is conducted with the objective of maximizing shareholders value.
The authors start from the premise that all three forms of restructuring result in an increase of
information produced for institutional investors. Based on this premise, they show that firms
with the most favorable private information choose to implement spinoffs, those with medium
private information choose equity carve-outs, those with less private information choose
tracking stocks, and finally, firms with unfavorable private information choose to remain
consolidated.
1.2 Historical trends
In the 1960’s, the number of divestitures was relatively small compared to the number of mergers and acquisitions. Companies were engaging in major expansions at this time, widely
1974 recession, companies felt the need to reconsider some of the previous acquisitions that
had proven to be poor combinations. Under the pressure of falling economic demand,
companies were forced to sell off divisions to raise funds and improve cash flow. Once the
crisis passed, the number of divestitures shrunk and remained low until the 1990’s. At that
time, the number of divestitures rose again, as downsizing and refocusing became prominent
business strategies. This was also the time in which the academic literature started publishing
many studies analyzing the matter.
Gaughan (2011) showed how the number of divestitures in the US follows the leading trend
of the mergers and acquisitions curve, after a short delay of about two years. Figure 1 shows
an intense peak of Mergers and Acquisitions activity in the late 1960s that was then followed by a peak in the divestitures curve in the early 1970’s. A similar phenomenon occurred again in the mid-1980s and the early 2000s. But by the mid and late 2000s, two new waves came, in
which no delay could be observed. Moreover, divestitures peaked in 2005 before the Mergers
and Acquisitions did in 2006.
Figure 1 - US Mergers and Acquisitions v/s Divestitures1
In the airline industry, the current tendency is for companies to merge. The fierce price war
that the many competitors have generated has turned the airlines into a very unprofitable
industry. Consequently, in the past decades airlines have started to merge to reduce
1
competition, expand their networks and take advantage of costs synergy. Table 2 shows some
of the recent M&As of US based and international airlines.
Gaughan proposed that many divestitures are the result of sell-offs of previous acquisitions.
Critics of corporate acquisitions use the records of divestitures following poor acquisitions as
evidence of ill-conceived expansion planning. However, one can argue that companies
sometimes acquire a firm because they are interested only in one particular division. It can be
understood that after absorbing the desired division, the company would divest the rest of the
acquired firm.
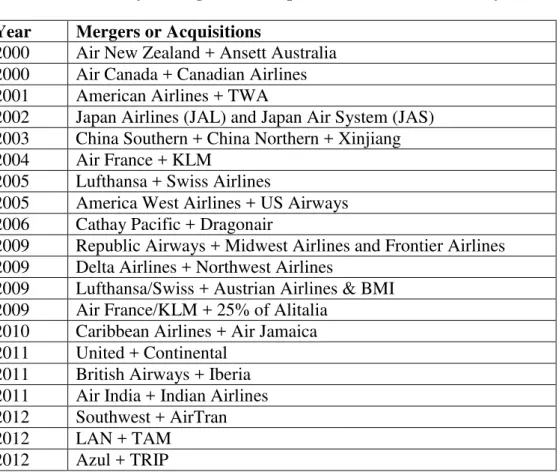
Table 2 - Major mergers and acquisitions of the 21st century
Year Mergers or Acquisitions
2000 Air New Zealand + Ansett Australia
2000 Air Canada + Canadian Airlines
2001 American Airlines + TWA
2002 Japan Airlines (JAL) and Japan Air System (JAS)
2003 China Southern + China Northern + Xinjiang
2004 Air France + KLM
2005 Lufthansa + Swiss Airlines
2005 America West Airlines + US Airways
2006 Cathay Pacific + Dragonair
2009 Republic Airways + Midwest Airlines and Frontier Airlines 2009 Delta Airlines + Northwest Airlines
2009 Lufthansa/Swiss + Austrian Airlines & BMI
2009 Air France/KLM + 25% of Alitalia
2010 Caribbean Airlines + Air Jamaica
2011 United + Continental
2011 British Airways + Iberia
2011 Air India + Indian Airlines
2012 Southwest + AirTran
2012 LAN + TAM
2012 Azul + TRIP
To merge successfully, these companies have to match their corporate structure and build
parallel accounting systems that can be financially merged. In order to achieve this match and
facilitate the merger, sometimes one of the companies has to spin off a division that the other
firm does not own or had divested in the past. Examples of such divisions could be a catering
1.3 Results
Several studies in the academic finance literature have documented significant positive results
around corporate spinoffs. Some of these studies analyze the stock price reactions at the
moment of the spinoff announcement, while others analyze it in the long run. Further studies
try to explain those positive reactions in the stock price by focusing on performance
improvements measured by indicators such as growth in sales, operating incomes, capital
expenditures or return on assets (ROA). These studies found that higher returns occur when
the parent firm and its subsidiary operate in different industries, from which they conclude that value creation comes from “corporate focus”, meaning that managers focus only on their own business. The following paragraphs describe the mentioned studies in further detail.
In the early 1980s, several researchers documented the positive effects that spinoff
announcements have on shareholders’ wealth. In their studies they propose three hypotheses
that may explain this phenomenon: (1) wealth transfers from bondholders to stockholders, (2)
relaxed regulatory or tax constraints, and (3) productivity increases from reducing diversity
under one management, allowing both entities to use unique sets of contracts in which each
has a comparative advantage. All of the researchers conclude that the third hypopaper is the
strongest.
A very interesting study by Hite and Owers (1983) shows positive abnormal returns2 to
shareholders of 116 firms that engaged in spinoffs during the period of 1963 to 1981. By
examining press announcements detailing the spinoff reasons, the authors classified their
sample in four groups: specialization in operations, facilitation of a merger, legal/regulatory
difficulties and unknown reasons. The stock price reactions in the two-day interval
surrounding the first press announcement showed no substantial differences and were
significantly positive for all four categories of spinoffs. But when analyzing the period from
the announcement to the initial trading day of the spun off subsidiary, the four groups show
substantial differences. Firms that were specializing operations showed returns of 14.5%;
firms facilitating mergers showed 11.6%. The firms in the third group chose spinoffs as a
response to regulatory or potential anti-trust intervention, and unlike the previous groups,
2
these firms experienced negative returns of –4.7%. Finally, the group of firms with unknown
spinoff reasons showed a return of 6.6%, which is approximately equivalent to the average of
the first three groups. The higher returns of the first two groups are consistent with the
reduced diversity efficiency hypopaper.
Veld and Veld-Merkoulova (2004) performed a similar study with 156 spinoffs from
companies in 15 different European countries. The authors found an abnormal cumulative
average return of 2.62% over the three-day announcement window, which increase to 2.66%
for the subsequently completed spinoffs. These returns are smaller than the ones found by
Hite and Owers, but still in line with US performance.
The positive impact on the stock price does not occur only at the moment of the spinoff
announcement or first trading day. These abnormal positive results also arise during the
subsequent years in which operational improvement actually takes place. Cusatis et al. (1993)
measured the stock returns of spinoffs, their parent firms, and spinoff-parent combinations for
periods of up to three years following the spinoffs. In order to create a comparable base, they
analyzed the spinoff and parent firm performance using raw and matched-firm-adjusted
returns. The authors found significantly positive abnormal returns for spinoffs, their parents,
and the spinoff-parent combination. Table 3 provides the mean returns for the spinoffs and the
parent companies for sub-periods corresponding to 6, 12, 24 and 36 months after the initial
day of trading. These increasing returns suggest that spinoffs provide superior long term
returns to investors of both the parent and the subsidiary.
Table 3 - Mean returns of common stock for spinoffs and parent firms3
Percent returns for each holding period
6 months Year 2 years 3 years
Spinoff 7.7 19.9 52.0 76.0
Parent 11.3 23.1 54.0 67.2
The authors also found that many of the firms in the study experienced a subsequent takeover.
Both spinoffs and their parent firms experience significantly more takeovers than do control
groups of similar firms and the abnormal returns in their stock price are limited to those firms
involved in takeover activity. Because of this finding, the authors conclude that spinoffs
3
provide a low-cost method of transferring control of corporate assets to acquiring firms who
will create greater value.
To explain the increases in the parent and spinoff stock prices, Daley, Mehrotra, and
Sivakumar (1997) examined the relationship between spinoffs and corporate focus by
comparing the performance of spinoff firms when the parent company and the spun off entity
were in two different Standard Industry Classifications (SIC) codes (cross-industry spinoffs)
relative to instances in which both were in the same SIC code (own industry spinoffs). The
study starts from the premise that dispositions involving assets outside of the core business of
a firm are viewed by the market as increasing in value while dispositions of core assets are
not. The shedding of these non-core assets is referred to as “increasing corporate focus.”
Analyzing the 85 spinoffs in the study, the authors looked for evidence to prove the premise,
while also distinguishing what the source of this value creation was.
The results, looking at the three-day announcement period, showed significantly abnormal
returns around the time of the announcement of cross-industry spinoffs only, which supports
the initial hypopaper. The authors found substantial improvements in ROA and various other
measures of performance for cross-industry spinoffs but not for own industry deals. They
interpreted this difference as indicating that performance improvements provide an
explanation for the value increase surrounding spinoff announcements, and that this is
associated with increasing corporate focus. The authors conclude that cross-industry spinoffs
create value only when they result in an increase in corporate focus. They attribute the
performance improvements to companies removing unrelated businesses, allowing managers
to avoid distraction of noncore entities and focus attention on the core operations they are best
suited to manage.
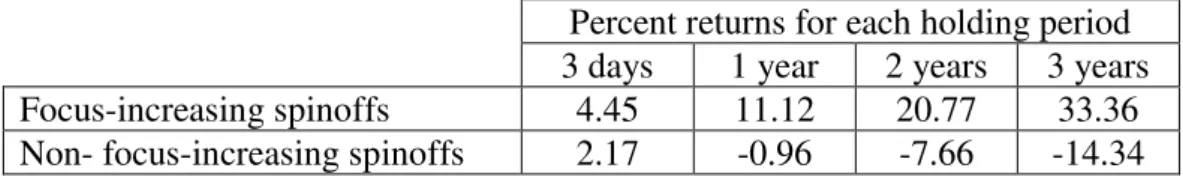
To complement the findings of Daley et al. (1997), Desai and Jain (1999) examined the
corporate focus and increased returns relationship in the long-run stock market performance.
They claim that the full impact of the managerial action is likely to be captured only through a
long-run study. Their results for the three day announcement period are similar to Daley et al.
findings. However, they show that the superior performance of the focus-increasing spinoffs
persists in the post-spinoff period. Table 4 shows the returns for the focus-increasing spinoffs
as one, two and three years following the spinoffs. The results are similar when the parent
firm and the subsidiary are examined separately.
Table 4 - Returns of focus and non-focus increasing spinoffs after different time periods4
Percent returns for each holding period
3 days 1 year 2 years 3 years
Focus-increasing spinoffs 4.45 11.12 20.77 33.36
Non- focus-increasing spinoffs 2.17 -0.96 -7.66 -14.34
Finally, the authors explore potential motivations for undertaking non-focus-increasing
spinoffs. They find that the reason to do so is simply because they are spinning off poorly
performing subsidiaries. They prove this premise by examining financial leverage and interest
coverage ratio to investigate whether these firms are in financial distress. They found no
evidence that spinoffs are motivated by a high level of financial leverage or financial distress.
Moreover, they do not find any evidence of disproportionate transfer of debt from the parent
firms to the subsidiaries through a spinoff.
Veld and Veld-Merkoulova (2009) summarize the findings of previous studies on spinoffs.
They conclude that the higher abnormal returns are associated with spinoffs in which there is
an improvement of industrial focus. The authors observe that larger spinoffs show higher
abnormal returns, which they relate with the industrial focus result, as bigger companies are
likely to present higher diversity in their subsidiaries focuses. The authors also find a
surprising result that reveals that spinoffs that were not completed show higher returns at the
moment of announcement than spinoffs that were completed later. They assume this happens
because spinoffs that were ex-post not completed were less expected by the market
participants.
1.4 Sources of value
We have seen that when a division operates in a different industry than the one of its parent
firm, divesting it allows managers on each separate entity to focus only on their own industry
which results in better performance for both parent and subsidiary. Separating parent firm and subsidiary helps to “unlock hidden value” by correcting the undervaluation of certain parts of
4
a conglomerate firm. This section presents different explanations for the positive abnormal
returns that are observed in all different types of corporate contraction.
Anslinger, Klepper and Subramaniam (1999) analyze spinoffs, equity carve-outs and tracking
stocks. The authors propose that gains in stock prices flow from four changes. First, there is
an increase in coverage by analysts. By exposing the division to the market, its operating performance becomes more transparent, which raises shareholder returns by revealing hidden
value. The authors explain that this transparency does not come from a greater quantity of
information provided by the company, which could happen without restructuring ownership,
but from an improvement in the quality of coverage by analysts. They can dedicate better
quality time to the separate companies because now each is categorized more specifically in
their own industry. In other words, the increase in return comes from accepting that the
conglomerate was being undervalued, also known in the academic literature as “diversification discount”, and that through a spinoff this lower valuation can be corrected.
Second, the restructured subsidiaries attract new investors. Empirical evidence demonstrates that there is a small overlap between people who invested in a parent company and those who
invest in its subsidiaries after a restructuring. To sustain this observation, the authors took 55
examples of all types of divestiture and compared the top 25 shareholders of the parent and
the subsidiary. On average, ownership overlapped by only 17% to 27%. A fair explanation for
this small overlap in investors is that, in theory, the market values a company as the sum of its
parts, analyzing the growth prospects of each of the separate businesses and using the market
view of predicted cash flows to determine the price of the stock. But in practice, the market
consists of many investors with their own individual criteria for making a purchase. The
problem is that investors who find a particular division of a company attractive might reject
the stock of the parent firm because, for example, it competes in a less attractive line of
business or has slower growth prospects.
Third, as shown in Section 1.3, restructuring of ownership generally improves the operating performance of both parent and subsidiary. Through issuing new equity, a company can offer managers incentives tied to the market performance of the divisions they run. This way,
managers can clearly indicate to investors, executives, and other employees, that performance,
ownership, risk and reward are bound together. In contrast, if the two entities operate
benefit of a different area in the company. This occurrence is also known as reverse synergy,
which means that the parts are worth more separately than they are within the parent company’s corporate structure.
Finally, restructuring can improve corporate governance and increase strategic flexibility, which can be achieved by pushing management accountability deeper into the organization.
For a subsidiary that is newly exposed to the market, greater examination by investors and
analysts creates a level of pressure to which management must respond. Operating
performance generally improves as a result. For management in poorly performing
businesses, the new accountability becomes tangible through lower compensation when the
stock weakens. Additionally, spinoffs can increase the strategic flexibility of businesses by
allowing a subsidiary to form relationships with companies that do not want competitive
information to flow to its parent firm. After being spun off from AT&T, Lucent was better
able to do business with international telecommunications companies that perceived its parent
firm as a rival.
For the case of sell-offs, the source of value generation lies in the fact that the high bidders of
the divested subsidiary are likely to get more benefit from it, while the parent firm will
probably get more benefit from the cash than from the subsidiary profits. When the market
responds positively to this asset reallocation, it is expressing a belief that the firm will use the
cash more efficiently than it was utilizing the asset that was sold. The selling firm has several
options when it is contemplating the disposition of the newly acquired cash. It may pay the
cash to stockholders in the form of a dividend or it may repurchase its own shares at a
premium. Either option will give the stockholders an immediate payout. Alternatively, the
firm could retain the cash and use it to pay debt or to finance internal investment.
Chemmanur and Yan (2003) present a new explanation for the performance and value
improvements that follow spinoffs. They develop a theoretical model to demonstrate that
spinoffs increase the probability of a takeover by a better management that will improve
value. The model consists of a firm with two divisions under one current management and a
rival management team that wants to get control of one of the divisions. Giving up control can
benefit shareholders, but involves a loss of control by the current management. A spinoff
increases the chances of losing that control, motivating the current management to two
two divisions to the rival management. Both choices lead to an increase in the combined
equity value. The authors also show that spinoffs can increase value even when there is no
better rival management to take over the division, just by serving to discipline firm
management.
1.5 Concerns
Despite all the mentioned advantages of a corporate contraction, companies sometimes
hesitate because they fear the costs and complexity that a restructuration may bring. The
following paragraphs describe some of the main concerns that firms face when they analyze a
divestiture.
Loss of stability: When performing a spinoff, the parent firm may doubt the ability of the subsidiary to survive independently. In the case of tracking stocks and carve-outs, some
companies may fear that the subsidiary might be taken over by their rivals, or that analysts
could exert pressure to spin it off completely. However, according to Anslinger et al. (1999), a
look at the survival rate of divestitures shows that of the 23 US-listed tracking stocks issued
between 1984 and 1999, only two were sold (Ralston Purina's Continental Baking Group and
USX's Delhi Group) and two were spun off (the Media Group from US West and EDS from
GM). The remaining 19 were still trading as tracking stocks. For carve-outs and spinoffs the
story was much the same. Fully, 77% of the majority-owned equity carve-outs created
between 1988 and 1993 were still trading as independent companies five years after issue.
Similarly, 76% of the 129 spinoffs survived at least five years. Of those that are no longer
trading, 81% were taken over and 19% delisted after filing for bankruptcy.
Redundancy and complexity of separate operations: When issuing new equity greater complexity is expected to arise. On the one hand, the board of directors will have to be
responsive to more than one set of shareholders. Moreover, the creation of equities to attract
different types of investors places a burden on senior management to communicate effectively
and consistently with each group. On the other hand, companies have some internal divisions
that provide service for the operations of both parent and subsidiary. Examples of such
divisions are the website, call centers, sales offices and the R&D department. Afterwards, the
parent firm and subsidiary will have to provide these services separately, losing the previous
relationships after the spinoff, the subsidiary will have to maintain interaction with many of
the parent’s departments. In a scenario of separate equity, the complexity of these interactions
is expected to increase.
Transaction costs: According to Anslinger et al. (1999), the direct transaction costs associated with raising new capital in the market through an equity carve-out can represent
2% to 5% of the transaction's total value; for a spinoff or tracking stock, the figure is around
2%. The higher percentage for carve-outs may reflect the fact that their offerings often come
in the form of an IPO and not a stock distribution. On top of these transaction costs,
divestitures that will maintain a business relationship must account for the costs of developing
a robust agreement. Furthermore, a subsidiary might want to pursue business with its parent’s
competitors. The Sabre Group, for instance, provides reservation systems not only for
American Airlines, its parent, but also for American’s rivals.
This Section has defined the different types of divestitures, followed by historical trends,
performance and the main factors involved. Although there are a large number of papers
covering this field of study, there is little research on the contractual relationships that the
parent and spun off company need to develop when these two entities pretend to maintain
tight commercial interactions. The following section presents real examples that will
contribute in finding the important factors that the parent firm and the spun-off subsidiary
need to take into consideration before they close the deal.
2. Case studies
After having defined and understood spinoffs and divestitures in general, this Section analyses
three cases of spinoffs around the airline industry. Airlines are a very difficult industry in
terms of profits. Since deregulation in 1978, many airlines have born and died. The industry
has faced alternate periods of gain and loss that have been amplified through time. In the last
decade the picture has become even more complex, which can be seen in Figure 2.
The three cases presented below are focus-increasing spinoffs, in which the parent firm and
the subsidiary have a different Standard Industry Classification (SIC) codes. Because of this
present positive results. Unfortunately, not all the presented cases show a positive outcome.
Through the analysis of these three cases, a new finding is presented. When a parent firm and
its divested subsidiary are going to maintain a business relationship after splitting up, what
determines the success of the divestiture is the robustness of the agreements that the two entities sign, prior spinoff. Among the three cases presented below, the first one requires no
future relationship and the outcomes predicted by the academic literature indeed occur. The
second and third cases consider a very important business relationship after the spinoff. In one
of them, the previous agreements were very robust, while in the other, many flaws can be
found. The results, as expected, are very different.
Figure 2 - World Airline Net Profit 1989-2010 (Source: IATA)
2.1 Expedia spins off TripAdvisor
The spinoff of TripAdvisor from its parent Expedia is a very clean example that illustrates
many of the concepts presented in Section 1. Stephen Kaufer, CEO and co-founder of the
Expedia is one of the largest online travel agency in the world. The company allows business
and leisure travelers to book flights, cruisers, hotels, cars and many other travel related
services. At the same time, Expedia allows travel suppliers to post their inventory and fares in
a much known website that customers visit very frequently. On the one hand, the website
benefits a travel supplier by driving in more demand. But on the other hand, the supplier is
hurt because it must drop prices for customers to choose it over other competitors. This sort of
price war is the biggest benefit for the consumers and the reason why they visit Expedia in the
first place. Consequently, the website provides a vast opportunity for advertising, as it reaches
a very valuable audience.
TripAdvisor is also a travel website, but unlike Expedia, it does not sell anything to travelers.
TripAdvisor assists customers for free in gathering travel information, posting reviews and
opinions of travel-related content and engaging in interactive travel forums. TripAdvisor is
one of the earliest adopter of user-generated content. Users are the ones that provide most of
the website content, and they also do it for free. In order to generate profit, TripAdvisor is
supported by an advertising business model, boosted by the popularity that the website has
earned.
Expedia has the classic search tool in which the client enters origin, destination and dates, to
find flights, hotels, cars and more. TripAdvisor on the other hand, asks the user to enter the
name of a hotel and/or city and then the web site shows reviews, pictures, promotions and
similar options. TripAdvisor also offers links to different web based agencies for flights and
hotels, such as Orbitz, Travelocity, Priceline and Expedia, among others, so that customers
can check prices and availabilities.
2.1.1 History and Business Plan
This section relates a brief history of Expedia and TripAdvisor along with their business
strategies, as it is presented in the two companies’ websites.
Expedia was created in 1996 as a small division within Microsoft. The division was an online
travel booking site, which gave consumers the option of research and travel booking from
their laptops, with no help of a travel agent. Three years later, when Expedia was no longer
company on NASDAQ under the symbol EXPE. The site runs through multiple Global
Distribution Systems (GDSs) including Amadeus and Sabre for flights and Worldspan and
Pegasystems for hotels.
In 2002, InterActiveCorp's (IAC), an e-commerce company that was taking over multiple
internet firms, acquired a controlling interest in Expedia. This new parent firm allowed
Expedia a faster growth thanks to the synergies with IAC’s other travel holdings. In the
subsequent years, IAC acquired more travel related companies including the websites
Hotels.com, and Hotwire; corporate travel management company Egencia; and the traveler
reviews & opinions site TripAdvisor. TripAdvisor was founded in 2000 by Stephen Kaufer,
and financed by Flagship Ventures, the Bollard Group and a few private investors.
In 2005, Chairman Barry Diller spun off all its travel businesses, including TripAdvisror,
under the name Expedia, Inc. The intention was to diminish the confusion investors had
about the ungainly IAC and that way unlock shareholders value. Expedia became an
independent business again, fully dedicated to online traveling, aiming to “become the largest
seller of travel in the world”5 by helping everyone everywhere plan and purchase everything
in travel.
In April 2011, Expedia announced its intentions to split into two publicly traded companies by
spinning off the TripAdvisor brand of travel sites. Although TripAdvisor is part of the online
traveling market, it differs from the other Expedia brands in the sense that it is not selling
anything to travelers. TripAdvisor finances itself through advertising of other brands. In an
interview to the news agency Reuters, Expedia CEO Dara Khosrowshahi explained that the
separation “allows the two businesses to be pure plays and to operate with the proper amount of focus to grow respectively.” In late 2011 Expedia, Inc. spun out TripAdvisor Media Group but retained its successful travel transaction brands. TripAdvisor started trading on the NASDAQ under the symbol ‘TRIP’ and IAC chairman Barry Diller became TripAdvisor’s chairman.
TripAdvisor is the giant in the travel reviews space. Every minute the site publishes 25 new
contributions and features over eight million candid traveler photos. The reviews site operates
in 30 different countries in Europe, Asia Pacific, the Americas and the Middle East. Besides the company’s main revenue stream of cost-per-click advertising, TripAdvisor also includes TripAdvisor for Business, a dedicated division that provides the tourism industry access to
TripAdvisor's millions of monthly visitors.
2.1.2 Financial Results
The spinoff of TripAdvisor from Expedia has shown results that are in line with the
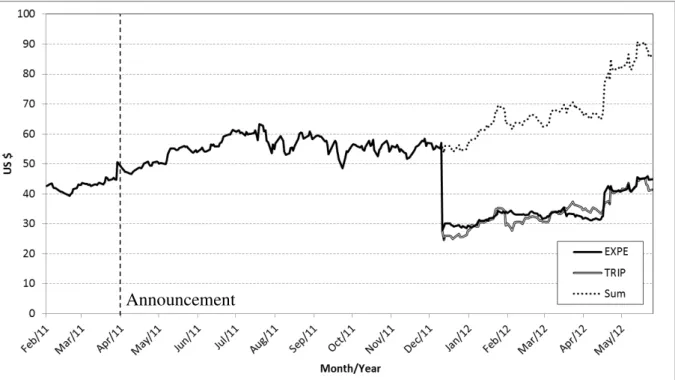
predictions of the academic literature. Figure 3 shows how the value of the Expedia stock
jumped in April 2011 at the time of the spinoff announcement increasing its value by 13% in
only a day. In the following three months the stock value increased an additional 21%. These
two positive returns reflect the investors’ belief in the effectiveness of a spinoff.
Figure 3 - Stock price of Expedia, TripAdvisor and the sum after spinoff6
From August 2011 the stock price remained relatively flat around $55, until December 2011,
where the spinoff formally took place. At that point the value of the Expedia stock dropped by
almost half, but if the initial value of the new TripAdvisor stock is added, then the total
shareholders value remained almost the same. Yet, in the six months post spinoff, both parent
6
Source: Bloomberg.
and subsidiary stocks grew again by approximately 55%, revealing that investors recognized
that the separate managements of both companies are now focusing better in their respective
industries. The day before the spinoff, the Expedia stock was worth $44.8; fourteen months
later the new Expedia stock is worth that same value and the TripAdvisor is worth an
additional $41.5. Assuming no other effects (which can be supported by the fact that the stock of Expedia’s direct competitor, Orbitz, dropped 1% in that same period), this result can be interpreted as if the Expedia Inc. of April 2011 was undervalued by almost half.
2.2 Air Canada spins off its FFP, Aeroplan
Air Canada, founded in 1936, is Canada's largest full-service airline. It serves over 170
destinations in five continents and is a founding member of Star Alliance, one of the world's
most extensive air transportation networks.
A Frequent Flyer Program (FFP) is a type of loyalty program that rewards passengers for their
ticket purchases with miles or points to gain their fidelity. Clients enrolled in the program can
exchange their points for more flight tickets, use them to obtain an upgrade from coach to
business class, or exchange them for goods or services of other companies registered in the
program. The first airline in the world that came up with the idea of a fidelity program was
Texas International Airline in 1971. Their idea was to give special fares to frequent
customers, but they never managed to implement it. In 1981 American Airlines launched
AAdvantage, the first FFP with the format we know today. It was quickly followed that same
year by United Airlines with MileagePlus and Delta Airlines with SkyMiles. (Rowell, 2010).
Nowadays, most airlines offer a FFP to their clients.
Airlines also benefit by having a FFP. First, clients stay loyal because in order to keep earning
points they are more inclined to choose this airline over its competition. And second, the
enrollment of the clients facilitates the airline’s data analysis when it comes to customer
behavior.
An FFP spinoff meets the condition of corporate focus. An airline’s main activity is to provide transportation for passengers and freight, in other words, move them from point A to
capture clients’ loyalty while making good use of distressed inventory7. The Airline’s source of profit comes from the margin of selling air tickets, freight space and other ancillary
revenues. The FFP on the other hand has a different set of three sources of profit. The first
one is the difference between the sales price of miles and the cost of the goods and services
that are given as awards. A second source of profit comes from the percentage of miles that
are never used. Aeroplan estimates this portion as 17%. Finally, the third source comes from
the fact that redemption of miles occurs, on average, 30 months after accrual. The FFP invests
its sales money during these 30 months before spending it on rewards, and receives interest.
Because of the different nature of Air Canada’s and Aeroplan’s value generation, it makes sense to have these two entities work independently and focus on their own purposes.
This second case relates the spinoff of Aeroplan, Air Canada’s FFP, as described by Aeroplan
itself in its Annual Information Form (AIF), an annex of the company’s annual report. An
examination of Aeropan’s business model follows, accompanied by the financial performance
that the two entities have shown since the spinoff.
2.2.1 History
Air Canada was founded in April 1936 as Trans-Canada Airlines (TCA) by legislation of the
Canadian federal government. The airline was a subsidiary of the Canadian National Railway.
By 1964, TCA had become Canada's largest national airline, and in 1965 its name changed to
Air Canada. In the late 1970s, Air Canada became an independent corporation, ending the
government's direct regulatory control over Air Canada's routings, fares, and services.
Deregulation of the Canadian airline market, under the National Transportation Act of 1987,
officially opened the airline market in Canada to equal competition.
In July 1984, Air Canada launched Aeroplan, a FFP fully integrated with Air Canada’s operations. In the following decade, the program grew rapidly in members and added several
travel-related partners. In 1991, Aeroplan obtained its first non-travel related partner: a bank
named CIBC, with which they launched the Aerogold Visa card. During this period, Aeroplan
also implemented three classifications: Elite, Prestige and Super Elite, designed to recognize
and reward its most frequent travelers with additional benefits.
7
On January 2002, Aeroplan was established as a wholly-owned limited partnership of Air
Canada with a dedicated management team focused on the development of the Aeroplan
Program. With this new format, the membership base began to grow even more rapidly and
more partners were added. Aeroplan also renegotiated its long-term agreement with CIBC,
resulting in an increase in revenues per each mile sold. This renegotiation also allowed for
less restrictive exclusivity provisions, which resulted in a long-term agreement in 2004 with
American Express, a multinational financial service corporation that, through its well-known
credit cards, holds a very popular Membership Reward program. In addition, Aeroplan made
a strategic shift to expand the reward portfolio by offering non-flight and specialty rewards.
Today, Aeroplan's roster of non-flight rewards includes more than 800 specialty,
merchandise, gift card and experiential rewards, as well as hotel and car rental rewards.
On April 1, 2003, Air Canada went bankrupt and filed for protection under the Companies'
Creditors Arrangements Act, the equivalent of the US’s Section 11. Eighteen months later, the
company emerged from bankruptcy as a subsidiary of ACE Aviation Holdings Inc., a
company created with the propose of bringing Air Canada back to regular business.
In June 2005, ACE, the new parent of Air Canada, performed an equity carve-out selling
12.5% of the division Aeroplan for $250 million through an IPO. Although the idea of
divesting the FFP was already in the mind of some US airlines, ACE made Air Canada the
first airline in the world to actually acomplish it. Aeroplan Income Fund became the first
publicly traded loyalty program in the world. The growth of the company continued and two
major events occurred during the three subsequent years of partial ownership.
The first event was Aeroplan’s acquisition of Loyalty Management Group (LMG), a loyalty
marketing business, based in Wales, England. LMG owned and operated the leading coalition
loyalty program in the United Kingdom: the Nectar Program. A few years later, and under
Aeroplan’s command, the program launched Nectar Italy in collaboration with Groupe
Auchan, a French international retail group, and Nectar Chile in collaboration with Cencosud,
the largest retail company in Chile and the third largest retail company in Latin America.
A second major event that took place during this partial ownership period was a very
maintained its previous reward grid called ClassicFlight and added ClassicPlus, both of which
are explained below. Through ClassicFlight, every month Air Canada offers the FFP 8% of its
seat capacity on every route, at a low flat mileage rate defined for each route based on its
length. With ClassicPlus the FFP can offer its members unrestricted access to available seat
inventory in both economy and executive class, by charging mileage levels that vary
depending on what paid fare is being offered for the flight. Aeroplan uses an innovative
availability and booking tool to source seat inventory and to calculate redemption mileage
levels on a real-time basis. The number of Aeroplan miles required to redeem a flight ticket is
based on actual airline ticket prices minus Aeroplan's negotiated discounts, as the airline's
largest purchaser of seats. Thus, the number of miles required varies in a way similar to
airline pricing, depending on factors such as origin, destination and seasonality, as well as the
time and day of travel.
In late 2006, ACE performed an equity carve-out of Air Canada, its main business, and the
Airline was listed again in the Toronto stock exchange. As of June 2012, ACE still holds part of Air Canada’s ownership, but it is planning to distribute its assets back to its shareholders by mid-2013. From 2006 to 2008, ACE sold all of its remaining holdings of Aeroplan, through
special distributions to its shareholders or sale on the secondary market. By May 2008 the
FFP was no longer under direct control of neither ACE nor Air Canada. Aeroplan Income
Fund, initially created as an income trust, converted to a public corporation in June 2008 and
subsequently changed its name to Groupe Aeroplan Inc.
On October 5, 2011, Groupe Aeroplan Inc. changed its name to Aimia, a global loyalty
management company with millions of members that earn Aeroplan miles and are part of a
growing network of over 75 world class partners, representing more than 150 brands in the
financial, retail and travel industries.
2.2.2 Business Model
Aimia is a global leader in loyalty management, whose principal business activities fall into
three categories: i) coalition loyalty programs, ii) loyalty marketing services and iii) other
related services, such as data analytics. This paper focuses in the coalition loyalty programs
As a coalition loyalty owner and operator, Aimia is responsible for establishing relationships
with Commercial Partners, issuing the applicable points or miles. Aimia also has
responsibility for the programs in terms of funding any required reserve, owning the
redemption liability and managing and earning breakage. In general terms, the coalition
loyalty business is based on two major streams of activity: First, the sale of points and related
marketing services to accumulation partners; and second, the delivery of rewards to members
through the purchase of rewards or shopping discounts from its redemption partners.
Aimia derives most of its revenues from the sale of points and marketing services to its
accumulation partners. The marketing services consist primarily of advertising and promotion
related services. Members accumulate points through their purchases of products and services
from an extensive network of accumulation partners, representing brands in credit and charge
cards, grocery, airline, retail and other industries. Once members have accumulated a
sufficient number of points, they are entitled to redeem those points for shopping discounts or from reward portfolios offered through Aimia’s various Redemption Partners.
Upon the redemption of points, Aimia purchases airline seats, shopping discounts or other
products or services in order to deliver the reward chosen by the member. At such a time,
Aimia incurs and recognizes an expense equal to the cost of the reward, and the deferred
revenue related to the points being redeemed is recognized as earned revenue. The other
significant expenses incurred by Groupe Aeroplan in relation to the operation of coalition
loyalty programs include contact center expenses, information technology costs and selling
and administrative expenses.
Based upon past experience, management anticipates that a number of points issued will
never be redeemed by members. This is known as Breakage. By its nature, Breakage is
subject to estimates and judgment, and is recognized as revenue prorated over the estimated
average life of a point. For the Aeroplan Program that average life is 30 months and it
represents the average period elapsed between the sale of a mile and its redemption for
rewards. For the Nectar Program the estimated life of a point is 15 months.
On an ongoing basis, the total estimated future redemption cost for outstanding points is
determined by Aimia as the product of first, the total outstanding number of unredeemed
cost per points redeemed in the period. Given that the future unit cost per point redeemed may
fluctuate, the Future Redemption Costs liability is periodically revalued using the actual
average unit cost per point redeemed, incurred in the most recent period. Finally, this future
redemption cost is paired with a present cash asset that Aimia can invest during the 30 month
period before purchasing rewards.
2.2.3 Agreements
As two independent companies, Air Canada and Group Aeroplan engaged on a long-term
strategic relationship that includes several agreements. One of these agreements states that
Aeroplan is required to purchase annually a minimum number of reward travel seats on Air
Canada Flights, representing 85% of the average number of seats utilized in the three
preceding calendar years. Based on the three years ending on December 31, 2010, Aeroplan is
required to purchase reward travel seats amounting to approximately $417.8 million each
year. In a like manner, Air Canada is required to purchase, on an annual basis, a
pre-established number of Aeroplan miles at a specified rate. The annual commitment is based on
85% of the average total Aeroplan Miles actually issued in respect of Air Canada flights or
affiliate products and services in the three preceding calendar years. The estimated minimum
requirement for 2011 is $215.3 million. Through these two agreements and many others that
are part of the long-term strategic relationship, the two entities protect themselves from abrupt
changes in the structure of the other entity.
The long-term strategic relationship also includes agreements to prevent competition. Air
Canada is not permitted to create or participate in any other FFP or customer loyalty
recognition program and Aeroplan cannot provide services to any other transportation
business that competes with Air Canada. However, these agreements exclude some Star
Alliance member airlines and their respective FFPs. In 2009, Aeroplan added TAM Airlines
and two new Star Alliance partners, Brussels Airlines and Continental Airlines, to its roster of
travel partners. In 2010, Aeroplan further announced the addition of Aegean Airlines to the
Star Alliance group, bringing the total number of airline partners to 33. As all of these
2.2.4 Stakeholders Analysis
The following analysis shows the interactions among the main stakeholders in the loyalty
generating system. These main stakeholders are the FFP, the airline, the partners (all
represented as one standard partner), and the clients (all represented as one standard client).
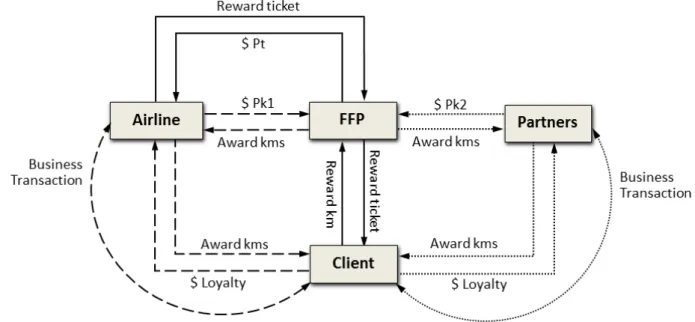
Figure 4 shows these four stakeholders and their interactions.
In Figure 4, arrows with the same pattern represent interactions that happen at the same time.
The award transaction among client, FFP and airline is shown by the arrows in the left of
Figure 4. In this transaction the airline awards a client with miles when he makes a ticket
purchase, in order to get his loyalty. Depending on the flight length and the ticket type (full or
discounted fare) the client receives a different number of miles. The airline has to purchase
these miles from the FFP at a previously agreed price. That price must satisfy two conditions:
First, the price cannot be higher than the loyalty valorization that the airline perceives;
otherwise, the airline has no incentive to purchase the miles. Second, the price must be high
enough to cover for the FFP expenses in reward tickets; otherwise the FFP has no incentives
to be in the business as their balance would always be negative. Using these two boundaries
the two entities will have to agree on a price that prevents them from transferring value from
one to the other.
A second award transaction, now among the client, the FFP and a partner, is represented by
the right side arrows in Figure 4. Here the partner is the one that wants to award miles to one
of its clients for a purchase that this client makes to the partner. The price that the FFP
charges the partner for these miles must also satisfy the two conditions described previously.
However, the price charged to the partner does not need to be the same price charged to the
airline. Given that the airline has more leverage in the equation, it will be charged less.
Moreover, the price charged to different partners does not need to be the same either.
Depending on the negotiations in every contract, each partner could be charged differently.
The reward transaction is represented by the top and center arrows. This transaction consists
of rewarding a client with a flight ticket in exchange for some of his miles. The client decides
he wants to redeem his miles, so he chooses a flight. The airline then calculates the cost of
that flight ticket, which is not necessarily the same as the ticket price. The airline then
transfer price, the FFP calculates a price in miles to be charged to the client. If the client
agrees with the miles price, all the reward transactions occur. If the client does not like the
price or his miles are insufficient, then the transactions do not occur, but the information of
the inquiry is saved in a database for future studies. All of these cost calculations must be
automatized so that the client receives an instant response on his inquiry.
Figure 4 - Stakeholders interactions Architecture diagram
Finally, there could be a final transaction, not represented in Figure 4, to show a reward from
a partner to a client through the FFP. The client gives miles away in exchange for a product or
service provided by the partner, not the airline.
2.2.5 Financial Results
To analyze shareholders value before and after these companies separated, this section first
recapitulates the ownership events that have occurred in the past decade:
By the year 2000, Air Canada was an independent firm listed in the Toronto stock exchange under the name AC.
In May 2005, ACE announced its intentions of offering an IPO for part of Aeroplan.
In September 2005, ACE sold part of Air Canada’s FFP Aeroplan through an equity
carve-out. Aeroplan started trading in the Toronto stock exchange.
From September 2005 to February 2006, ACE kept 85.6% of ownership of Aeroplan. After that ACE ownership was reduced to 75.3% until the end of 2006. By the end of
2008, ACE had sold all of its ownership on Aeroplan.
In December 2006, ACE performed an equity carve-out of Air Canada and the airline was listed in the Toronto stock exchange again under its old name AC (in series A and
B)
In Octber 2011, Aeroplan changed its name to Aimia began trading in the Toronto stock exchange under the name AIM.
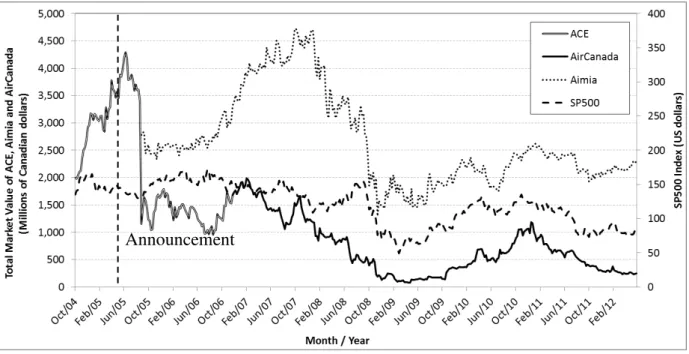
Figure 5 shows the total market value of Air Canada and Aimia and compares them with the
SP500 index for Airlines. Because AirCanada did not trade in the stock exchange from
October 2004 to December 2006, the figure shows an adjusted market value of ACE instead. ACE’s market value has been adjusted by subtracting the value of its ownership in Aeroplan, to better represent Air Canada alone.
After the equity carve-out announcement in May 2005, ACE’s shares increased their value by
7% in the first day and 12% in the first week and a total of 24% in the first month, with which
ACE reached its highest market value in its history. During the subsequent months the stock
price dropped back, and by the day of the IPO its value was the same as three month earlier
when the divestiture had been announced.
Right after the IPO, the market value of Aeroplan stayed relatively steady around $2,500
million of Canadian dollars for about nine months. However, in the subsequent months,
Aeroplan’s value starts increasing, reaching a peak of almost twice its initial amount in
October of 2007, after two years of separate operations. ACE did not show positive results
initially either. Its share price started increasing in October 2006 when they announced the