1 A Work Project, presented as part of the requirements for the Award of a Masters Degree in
Management from NOVA – School of Business and Economics.
INTERNATIONALIZATION STRATEGY OF SKYPRO TO THE
WEST COAST OF THE UNITED STATES OF AMERICA
Joana Carujo
–
2578
APPENDIXES
A project carried out on the SME Competitiveness: Internationalization Strategy
Field Lab, under the supervision of:
Professor Sónia Dahab
2
Contents
Appendix I: Skypro’s market distribution evolution ... 4
Appendix II: Skypro’s full collection ... 4
Appendix III: Skypro’s customer segments ... 5
Appendix IV: Skypro’s Balance Sheet 2015 ... 6
Appendix V: Financial Results in 1st semester 2015 and 1st semester 2016 ... 7
Appendix VI: Competitive Comparison ... 7
Appendix VII: Skypro VRIO Analysis ... 9
Appendix VIII: Costs per activities ... 12
Appendix IX: Value Chain diagram for Skypro ... 13
Appendix X: List of the companies involved in Skypro’s business ... 14
Appendix XI: Skypro’s SWOT analysis ... 15
Appendix XII: List of the initial bench of countries ... 16
Appendix XIII: Description of the variables used for the preliminary screening ... 16
Appendix XIV: Description of the criteria used for preliminary screening ... 17
Appendix XV: Preliminary Screening Index ... 19
Appendix XVI: Description of the variables used for the country overall ranking ... 21
Appendix XVII: Description of the criteria used for country ranking ... 22
Appendix XVIII: Country Ranking Index ... 24
Appendix XIX: States of west coast of the US ... 25
Appendix XX: US’s PESTEL analysis ... 25
Appendix XXI: US Top 10 Airlines ... 29
Appendix XXII: Interview Questions ... 29
Appendix XXIII: Interview Answers ... 30
Appendix XXIV: Porter 5 forces of the US supplying industry ... 32
Appendix XXV: West Cost States- Airline Analysis... 34
Appendix XXVI: Entry modes analysis ... 36
Appendix XXVII: Online Commerce ... 38
Appendix XXVIII: Specialized stores per state ... 38
3
Appendix XXX: Airport analysis ... 39
Appendix XXXI: Promotion activities ... 41
Appendix XXXII: Pricing strategy ... 41
Appendix XXXIII: Balanced scoreboard - Memo ... 42
Appendix XXXIV: WACC calculation ... 42
Appendix XXXV: Sources for WACC calculation ... 43
Appendix XXXVI: Skypro’s west coast potential demand ... 43
Appendix XXXVII: Sales estimation – Optimistic Scenario ... 44
Appendix XXXVIII: Sales estimation – Conservative Scenario ... 47
Appendix XXXIX: Costs of the project ... 48
Appendix XL: Profit and Loss statement for Optimistic scenario ... 49
Appendix XLI: Profit and Loss statement for Conservative scenario ... 50
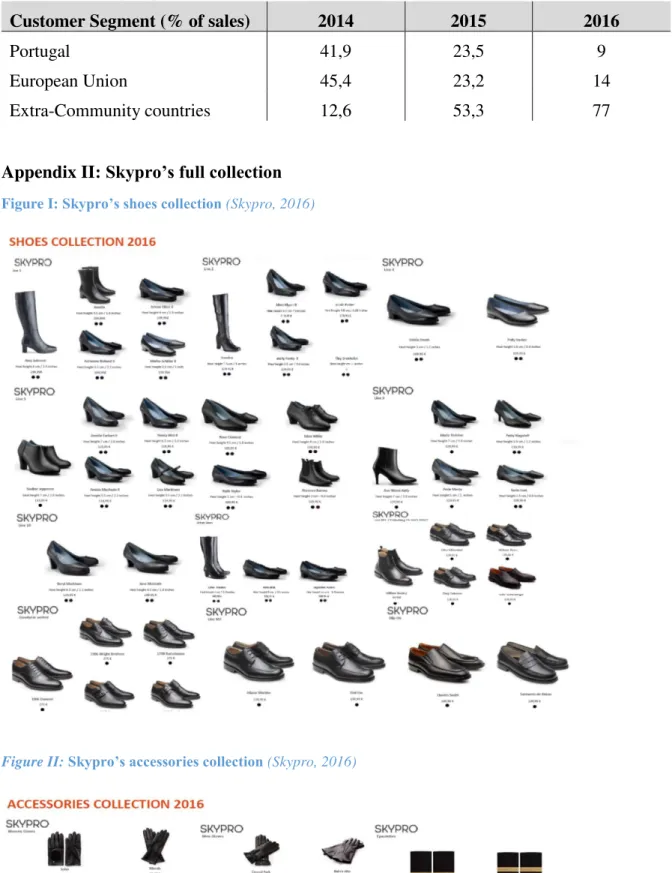
4 Appendix I: Skypro’s market distribution evolution
Table I:Evolution of Skypro’s market distribution from 2014 to 2016 (Skypro, 2016)
Appendix II: Skypro’s full collection
Customer Segment (% of sales) 2014 2015 2016
Portugal 41,9 23,5 9
European Union 45,4 23,2 14
Extra-Community countries 12,6 53,3 77
Figure II:Skypro’s accessories collection(Skypro, 2016)
5 Appendix III: Skypro’s customer segments
96,6% 3,4%
Customer Segment
B2B
B2C
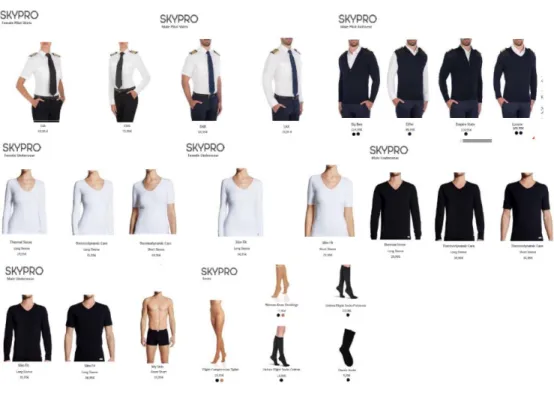
Figure III: Skypro’s clothing collection (Skypro, 2016)
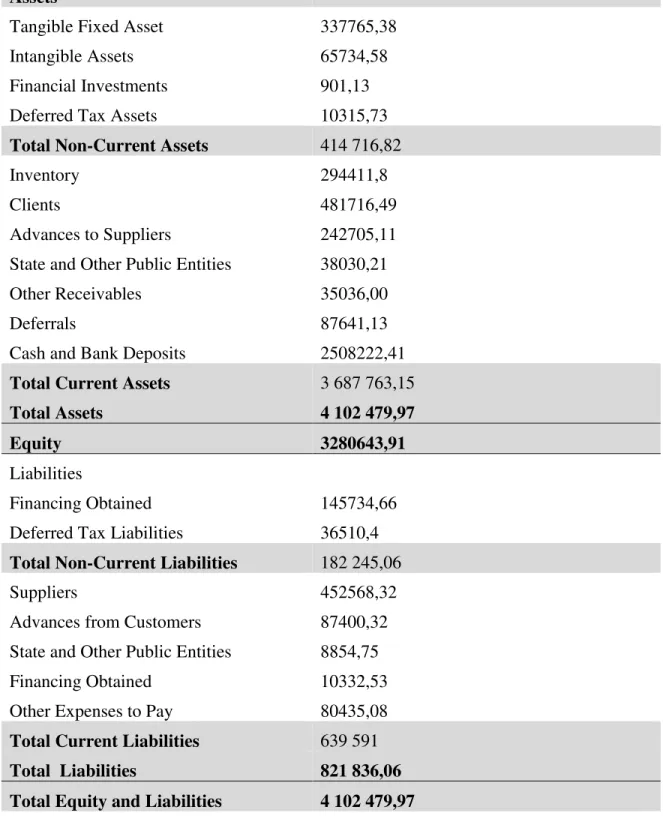
6 Appendix IV: Skypro’s Balance Sheet 2015
Table II: Skypro ‘s Balance Sheet 2015(in €) (Skypro, 2015)
Assets
Tangible Fixed Asset 337765,38
Intangible Assets 65734,58
Financial Investments 901,13
Deferred Tax Assets 10315,73
Total Non-Current Assets 414 716,82
Inventory 294411,8
Clients 481716,49
Advances to Suppliers 242705,11
State and Other Public Entities 38030,21
Other Receivables 35036,00
Deferrals 87641,13
Cash and Bank Deposits 2508222,41
Total Current Assets 3 687 763,15
Total Assets 4 102 479,97
Equity 3280643,91
Liabilities
Financing Obtained 145734,66
Deferred Tax Liabilities 36510,4 Total Non-Current Liabilities 182 245,06
Suppliers 452568,32
Advances from Customers 87400,32
State and Other Public Entities 8854,75
Financing Obtained 10332,53
Other Expenses to Pay 80435,08
Total Current Liabilities 639 591
Total Liabilities 821 836,06
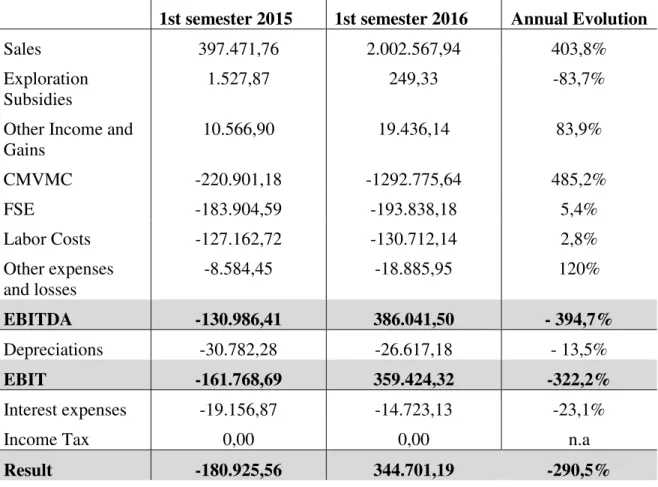
7 Appendix V: Financial Results in 1st semester 2015 and 1st semester 2016
Table III: Skypro’s financial report of the 1st Semester of 2015 and 2016 (in €)(Skypro, 2016)
1st semester 2015 1st semester 2016 Annual Evolution
Sales 397.471,76 2.002.567,94 403,8%
Exploration Subsidies
1.527,87 249,33 -83,7%
Other Income and Gains
10.566,90 19.436,14 83,9%
CMVMC -220.901,18 -1292.775,64 485,2%
FSE -183.904,59 -193.838,18 5,4%
Labor Costs -127.162,72 -130.712,14 2,8%
Other expenses and losses
-8.584,45 -18.885,95 120%
EBITDA -130.986,41 386.041,50 - 394,7%
Depreciations -30.782,28 -26.617,18 - 13,5%
EBIT -161.768,69 359.424,32 -322,2%
Interest expenses -19.156,87 -14.723,13 -23,1%
Income Tax 0,00 0,00 n.a
Result -180.925,56 344.701,19 -290,5%
Appendix VI: Competitive Comparison
Table IV: Skypro’s financial report of the 1st Semester of 2015 and 2016
Brands Origin Brand description
Features (Skypro, 2016)
Price
Skypro Portugal Excellent performance for aviation
professionals
Alarm-free; Cork midsole;
Anti-Skid;Comfort; Impact absorber
Women: $134,95 to $199,95
Men:$179,95 to $229,95$ Airline
shoes
--- --- Alarm-free; Anti-Skid; Comfort
---
Piccadilly Brazil Alarm-free; Comfort
Crew Shoes
8 Ecco Denmark Combines casual
style with quality
Comfort Women: $110$ to $170
Men: $110 to $330 Hush
Puppies
USA Casual’s footwear leader
Comfort Women: $60 to $120
Men: $109 to 200$ Aerosoles USA Women’s shoes
brand which combines comfort and style
Comfort Women:$80 to $140$
Men: N/A
Clarks UK Innovative and stylish footwear
Comfort Women: $110 to $160
9 Appendix VII: Skypro VRIO Analysis
Table V: Skypro’s organizational readiness and VRIO analysis
Resources Valuable Rare Non
Imitable
Organiza tional
Competitive Implication
Competencies
Product Development
Skypro’s mission is to offer additional benefits and different characteristics compared to the existing footwear’s brands in the market. The brand is also committed on extending its product line, namely pilots’ shirts, underwear and accessories.
YES YES NO YES Temporary
competitive Advantage
Innovation
Skypro’s footwear line displays anti-skid and anti-static’s characteristics in order to be slip and electrical resistant, decreasing the risk of accidents and injuries;alarm-free technology on metal detectors avoiding the inconvenience from the airport X-ray scanner; ambi-cork material for temperature control and innocuous leather to maximize quality and comfort (Skypro, 2016). Such technological and technical improvements are undetected in competitor, which resulted on the certification of the first footwear for aviation professionals.
YES YES NO YES Temporary
competitive Advantage
Procurement
As a consequence of outsourcing both manufacturing and distribution, Skypro needs to make the right decisions with respect to the purchasing
YES NO NO YES Competitive
10 of raw materials and other inputs, partnering with the best factories and
distribution companies. Supply Chain management
Managing the flow of raw materials to the factories, the manufacturing process and the distribution to the customer.
YES NO NO YES Competitive
Parity
Specialized Assets Brand
Skypro is a relatively young brand and is now developing its brand identity and increasing its brand awareness.
YES NO NO YES Competitive
Parity
Reputation
Skypro is building a reputation for a premium footwear product, which puts the aviation professionals’ comfort on the center of the equation. Being recognized as the 1st certified footwear for aviation professionals is the
proof of the reputation of its quality and superior product.
YES YES NO YES Temporary
competitive Advantage
Architecture of Relationships
Network of Associations and Developing Centers
Skypro belongs to associations such as IATA and APICCAPS in order to get a better knowledge and know how of the aviation industry. Also works with developing centers such as CTCP and CITEVE in trials and investigations.
YES NO NO YES Competitive
11 Customer Portfolio
It includes some of world’s top airlines such as Emirates,
Qatar Airways, Etihad Airways, TAP and Ethiopian Airlines. (Skytrax, 2015)
But very small presence in the B2C market.
YES NO NO YES Competitive
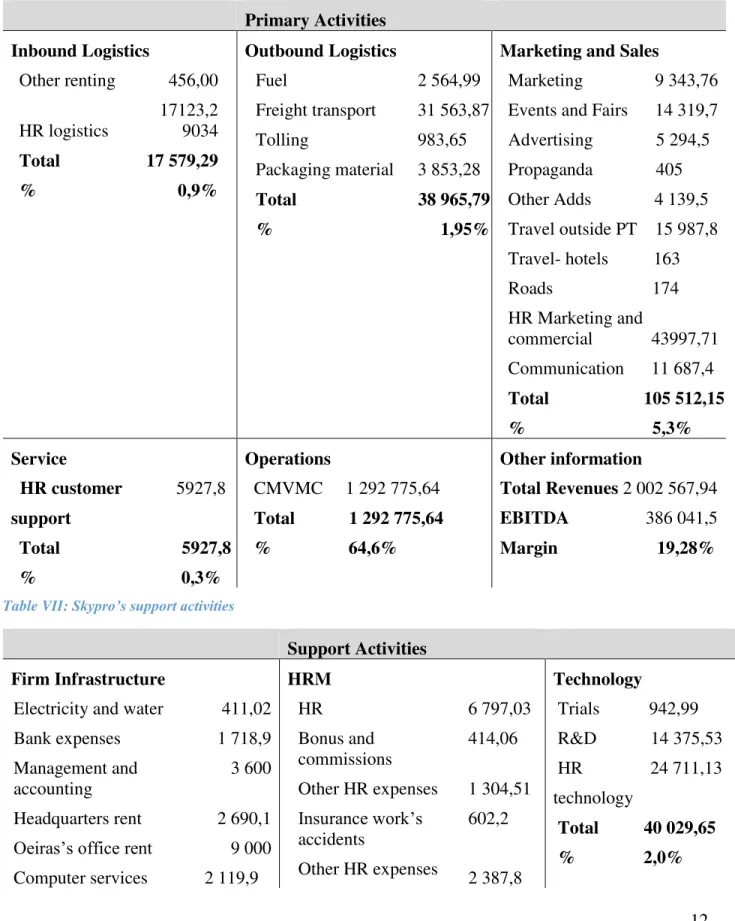
12 Appendix VIII: Costs per activities
Table VI: Costs of Skypro’s primary activities(in €) (Skypro, 2016)
Primary Activities Inbound Logistics
Other renting 456,00 HR logistics
17123,2 9034
Total 17 579,29
% 0,9%
Outbound Logistics
Fuel 2 564,99
Freight transport 31 563,87
Tolling 983,65
Packaging material 3 853,28
Total 38 965,79
% 1,95%
Marketing and Sales
Marketing 9 343,76 Events and Fairs 14 319,7 Advertising 5 294,5 Propaganda 405 Other Adds 4 139,5 Travel outside PT 15 987,8 Travel- hotels 163 Roads 174 HR Marketing and
commercial 43997,71 Communication 11 687,4
Total 105 512,15 % 5,3%
Service
HR customer 5927,8 support
Total 5927,8 % 0,3%
Operations
CMVMC 1 292 775,64 Total 1 292 775,64 % 64,6%
Other information
Total Revenues 2 002 567,94 EBITDA 386 041,5 Margin 19,28%
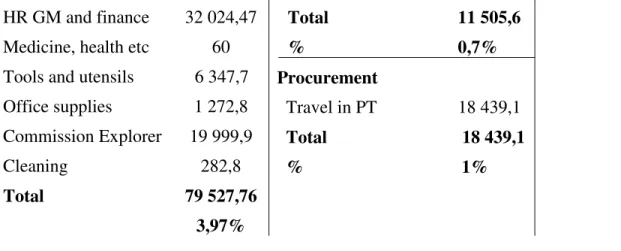
Table VII: Skypro’s support activities
Support Activities Firm Infrastructure
Electricity and water 411,02
Bank expenses 1 718,9
Management and accounting
3 600 Headquarters rent 2 690,1 Oeiras’s office rent Computer services
9 000 2 119,9
HRM
HR 6 797,03
Bonus and commissions
414,06 Other HR expenses 1 304,51 Insurance work’s
accidents
Other HR expenses 602,2
2 387,8
Technology Trials 942,99 R&D 14 375,53 HR 24 711,13 technology
13 HR GM and finance
Medicine, health etc Tools and utensils Office supplies Commission Explorer Cleaning
Total
32 024,47 60 6 347,7
1 272,8 19 999,9
282,8 79 527,76
3,97%
Total 11 505,6
% 0,7%
Procurement
Travel in PT 18 439,1 Total 18 439,1 % 1%
Appendix IX: Value Chain diagram for Skypro
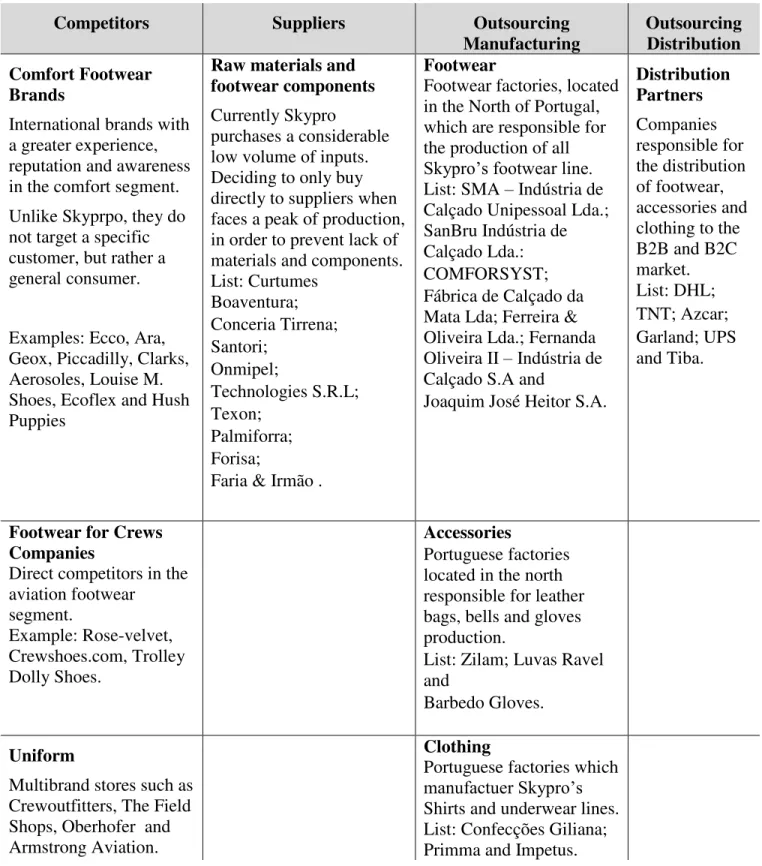
14 Appendix X: List of the companies involved in Skypro’s business
Table VIII: Skypro’s industry mapping (Skypro, 2016)
Competitors Suppliers Outsourcing
Manufacturing
Outsourcing Distribution Comfort Footwear
Brands
International brands with a greater experience, reputation and awareness in the comfort segment. Unlike Skyprpo, they do not target a specific customer, but rather a general consumer.
Examples: Ecco, Ara, Geox, Piccadilly, Clarks, Aerosoles, Louise M. Shoes, Ecoflex and Hush Puppies
Raw materials and footwear components Currently Skypro
purchases a considerable low volume of inputs. Deciding to only buy directly to suppliers when faces a peak of production, in order to prevent lack of materials and components. List: Curtumes Boaventura; Conceria Tirrena; Santori; Onmipel; Technologies S.R.L; Texon; Palmiforra; Forisa;
Faria & Irmão .
Footwear
Footwear factories, located in the North of Portugal, which are responsible for the production of all Skypro’s footwear line. List: SMA – Indústria de Calçado Unipessoal Lda.; SanBru Indústria de Calçado Lda.: COMFORSYST; Fábrica de Calçado da Mata Lda; Ferreira & Oliveira Lda.; Fernanda Oliveira II – Indústria de Calçado S.A and
Joaquim José Heitor S.A.
Distribution Partners Companies responsible for the distribution of footwear, accessories and clothing to the B2B and B2C market. List: DHL; TNT; Azcar; Garland; UPS and Tiba.
Footwear for Crews Companies
Direct competitors in the aviation footwear segment. Example: Rose-velvet, Crewshoes.com, Trolley Dolly Shoes. Accessories Portuguese factories located in the north responsible for leather bags, bells and gloves production.
List: Zilam; Luvas Ravel and
Barbedo Gloves. Uniform
Multibrand stores such as Crewoutfitters, The Field Shops, Oberhofer and Armstrong Aviation.
Clothing
15 Appendix XI: Skypro’s SWOT analysis
Table IX: Skypro’s SWOT
Strengths Weakness
Differentiated product- Skypro exploits a market niche which values firstly quality and comfort. To meet such customers, Skypro explores innovation and product development, taking advantage of technological and technical advances.
Low fix costs- Its outsourcing business model grants Skypro with minimal fix costs, providing financial flexibility.
High markup- Skypro registers an average profit margin of 39,2%.
Product development- Skypro has the ability to offer additional benefits and different
characteristics compared to the existing footwear’s brands in the market.
Quality Management- By prioritizing quality, Skypro puts great effort on maintaining a high level of excellence.
Market Knowledge- Partners with IATA, APICCAPS and other associations.
Customization- Personalization of the footwear for business customers.
Reputation- World’s first certified footwear for aviation professionals.
Low presence on the B2C market- The consumers market only represents 3,6% of skypro’s business. A market in which the company is able to get twice of the margin percentage as the one of the B2B segment. Low control on production availability- Its outsourcing business model gives little control of product availability and delivery deadlines.
Low brand awareness- Young brand with small brand identity and brand awareness, especially in a market when customers are big enterprises.
High bargaining power of suppliers- As a consequence of outsourcing production and distribution, the prices that factories and distributions companies charge to Skypro influence greatly its profit potential. Low Economies of scale- Its outsourcing business model does not allow to explore a cost reduction as a consequences of a higher quantity of resources employed.
Opportunities Threats
Low cost airlines- With small presence on the B2C market, such airlines might provide the match with it.
Extend the product line- Explore more its clothing and accessories lines.
Latent industries- Explore other professional crews such as navy, cruise and private security. E-commerce- Skypro already has an online sales channel, however the low presence among B2C customers gives it little relevance.
Intense competitive rivalry- International comfort footwear brands and cheap footwear brands are skypro’s main competitors. The footwear industry on its own it is already extremely competitive.
Rising presence of comfort footwear as substitute
16 Middle-East and African airlines - Rise of elite
Middle-East and African airlines might help to fortify its presence in such geographic markets. B2C segment- Increase its presence among personal customers, where obtains a higher profit margin and raises general brand awareness. Increase distribution channels- Currently Skypro is only available through its online channel and direct contact with airlines, experiencing a low customer reach.
Terrorism and fuel prices- Main threat for the airline industry which might decrease the air traffic, affecting negatively the number of professionals in the industry.
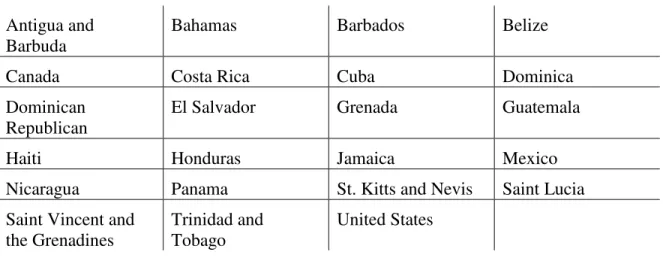
Appendix XII: List of the initial bench of countries
Table X: Initial bench of countries for preliminary screening
Antigua and Barbuda
Bahamas Barbados Belize
Canada Costa Rica Cuba Dominica
Dominican Republican
El Salvador Grenada Guatemala
Haiti Honduras Jamaica Mexico
Nicaragua Panama St. Kitts and Nevis Saint Lucia
Saint Vincent and the Grenadines
Trinidad and Tobago
United States
Appendix XIII: Description of the variables used for the preliminary screening
Table XI: Description of the macro-level variables used for preliminary screening
Variables used
1)Urban Population (thousand): Represents a country approximate potential demand.
17 Appendix XIV: Description of the criteria used for preliminary screening
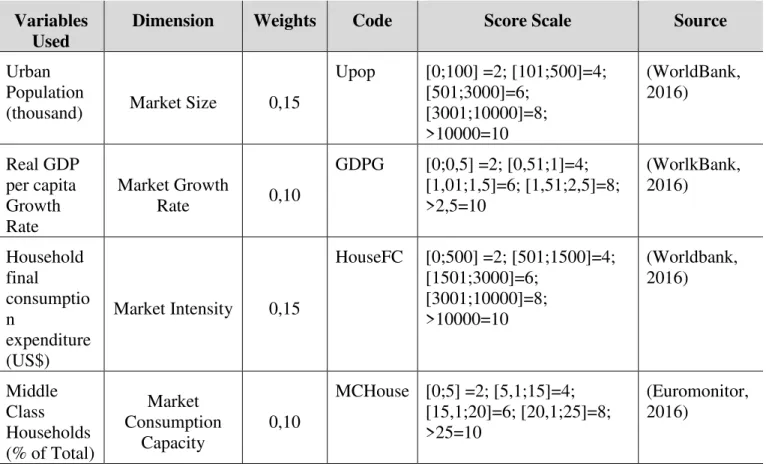
Table XII: Criteria for the preliminary screening: Variables, Dimension, Weights, Code, Score Scale and Source
3)Household final consumption expenditure (US$): Estimation of a country’s buying power.
4)Middle Class Households (% of total): Wight of the expenditure by middle class households in proportion to total.
5)Total Airports: Refers to the commercial infrastructure of a country.
6)Index of Economic Freedom: Measures the degree of economic freedom of a country.
7)Imports as % of GDP: Suggests a company’s receptivity to imports.
8)Country Risk Ranking: Refers to the risk of investing or lending in a country, arising from possible changes in the business environment.
Variables Used
Dimension Weights Code Score Scale Source
Urban Population
(thousand) Market Size 0,15
Upop [0;100] =2; [101;500]=4; [501;3000]=6; [3001;10000]=8; >10000=10 (WorldBank, 2016) Real GDP per capita Growth Rate Market Growth
Rate 0,10
GDPG [0;0,5] =2; [0,51;1]=4; [1,01;1,5]=6; [1,51;2,5]=8; >2,5=10 (WorlkBank, 2016) Household final consumptio n expenditure (US$)
Market Intensity 0,15
HouseFC [0;500] =2; [501;1500]=4; [1501;3000]=6; [3001;10000]=8; >10000=10 (Worldbank, 2016) Middle Class Households (% of Total)
Market Consumption
Capacity
0,10
MCHouse [0;5] =2; [5,1;15]=4; [15,1;20]=6; [20,1;25]=8; >25=10
18 Total
Airports Commercial
Infrastructure 0,15
Air [0;10] =2; [11;30]=4; [31;100]=6; [101;200]=8; >200=10
(WorldbyMap, 2016)
Index of Economic Freedom
Economic
Freedom 0,15
EF [0;50[ =2; [50;60[=4; [60;70[=6; [70,1;85[=8; >85=10
(Heritage, 2016) Imports as
% of GDP Market
Receptivity 0,05
Imp [0;10] =2; [10,1;20]=4; [20,1;40]=6; [40,1;50]=8; >50=10
(WorldBank, 2016)
Country
Risk Rating Country Risk 0,15
CRR D=2; C=4; B=6; BB,A=8; AA=10
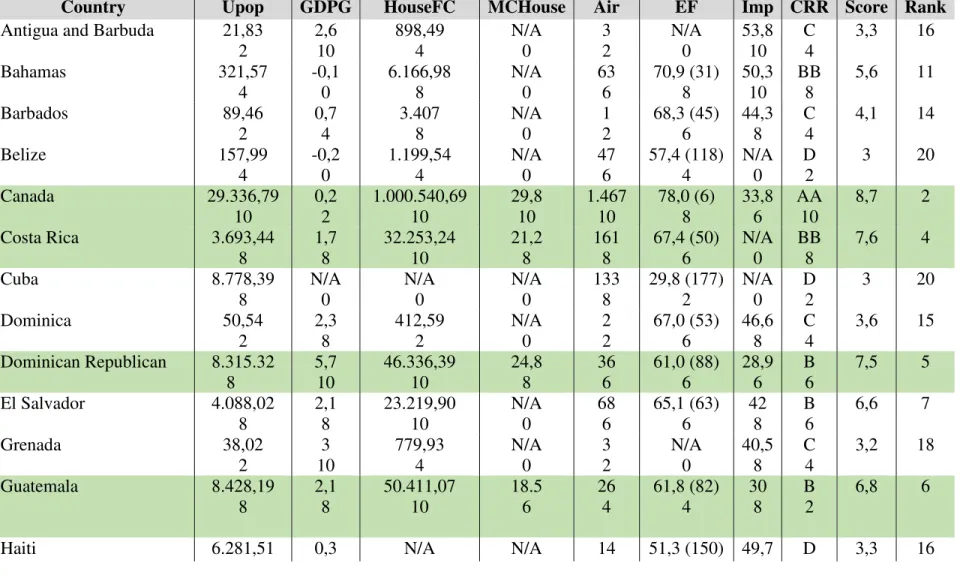
19 Appendix XV: Preliminary Screening Index
Table XIII: Preliminary screening index
Country Upop GDPG HouseFC MCHouse Air EF Imp CRR Score Rank
Antigua and Barbuda 21,83 2 2,6 10 898,49 4 N/A 0 3 2 N/A 0 53,8 10 C 4
3,3 16
Bahamas 321,57
4 -0,1 0 6.166,98 8 N/A 0 63 6 70,9 (31) 8 50,3 10 BB 8
5,6 11
Barbados 89,46
2 0,7 4 3.407 8 N/A 0 1 2 68,3 (45) 6 44,3 8 C 4
4,1 14
Belize 157,99
4 -0,2 0 1.199,54 4 N/A 0 47 6 57,4 (118) 4 N/A 0 D 2
3 20
Canada 29.336,79
10 0,2 2 1.000.540,69 10 29,8 10 1.467 10 78,0 (6) 8 33,8 6 AA 10
8,7 2
Costa Rica 3.693,44
8 1,7 8 32.253,24 10 21,2 8 161 8 67,4 (50) 6 N/A 0 BB 8
7,6 4
Cuba 8.778,39
8 N/A 0 N/A 0 N/A 0 133 8 29,8 (177) 2 N/A 0 D 2
3 20
Dominica 50,54
2 2,3 8 412,59 2 N/A 0 2 2 67,0 (53) 6 46,6 8 C 4
3,6 15 Dominican Republican 8.315.32
8 5,7 10 46.336,39 10 24,8 8 36 6 61,0 (88) 6 28,9 6 B 6
7,5 5
El Salvador 4.088,02
8 2,1 8 23.219,90 10 N/A 0 68 6 65,1 (63) 6 42 8 B 6
6,6 7
Grenada 38,02
2 3 10 779,93 4 N/A 0 3 2 N/A 0 40,5 8 C 4
3,2 18
Guatemala 8.428,19
8 2,1 8 50.411,07 10 18.5 6 26 4 61,8 (82) 4 30 8 B 2
6,8 6
20
8 2 0 0 4 4 8 2
Honduras 4.419,48
8 2,2 8 15.718,12 10 N/A 0 103 8 57,7 (113) 4 64 10 C 4
6,4 8
Jamaica 1.493,49
6 0,7 4 11.835,79 10 N/A 0 28 4 67,5 (48) 6 6,9 2 D 2
4,7 13
Mexico 100.656,07
10 1,2 6 882.462,13 10 25 8 1.714 10 65,2 (62) 6 37,5 6 AA 10
8,6 3
Nicaragua 3.486,50
8 3,8 10 9.759,75 8 N/A 0 147 8 58,6 (109) 4 55,5 10 D 2
6 10
Panama 2.616,49
6 4,1 10 25.005,20 10 N/A 0 42 6 64,8 (66) 6 N/A 0 BB 8
6,4 8
St. Kitts and Nevis 17,81 2 3,410 10 436,82 2 N/A 0 2 2 N/A 0 46 8 N/A 0
2,3 23
St. Lucia 34,23
2 1 4 802,96 4 N/A 0 2 2 70,0 (38) 6 50,3 10 N/A 0
2 10
St. Vincent and the Grenadines 55,33 2 1,4 4 638,53 6 N/A 0 6 2 68,8 (40) 6 53 10 N/A 0
3,2 18 Trinidad and Tobago 114,86
4 0,6 4 17.382,25 10 N/A 0 3 2 62,9 (73) 6 25,2 6 B 6
4,9 12 United States 262.332,40
10 1,6 8 11,865,941.00 10 20,9 8
c 75,4 (11) 8
15,5 4
AA 10
21 Appendix XVI: Description of the variables used for the country overall ranking
Table XIV: Description of the macro and industry level variables used to access the overall market attractiveness
Macro level Variables
9) Urban Population (thousand): Represents a country approximate potential demand. 10)Real GDP per capita Growth Rate: Estimates a country’s economy growth, indicating
its economic performance.
11)Index of Economic Freedom: Measures the degree of economic freedom of a country. 12)Imports as % of GDP: Suggests a company’s receptivity to imports.
13)Country Risk Rating: Refers to the risk of investing or lending in a country, arising from possible changes in the business environment.
14)Ease of Doing Business Ranking: Index which evaluates regulations for businesses and protections of property rights in each country.
Industry level Variables
15)Total Number of Airports: Refers to the commercial infrastructure of a country. 16)Airline Market Size Value (million $): Measures the entire market value of the airline
industry in each country.
17)Airline Market Value Year-on-Year growth rate: Estimates the economic growth of the airline industry in each country, indicating its economic performance.
18)Airlines IATA members by country: Allows to evaluate the relevance of each airline inside of the industry.
19)Value of sales of Low Cost Airlines (million $): Indicator of the economic performance of a segment of the airline industry in each country.
20)Total number of passengers carried: Indicator of the dimension of the airline industry.
21)Footwear retail value per capita (million $): Measures the entire market value of the footwear industry in each country.
22 Appendix XVII: Description of the criteria used for country ranking
Table XV: Description of the macro and industry level variables used for country overall ranking
Variables Used
Dimension Weights Code Score Scale Source
Urban Population (thousand)
Market Size 0,05 Upop [0;100] =2; [101;500]=4; [501;3000]=6; [3001;10000]=8; >10000=10 (WorldBank, 2016) Real GDP per capita Growth Rate Market Growth Rate
0,05 GDPG [0;0,5] =2; [0,51;1]=4; [1,01;1,5]=6; [1,51;2,5]=8; >2,5=10 (WorlkBank, 2016) Index of Economic Freedom Economic Freedom
0,05 EF [0;50[ =2; [50;60[=4; [60;70[=6; [70,1;85[=8; >85=10
(Heritage, 2016)
Imports as % of GDP
Market Receptivity
0,05 Imp [0;10] =2; [10,1;20]=4; [20,1;40]=6; [40,1;50]=8; >50=10
(WorldBank, 2016)
Country Risk Rating
Country Risk 0,05 CRR D=2; C=4; B=6; BB,A=8; AA=10 Euler Hermes,2015 Ease of Doing Business Rank
Ease of Doing Business
0,05 EDBR [189; 130]=2; [129;80]=4; [79,40]=6; [39;10]=8; [10;1]=10 (WorldBankGroup, 2016) Total Number of Airports Industry Infrastructure
0,08 Air [0;10] =2; [11;30]=4; [31;100]=6; [101;200]=8; >200=10 (WorldbyMap, 2016) Airlines Market Size Value (million) Industry Market Size
0,10 AirMS [0; 300]= 2; [301; 1000]= 4; [1001;3000]=6; [3001;10000]=8; >10000 (Euromonitor, 2016) Airlines Market Value Year on Year Growth rate
Industry market growth rate
0,08 AirMG [0;0,5]=2; [0,51;1,0]=4; [1,01:2,5]=6; [2,51;5,0]=8; >5,01=10 (Euromonitor, 2016) Airlines IATA members by country
0,125 AirMem [0,1]=2; [2,3]=4; [4,5]=6; [6,7]=8; >8=10
23 Value of
Sales of Low Cost Airlines (million $)
0,15 LowAir [0;200]=2; [201;500]=4; [501;1500]=6; [1501; 3000]=8; >3000=10
(Euromonitor, 2016)
Total passengers carried
0,10 Pass [0;1]=2; [2,01;5]=4; [5,01;20]=6; [20,01;60]=8; >60=10 (millions)
(Euromonitor, 2016)
Footwear Retail value per capita ($)
0,05 FootV [0;25]=2; [25,01;50]=4; [50,01;100]=6;
[100,01;200]=8; >200=10
(Euromonitor, 2016)
Footwear Market Year-on-Year growth rate (%)
0,025 FootG [0;0,5]=2; [0,51;1,0]=4; [1,01:2,5]=6; [2,51;5,0]=8; >5,01=10
24 Appendix XVIII: Country Ranking Index
Table XVI: Overall country ranking index
Country Upop EF Imp CRR EDBR Macro Score Total Score Rank
Canada 29.336,79
10 78,0 (6) 8 33,8 6 AA 10 14 8
2,2 7,95 2
Costa Rica 3.693,44
8 67,4 (50) 6 N/A 0 BB 8 58 6
1,8 4,2 4
Dominican Republican 8.315.32 8 61,0 (88) 6 28,9 6 B 6 93 4
2,0 3,7 5
Guatemala 8.428,19
8 61,8 (82) 4 30 8 B 2 81 4
1,9 3,2 6
Mexico 100.656,07
10 65,2 (62) 6 37,5 6 AA 10 38 6
2,2 7,8 3
United States 262.332,40 10 75,4 (11) 8 15,5 4 AA 10 7 10
2,5 9,15 1
Country Air AirMS AirMG AirMem LowAir Pass FootV FootG Industry Score
Canada 1.467
10 14.758,0 10 0,1 2 4 6 4.504,9 10 80.228.302 10 176,5 8 4 8 5,75
Costa Rica 161
8 323 4 6,6 10 1 2 N/A 0 1.617.076 4 N/A 0 N/A 0 2.4 Dominican Republican 36
6 1.347,3 6 2 6 0 0 N/A 0 14.463 2 N/A 0 N/A 0 1,7
Guatemala 26
4 201,4 2 4,2 8 0 0 N/A 0 93.129 2 N/A 0 N/A 0 1,3
Mexico 1.714
10 5.468,8 8 9,2 10 4 6 2557.24 8 45.560.063 8 95,5 6 5,3 10 5,6
United States 1.714
25 Appendix XIX: States of west coast of the US
Table XVII: 18 states of the west coast to consider
Washington Montana North Dakota South Dakota
Oregon Idaho Wyoming Nebraska
California Nevada Utah Colorado
Kansas Arizona New Mexico Texas
Alaska Hawaii
Appendix XX: US’s PESTEL analysis
Political
The year of 2016 was marked by a massive political buzz as a consequence of the 8th of November elections. The uncertainty coming from the presidential election focused on the topics related to the macroeconomic, security and international policies. Nonetheless, the US has a strong democracy and a well-defined political regime. The biggest concern for the American people is terrorism, which has raised questions about the national security policies and was in the center of the discussion of the 2016 presidential election. Nonetheless, the country experiences macroeconomic stability, especially in recent years since the 2007-2008 financial crisis. The recovery from the crisis has raised both US’s Gross Domestic Product
and employment. Moreover, in terms of political corruption, the US ranks 16th out of168
26 However, when questioned about which institutions the American population perceives as the most corruptive, they mention political parties, followed by the parliament and public officials. Private sector, in which its inserted Skypro, also shows a high degree of corruption. Moreover, the very low political restriction is applied to the business regulations, with economic freedom afforded to the private sector by allowing it to make the majority of its economic decisions. Lastly, in relation to international trade policies, the US has a small openness index, with total trade accounting for just 28% of its GDP. In this sense, it is expected that the closing of the Transatlantic Trade and Investment Partnership, a trade agreement between the US and the European Union, will boost trade between the two regions by increasing the American trade openness.
Economical
The US is the largest economy in the world and has shown positive evolution in terms of its GDP in recent years. It also has a high standard of living, which can be seen by the fact of its GDP per capita being ranked 9th worldwide (WorldBank, 2016). Recognizable as one of the most technological advanced economies in the world, the services industry dominates the economy, as well as the private sector. Real estate, professional and business services, financial services, health care and manufacturing are the biggest industries in the economy. Moreover, the country has a high level of living, with a GDP per capita of $55.836,8 (WorldBank, 2016) and its unemployment rate stands at 4,9%.
27 international trade agreements to be finalized are also hoping to help to boost the economy even more. Other negative aspects of the American economy are many related to the uncertainty from the 2016 presidential elections. However, a major economic concern for the US is related to the shortage of skilled labor that the country experiences, a fact that is sustained by the rise of employment aligned with a wage growth.
Societal
The 3rd biggest country in terms of total population, the US is following similar social and demographic trends as the world’s most developed countries: aging population, the rise of the urbanization and of the women’s role in the labor force and leadership positions. The US ranks 8th in the Human Development Index, with a score of 0,915. This shows that the country
is well advanced in terms of health (life expectancy), education (expected years of schooling), income (GDP per capita), gender equality, employment, security and among other human development indicators. Moreover, one of the biggest critics of the US governement stands in the fact that health care is provided by private organizations. Lastly, in terms of social trends, the US has become a more and more cosmopolitan society lifestyles and diversity, as a consequence of the rise of the urbanization in the country (WorldBank, 2016).
Technological
As mentioned previously, the US is one of the most technological advanced countries and its recognized as the world’s leader in science and technological breakthroughs. In that sense, the country invests greatly in Research & Development, ranking 1st on total R&D
28 Apple, Microsoft, Google, IBM etc. In fact, the country has many tech hubs spread all over its territory, which include Silicon Valley, Austin and the Research Triangle.
Environmental
The US is the 2nd biggest country in terms of CO2 emissions (WorldBank, 2016). Aware of
the environment threats that they face, an environmental movement started in the US which lead to the development of an environmental policy. In the last 30 years there have been significant achievements in terms of environmental regulation, including increases in air and water quality, as well as a control of hazardous waste. Modifications in the US’ energy policy and limits on the use of gas have been applied, due to the increase awareness and self-conscious attitude regarding the global warming.
Legal
29 Appendix XXI: US Top 10 Airlines
Table XVIII: Analysis of the top 10 airlines operating in the US regarding market share and respective hubs (Euromonitor, 2016)
Appendix XXII: Interview Questions
1- Does your airline offer uniforms to pilots and flight attendants? 2- Does your airline offer shoes to pilots and flight attendants?
3- If NO to questions above, where do you buy your uniforms and shoes?
4- Does your airline have a recommendation list regarding product specifications brands for your uniforms and shoes?
5- What is the price range you are willing to spend in shoes for working?
6- What characteristics do you value the most regarding footwear for working purpose? Top 10 Airlines Market
share
Hubs on the west coast
1 America
Airlines
20,9 3- Phoenix Sky Harbor International Airport; Dallas International Airport; Los Angeles International Airport
2 Delta Air Lines 19 0
3 United Airlines 16,9 4- San Francisco International; Los Angeles
International; Denver International Airport; George Bush Intercontinental Airport (Huston)
4 Southwest 11,2 1- Dallas International Airport 5 JetBlue Airways 3,6 1- Oakland International Airport
6 Alaska Airlines 2,6 4- Los Angeles International; Portland International Airport; Tacoma International Airport (Seattle); Ted Stevens International Airport
7 British Airways 1,8 0
8 Lufthansa 1,5 0
9 Virgin America 0,8 2 San Francisco International and Los Angeles International
30 7- Could you recommend a physical or online store specialized in aviation products to purchase footwear?
8- What is your impression of Skypro’s footwear products and its respective price? Appendix XXIII: Interview Answers
Nº of participants: 4 1- - Yes.
- Uniforms yes. - Uniforms yes.
- Uniforms yes, and the same applies for all the main airlines in the US. We have a yearly budget to spend in clothing and accessories available in an internal platform. 2- - No, and I have worked in 3 airlines and none of them offered shoes. US airlines do
not supply crew shoes. It is up to the individual to purchase appropriate footwear. - No.
- No.
- No, the yearly budget that we have does not include footwear.
3- - Me and the majority of my colleagues buy them at Clarks. Other regular shoe’s stores are also an option.
- I purchase shoes regularly, about 2 or 3 times per year and I have some preferred brands such as Aerosoles and easy spirit. We have 2 shoes per flight, for the outflight and inflight.
- Aldo, Aerosoles, Hush puppies etc.
31 4- - There is zero price and brand recommendations, the only requirement is usually that
out must be a leathery look, and can be polished.
- There are no brand recommendation but there are some specific recommendations regarding look and heels.
- Airlines do not suggest a specific brands. The specifications that exist are regarding the heels, which must be lower than 3inches and the look, must be black and cannot be suede.
- The purchase is up to the individual choice, just needs to comply with the standard recommendations.
5- - Between $60-$100. - $90-$100.
- $100.
- Around $100.
6- - Comfort and price/quality relationship. - Comfort.
- Comfort, style and affordability - Quality, price and design. 7- - Not that I know.
- I know that do exist some specialized stores but I think they target more regional airlines which do not offer uniforms. I prefer buying on well-known shoe’s brands. - No.
- No.
32 - Because I do not know the brand I cannot talk about the products. The prices are
expensive.
- The shoes looks good. If it is as good quality as they promise the price should not be a problem.
- I like the design but for trying out the price is a bit expensive.
Appendix XXIV: Porter 5 forces of the US supplying industry
Bargaining power of buyers: high, both when it comes to the B2B and to the B2C segment. When specialized brands of aviation professionals negotiate directly with airlines, they face an extremely powerful customer which benefits, in most of the cases, of a high quantity/low price per unit situation, decreasing the profit margin per unit. On the other hand, when the industry plays out as a B2C market, buyers see themselves with a wide range of choices, where prices vary a lot. Additionally, low switching costs and high replacement of products increase even more buyers’ power as the purchase of uniforms and shoes occurs regularly.
Also of noticing, the B2C market occurs more on skypro’s core business, footwear for aviation professionals.
33 Threat of new entrants: medium-low. The industry is not characterized by a large number of brands which target this niche, as a high market knowledge, know-how and a differentiated value proposition is needed to triumph in this market. Therefore, entering this niche market is perceived as a risk, making the threat of new specialized brands low. However, with the industry tendering to become more and more as a B2C segment, as a consequence of the growth of low-cost airlines and the number of aviation professionals, regular footwear and clothing brands are becoming noticeable in the industry.
Threat of substitutes: high as mentioned throughout of this paper, but mainly concerning footwear, where is less frequent airlines in the US granting it to its cabin crews. Additionally, as uniforms are in many cases customized, in opposition to shoes which are not, the footwear market is marked by an in intense threat of substitutes. In that sense, concerning footwear the industry is characterized by regular clothing and footwear brands such as Hush Puppies, Piccadilly, Clarks etc…
34 Appendix XXV: West Cost States- Airline Analysis
Table XIX: West cost airline analysis regarding large airports, US Top 10 airlines hubs and aviation professionals (flight attendants, commercial pilots and air controllers)
States Large Airports
(Federal Aviation Administration, 2016)
US Top 10 Airlines Hubs or Base
Nº of flight attendants (US Bureau of
Labor Statistics, 2016)
Nº of commercial pilots (US Bureau of
Labor, 2016)
Air controllers
(US Bureau of
Labor, 2016)
Washington 1 Seattle-Tacoma International 1- Alaska Airways 2,75 1.030 710
Montana 0 0 N/A 350 110
North Dakota
0 0 N/A 260 120
South Dakota
0 0 N/A 280 50
Oregon 1 Portland International 1- Alaska Airways 730 580 N/A
Idaho 0 0 N/A 200 90
Wyoming 0 0 N/A 90 N/A
Nebraska 0 0 N/A 270 70
California 3 Los Angeles ;San Francisco International;San Diego International
5- Virgin, Alaska, JetBlue, United,
America
11.780 4.080 2.340
Nevada 1 McCarran International (Las Vegas) 0 N/A 600 220
35
Colorado 1 Denver International 1- United Airways 3.090 540 680
Kansas 0 0 N/A 510 440
Arizona 1 Phoenix Sky Harbor International 1- America Airlines 4.600 1.450 610
New Mexico
0 0 N/A 280 330
Texas 2 George Bush Houston; Dallas International Airport
3- America, United and Southwest
13.600 4.020 2000
Alaska 1- Ted Stevens International Airport
1- Alaska Airways 480 590 500
36 Appendix XXVI: Entry modes analysis
Table XX: Analysis of the different entry modes
Internationalization strategies
International Transactions
Transactions that involve the exchange of products, in a home-based international trade activities such as the following:
Global sourcing: strategy of buying products and services from foreign sources. It represents an inbound flow, more known as import. Not the case of Skypro.
Exporting: strategy of producing products or services in one country and selling/distributing them to customers located in other country. It maximizes flexibility and minimizes risk, represents limited expense and knowledge of foreign markets but also grants low control. Most common international strategy and preferred foreign market entry mode, mainly by small and medium-sized enterprises. Additionally, it increase the sales volumes and market share, explores economies of scale, leverages foreign business partners and diversifies the customer base. It can have two forms, direct and indirect exporting, where in the former the firms conducts the activities to take place in the foreign market by itself, and in the latest there is the involvement of a third party.
Countertrade: international transaction where all or partial payments are made in any kind rather than cash. For such reason does represent a valid option for Skypro.
Contractual relationships
Business relationships sealed by a contractual form which defines rights and obligations for both parties.
37 Equity or ownership-based international business activities
The firm establishes a presence in a foreign market by investing capital and securing ownership of a business unit or asset.
FDI: The firm establishes a physical presence abroad through acquisition of productive assets. It is a high control strategy for entry modes. Enables the company to have direct access to customers and partners. Usually occurs when significant value chain activities must be performed in the foreign market. It is perhaps the international strategy which provides a higher degree of control and also a commitment of resources. Flexibility is minimal and risk is maximum. For such reasons does not seems adequate for Skypro.
38 Appendix XXVII: Online Commerce
Table XXI: List of the online stores to sell
Skypro’s products
Specialized General Cew Outfitters zappos.com The Field Shops shoes.com M&H Uniforms online shoes
DSW Macy's
Appendix XXVIII: Specialized stores per state
Table XXII: List of specialized stores per state in the west coast of the US (Crew Outfitters, 2016) (Tarpy Tailors, 2016)
State Nº of specialized stores
Description
Texas 3 Crew outfitters at Dallas/Ft. Worth International Airport; Crew outfitters at Ft.Worth - American Airlines Flight Academy; Crew outfitters at George Bush Intercontinental Airport
Utah 1 Crew outfitters at Salt Lake city international airport California 2 M & H Uniforms at San Mateo; Tarpy Tailors at Los
Angeles
Appendix XXIX: Crew Outfitters in the west coast
Table XXIII: List of Crew Outfitters stores in the west coast of the US (Crew Outfitters, 2016)
State Nº of specialized stores
Description
Texas 3 Crew outfitters at Dallas/Ft. Worth International Airport; Crew outfitters at Ft.Worth - American Airlines Flight Academy; Crew outfitters at George Bush Intercontinental Airport
39 Appendix XXX: Airport analysis
Table XXIV: Analysis of the large airports in the US regarding airlines served, aviation professionals, presence of specialized stores, traffic and renting price.
States Large Airports
US Top 10 Airlines Hubs or Base
Aviation professionals
Specialized
stores Passenger traffic Price per m² Washington 1-Seattle-Tacoma
International 1- Alaska Airways 2015 0 42 340 537 5 747,4
Oregon
1-Portland International
Airport 1- Alaska Airways 1310 0 16 850 952 3 944,1
California
3-Los Angeles International Airport; San
Francisco International Airport; San Diego International Airport
5- Virgin, Alaska, JetBlue, United,
America
18200 2
74 936 256 50 067 094
N/A
5 312,48 11 934,74
Nevada 1-McCarran International
Airport (Las Vegas) 1- United Airways 820 0 45 389 074 1 729,32
Utah 1-Salt Lake City International Airport
1- America
Airlines 290 1 N/A 2 068,7
Colorado 1-Denver International Airport
3- America, United
and Southwest 4310 0 54 014 502 3 892,89
Arizona 1-Phoenix Sky Harbor
40 Texas
2-George Bush Houston International Airport;
Dallas-Fort Worth International Airport
3- America, United
and Southwest 19620 4
43 023 224 64 174 163
1 947,25 2 098,01
Source (Federal Aviation
Administration, 2016) (Airlines, 2016)
(US Bureau of Labor, 2016)
(Airports Council International,
2016)
41 Appendix XXXI: Promotion activities
Table XXV: Promotion activities to take place per activity and respective description.
Promotion Activity Description
Airline online platforms Google ads on footwear and aviation’s products searches and specialized forums such as airlineupdate.com and
airlineforums.com.
Airline magazines Advertisement on airline magazines such as Iflymagazine; Hemispheres and Sky.
IATA premium membership IATA premium membership will grant Skypro a higher awareness among the companies in the industry with participation in special fairs and in recommendations list.
Appendix XXXII: Pricing strategy
Table XXVI: Pricing strategy’s variables: Unit Cost; Unit Sales Prices; Customers willingness to pay and price of competitors
Skypro’s pricing drivers Customers willingness to pay (from interview)
Competitors’ price
Avg unit cost: $27,69 Avg unit sales price: $139,95
Lower product’s price: $134,95
Higher product’s price: $229,95
Avg profit margin: $112,26 80,21 %
Minimum: $60
Maximum: Around $100
Lower competitor’s price: $60
Higher competitor’s price: $330
42 Appendix XXXIII: Balanced scoreboard - Memo
Table XXVII: Summary of the project’s objectives, targets to reach and respective KPI’s
Objectives Target Measurement
Customer Become the US leading footwear brand for aviation professionals Create brand awareness in the West Coast of the US
95 % of consumer satisfaction
Product reviews on Skypro’s online store Market share (over 4 stars) Number of visits in
Skypro’s online store. Financial
Sales/Revenues increase Increase presence among the B2C segment.
10% yearly profit increase B2C segment to reach 20% in overall customer distribution
Value of revenues Sales’ unit volume Percentage of each customer segment Internal Increase presence in
retailer partners
Increase presence in IATA fairs
Extent the product line in the US
15% yearly increase in orders made by retail partners
Accessories and uniforms pieces introduced
Nº of units ordered by partners
Skypro’s products added in retail partners
Learning
Obtain knowledge about US market
Innovation
Introduce new distinctive features in the footwear Adapt product to US’s characteristics
Nº of new features added over the course of the project
Exclusively US product introduced
Appendix XXXIV: WACC calculation
Table XXVIII: Summary of Skypro’s discount rate: formulas, values and variables
𝑹𝒔 = 𝑹𝒆 × (𝑬 + 𝑫) +𝑬 (𝟏 − 𝒕)𝑹𝒅
×𝑫 + 𝑬𝑫
𝑹𝒆 = 𝑹𝒇 + 𝜷𝒍(𝑹𝒎 − 𝑹𝒇
+ 𝑪𝑹𝑷) 𝑹𝒅 = 𝑰𝒓/𝑫
Rs: Cost of capital = 6,58% CRP: Country risk premium of USA = 0
Equity = 3280643,91€ Re: Cost of equity = 7,63% E: equity ratio = 0,8 Debt = 821836,06€ Rf: Risk free rate - 10 year German
bond = 0,64%
D: Debt ratio = 0,2 Interest = 32061,57€ Rm: Return of the market - S&P500
10 year avg return = 7,23%
Rd: cost of debt = 3,9% Ir = Interest Βl: Beta leverage of Apparel sector
USA= 1,06
43 Appendix XXXV: Sources for WACC calculation
Table XXIX: Sources for the variable used for the calculation of the WACC (discount rate)
Riskfree rate – German 10 y bond (Bloomberg, 2016)
Equity (Skypro, 2015) Return of the market S&P 500
(Moneychimp, 2016)
Debt (Skypro, 2015)
βl= Beta leverage of Apparel sector USA (damodaran, 2016)
Interest (Skypro, 2015) CRP: Country risk premium of USA
(Damodaran, 2016)
USA Coportate tax rate (tradingeconomics, 2016)
Appendix XXXVI: Skypro’s west coast potential demand
Assumptions:
- Demand will be determined by the number of registered commercial pilots and flight attendants;
- Footwear is purchased twice per year;
- Flight attendants wear two pairs of shoes per flight, buying four pairs per year - Commercial pilots wear one pair of shoes per flight, buying two pairs per year.
Formula:
𝑇𝑜𝑡𝑎𝑙 𝑃𝑜𝑡𝑒𝑛𝑡𝑖𝑎𝑙 𝑑𝑒𝑚𝑎𝑛𝑑
= 𝑁º 𝑜𝑓 𝑓𝑙𝑖𝑔ℎ𝑡 𝑎𝑡𝑡𝑒𝑛𝑑𝑎𝑛𝑡𝑠 × 𝑁º 𝑜𝑓 𝑝𝑎𝑖𝑟 𝑜𝑓 𝑠ℎ𝑜𝑒𝑠 𝑤𝑒𝑎𝑟
× 𝐹𝑟𝑒𝑞𝑢𝑒𝑛𝑐𝑦 𝑜𝑓 𝑝𝑢𝑟𝑐ℎ𝑎𝑠𝑒 + 𝑁º 𝑜𝑓 𝑐𝑜𝑚𝑚𝑒𝑟𝑐𝑖𝑎𝑙 𝑝𝑖𝑙𝑜𝑡𝑠
× 𝑁º 𝑜𝑓 𝑝𝑎𝑖𝑟 𝑜𝑓 𝑠ℎ𝑜𝑒𝑠 𝑤𝑒𝑎𝑟 × 𝐹𝑟𝑒𝑞𝑢𝑒𝑛𝑐𝑦 𝑜𝑓 𝑝𝑢𝑟𝑐ℎ𝑎𝑠𝑒+
44
Table XXX: Flight attendants and commercial pilots per state (US Bureauof Labor, 2016)
Appendix XXXVII: Sales estimation – Optimistic Scenario
Assumptions:
- Potential demand will vary across the different sale channels;
- Potential demand will assume an average growth rate for the 5 years of the project equal to the average growth rate of the US airline industry, 2,2%;
States Nº of flight
attendants
Nº of commercial pilots
Washington 275 1030
Montana N/A 350
North Dakota N/A 260
South Dakota N/A 280
Oregon 730 580
Idaho N/A 200
Wyoming N/A 90
Nebraska N/A 270
California 11780 4080
Nevada N/A 600
Utah N/A 290
Colorado 3090 540
Kansas N/A 510
Arizona 4600 1450
New Mexico N/A 280
Texas 13600 4020
Alaska 480 590
Hawaii N/A 270
45 - Potential demand for the two coomerce channels, Skypro’s online store and
E-commerce retailers will equal total potential demand with an annual average growth rate of 2,2%;
- Potential demand for retail distributors will equal the total nº of flight attendants and commercial pilots in the respective states, Texas, California and Utah, multiplied by the frequency of purchasing and pair of shoes used stated above;
- Potential demand for Skypro’s airport store will equal the total nº of flight attendants and commercial pilots in California, multiplied by the frequency of purchasing and pair of shoes used stated above;
- An annual average sales growth rate for the five years was assumed, which varies across the different sales channel;
- To simplify the model there will not be a distinction between men and women shoes sold. For the sales estimation it will be the average sales price and average unit cost from the sales made so far in the US (Skypro, 2016).
Table XXXI: Sales Estimation for the optimistic scenario in Skypro’s online store, E-commerce, retailer distributors and Skypro’s airport store
Sales Estimation: Skypro online store
Year 1 Year 2 Year 3 Year 4 Year 5
Total Potential Demand 169600 173331,2 177144,5 181041,7 185024,6 Avg Sales growth rate 19%
Market share % 0,5% 0,61% 0,73% 0,87% 1,03%
Sales units 848 1055,78 1286,18 1566,85 1908,78
Avg sales price $139,95 $139,95 $139,95 $139,95 $139,95
46 Sales estimation:
Ecommerce
Year 1 Year 2 Year 3 Year 4 Year 5
Total Potential Demand 169600 173331,2 177144,5 181041,7 185024,6 Avg Sales growth rate 28%
Market share % 0,50% 0,64% 0,82% 1,05% 1,34%
Sales unit E-commerce 848 1109,75 1452,30 1900,58 2487,24
Avg sales price $139,95 $139,95 $139,95 $139,95 $139,95
Margin retailers (%PVP) 20% 20% 20% 20% 20%
Total Revenue $94.942,08 $124.247,95 $162.599,68 $212.789,49 $278.471,44 Sales estimation: Retail
Nº of potential stores 6
States of the stores Texas, California and Utah
Year 1 Year 2 Year 3 Year 4 Year 5
Nº of airline
Professionals year 1 33 770
Total Potential Demand 118 300 120 902,6 123 562,5 126 280,8 129 059 Avg Sales growth rate 14,4%
Market share % 2,50% 2,86% 3,27% 3,74% 4,28%
Sales unit Retail 2.957,50 3.457,81 4.042,77 4.726,67 5.526,27
Margin retailers (%PVP) 64% 64% 64% 64% 64%
Total Revenue $149.004,77 $174.211,60 $203.682,63 $238.139,21 $278.424,75 Sales estimation:
Skypro store
State California
Year 1 Year 2 Year 3 Year 4 Year 5
Nº of airline professionals
year 1 15860
Total Potential Demand 55280 56496,2 57739,1 59009,3
6030 7,5 Avg Sales growth rate 7,2%
Market share 5% 5,4% 5,7%
Sales unit Skypro store 2887 3162,9 3465,2
Avg unit price $139,95 $139,95 $139,95
Total Revenue $404.029,18 $442.647,91 $484.957,9
Total units sold 4.653,50 5.623,35 9.668,20 11.357,01
47 Appendix XXXVIII: Sales estimation – Conservative Scenario
Assumptions for the conservative scenario are the same as in the optimistic scenario, changing only the market share and average sales growth rate predictions.
Table XXXII: Sales Estimation for the optimistic scenario in Skypro’s online store, E-commerce, retailer distributors and Skypro’s airport store
Sales Estimation: Skypro online store
Year 1 Year 2 Year 3 Year 4 Year 5
Total Potential Demand 169600 173331,2 177144,5 181041,7 185024,6 Avg Sales growth rate 12,5%
Market share % 0,25% 0,29% 0,34% 0,41% 0,49%
Sales units 424 433,3 442,9 452,6 462,6
Avg sales price $139,95 $139,95 $139,95 $139,95 $139,95
Total Revenue $59 338,8 $60 644,25 $61 978,43 $63 341,95 $64 735,48 Sales estimation:
Ecommerce
Year 1 Year 2 Year 3 Year 4 Year 5
Total Potential Demand 169600 173331,2 177144,5 181041,7 185024,6 Avg Sales growth rate 18%
Market share % 0,35% 0,41% 0,48% 0,57% 0,67%
Sales unit E-commerce 593,6 712 856 1027,9 1234,4
Avg sales price $139,95 $139,95 $139,95 $139,95 $139,95
Margin retailers (%PVP) 20% 20% 20% 20% 20%
Total Revenue $66 459,5 $79 807,8 $95 837,2 $115 086,2 $138 201,2 Sales estimation: Retail
Nº of potential stores 6
States of the stores Texas, California and Utah
Year 1 Year 2 Year 3 Year 4 Year 5
Nº of airline
Professionals year 1 33 770
Total Potential Demand 118 300 120 902,6 123 562,5 126 280,8 129 059 Avg Sales growth rate 10%
Market share % 1,50% 1,7% 1,9% 2,2% 2,5%
48 Margin retailers
(%PVP) 64% 64% 64% 64% 64%
Total Revenue $89 402,9 $110 734,4 $129 467,1 $151 368,8 $176 975,5 Sales estimation:
Skypro store
State California
Year 1 Year 2 Year 3 Year 4 Year 5
Nº of airline professionals
year 1 15860
Total Potential Demand 55280 56496,2 57739,1 59009,3 60307,5 Avg Sales growth rate 5,2%
Market share 2,5% 2,6% 2,8%
Sales unit Skypro store 1485,8 1597,5 1717,5
Avg unit price $139,95 $139,95 $139,95
Total Revenue $207 944,6 $223 570,4 $240 370,3
Total units sold 2 792,1 3 344,1 5 354,4 6 082,45 6 927,2
Appendix XXXIX: Costs of the project
Table XXXIII: Project’s cost per category, infrastructure, human resources and advertising
Infrastructure Costs
Transportation unit cost to US
$2,769 (10% avg cost) per order plus $0,3 per unit
Frequency of transport: 3 times per year Shipping cost E-commerce $12,5 per unit (order)
Shipping cost Airport store
$300 per order of 55 pairs for optimistic scenario and $216 per order of 30 pairs for conservative scenario
Frequency of transport : 55 times per year
Avg cost per unit $27,69
Management Company $3000 monthly + 5% sales in the year 0 $4000 monthly +2,5% sales from year 1
CMVMC $27,69 per unit sold
Airport store rental $60000 yearly ($5000 monthly) HR costs
Commercial Professional $125 000 annually Advertising costs
Online Ads $3000 year 1 with 5% avg growth IATA premium partner $25 000 yearly
Airline magazines
49 Appendix XL: Profit and Loss statement for Optimistic scenario
Table XXXIV: P&L statement and NPV calculation for the optimistic scenario
Year 0 Year 1 Year 2 Year 3 Year 4 Year 5
Sales Revenue
E-commerce $118 677,6 $147 756,6 $180 000,6 $219 281,2 $267 133,4
E-commerce retailer $94 942,1 $124 247,9 $162 599,7 $212 789,5 $278 471,4 Retail distributor $149 004,8 $174 211,6 $203 682,6 $238 139,2 $278 424,8
Skypro store - - $404 029,2 $442 647,9 $484 958
Operating income $362 624,5 $446 216,1 $950 312,1 $1 112857,7 $1308987,6 General & Administrative $3 000 $22 131,2 $26 310,8 $51 515,6 $59 642,9 $69 449,4
Shipment Cost (PT to US) $9 703,1 $9 994 $11 207,5 $11 714,1 $12 323,3
CMVMC $128 855,4 $155 710,5 $267 712,4 $314 475,6 $370 700,3
Transportation (in the US) $15 747 $17 252,2 $18 901,2
HR $125 000 $125 000 $125 000 $125 000 $125 000
Marketing & Sales Cost $31 000 $31 150 $31 307,1 $31 472,9 $31 646,5
Airport store $60 000 $60 000 $60 000
Operating costs $3 000 $316 689,7 $348 165,3 $562 490 $619 557,7 $688 020,7 Net profit before taxes -$3 000 $45 934,8 $98 050,8 $387 822,1 $493 300 $620 966,9
Taxes $0,0 $17 868,6 $38 141,8 $150 862,8 $191 893,7 $241 556,1
Net profit after taxes $0,0 $28 066,1 $59 909 $236 959,3 $301 406,3 $379 410,8
Discount rate 6,58%
50 Appendix XLI: Profit and Loss statement for Conservative scenario
Table XXXV: P&L statement and NPV calculation for the conservative scenario
Year 0 Year 1 Year 2 Year 3 Year 4 Year 5
Sales Revenue
E-commerce $59 338,8 $60 644,3 $61 978,4 $63 342,0 $64 735,5
E-commerce retailer $66 459,5 $79 807,8 $95 837,2 $115 086,2 $138 201,2 Retail distributor $89 402,9 $110 734,4 $129 467,1 $151 368,8 $176 975,5
Skypro store - - $207 944,6 $223 570,4 $240 370,3
Operating income $215 201,1 $251 186,5 $495 227,3 $553 367,2 $620 282,5 General &
Administrative
$3 000,0 $14 760,1 $16 559,3 $28 761,4 $31 668,4 $35 014,1 Shipment Cost (PT to
US)
$9 144,6 $9 310,2 $9 913,3 $10 131,7 $10 385,1
CMVMC $77 313,2 $92 596,7 $148 263,7 $168 423,0 $191 813,1
Transportation (in the US)
$3 209,4 $3 450,6 $3 709,9
HR $125 000,0 $125 000,0 $125 000,0 $125 000,0 $125 000,0
Marketing & Sales Cost $0,0 $0,0 $0,0 $0,0 $0,0
Airport store $60 000,0 $60 000,0 $60 000,0
Operating costs $3 000,0 $226 217,9 $243 466,2 $375 147,9 $398 673,7 $425 922,2 Net profit before taxes -$3 000,0 -$11 016,8 $7 720,2 $120 079,5 $154 693,5 $194 360,3
Taxes $0,0 $0,0 $3 003,2 $46 710,9 $60 175,8 $75 606,2
Net profit after taxes $0,0 $0,0 $4 717,1 $73 368,5 $94 517,7 $118 754,2
Discount rate 6,58%
51 References
Websites:
Airports Council International: Passanger traffic. Airports Council International. http://www.aci.aero/ (accesed on the 15th of November)
Airlines for America. Airlines.
http://airlines.org/data/ (accesed on the 15th of November)
Bloomberg: German Rates & Bonds. Bloomberg.
https://www.bloomberg.com/markets/rates-bonds/government-bonds/germany (accesed on
the 28th of November)
Crew Outfitters: Store locator. Crew Outfitters.
http://www.crewoutfitters.com/ustorelocator/location/map/ (accesed on the 8th of
November)
Country Default Spreads and Risk Premiums. Damodaran.
http://pages.stern.nyu.edu/~adamodar/New_Home_Page/datafile/ctryprem.html (accesed on
the 15th of November)
Betas by sector. Damodaran.
http://pages.stern.nyu.edu/~adamodar/New_Home_Page/datafile/Betas.html (accessed on
the 28th of November)
Country Default Spreads and Risk Premiums. Damodaran.
http://pages.stern.nyu.edu/~adamodar/New_Home_Page/datafile/ctryprem.html (accessed
52
Euler Hermes: Country Risk Ranking 2015. EulerHermes.
http://www.eulerhermes.com/economic-research/country-risks/Pages/country-reports-risk-map.aspx (accessed on the 8th of November)
Euromonitor: Airline Industry. Euromonitor.
http://fesrvsd.fe.unl.pt:2117/portal/statistics/tab (accessed on the 8th of November)
Euromonitor: Airlines in the US 2016. Euromonitor.
http://fesrvsd.fe.unl.pt:2117/portal/statistics/rankcountries (accessed on the 8th of
November)
Euromonitor: Footwear Industry 2015. Euromonitor.
http://fesrvsd.fe.unl.pt:2117/portal/statistics/rankcountries (accessed on the 8th of
November)
Euromonitor: Middle Class Households (% of Total) 2015. Euromonitor.
http://fesrvsd.fe.unl.pt:2117/portal/statistics/rankcountries (accessed on the 8th of
November)
FAA- Airport categories. Federal Aviation Administration.
https://www.faa.gov/airports/planning_capacity/passenger_allcargo_stats/categories/
(accessed on the 8th of November)
FAA: Airport Categories. Federal Aviation Administration.
https://www.faa.gov/airports/planning_capacity/passenger_allcargo_stats/categories/
(accessed on the 8th of November)
Heritage: Index of Economic Freedom 2015. Heritage.
53
IATA: Current Airline Members. IATA.
http://www.iata.org/about/members/Pages/airline-list.aspx (accessed on the 8th of
November)
Transparency. International, T.
http://www.transparency.org/ (accessed on the 5th of November)
Skypro: shoes. Skypro.
http://www.wearskypro.com/pt/18-mens-cabin-crew-shoes (accessed on 11th of October)
Tarpy Tailors: Store location. Tarpy Tailors.
http://www.tarpytailors.com/location.php (accessed on the 29th of Novermber)
Tradingeconomics: US corporate tax rate. Tradingeconomics.
http://www.tradingeconomics.com/united-states/corporate-tax-rate (accessed on the 26th of
November)
US Bureau of Labor Statistics: Air controllers. US Bureau of Labor Statistics. http://www.bls.gov/oes/current/oes532011.htm (accessed on the 8th of November)
US Bureau of Labor Statistics: Commercial pilots. US Bureau of Labor Statistics. http://www.bls.gov/oes/current/oes532031.htm (accessed on the 8th of November)
US Bureau of Labor Statistics; Flight attendatants. US Bureau of Labor Statistics. http://www.bls.gov/oes/current/oes532031.htm (accessed on the 8th of November)
US Bureau of Labor: 2015 National Occupational Employment. US Bureauof Labor. http://www.bls.gov/oes/current/oes_nat.htm#00-0000 (accessed on the 8th of November)
WorldBank: CO2 emissions (metric tons per capita) 2016. WorldBank
http://data.worldbank.org/indicator/NY.GDP.PCAP.CD (accessed on the 8th of November)
54 http://data.worldbank.org/indicator/SP.URB.TOTL.IN.ZS (accessed on the 8th of
November)
World Bank- Household final consumption expenditure (current US$) 2015. WorldBank. http://data.worldbank.org/indicator/NE.CON.PRVT.CD (accessed on the 8th of November)
WorldBank- GDP current US$. WorldBank.
http://data.worldbank.org/indicator/NY.GDP.MKTP.CD?end=2015&start=2015&view=ma
p (accessed on the 8th of November)
WorldBank- Household final consumption expenditure (current US$) 2015. Worldbank. http://data.worldbank.org/indicator/NE.CON.PRVT.CD (accessed on the 8th of November)
WorldBank- Total population. WorldBank.
http://data.worldbank.org/indicator/SP.POP.TOTL?view=map (accessed on the 8th of
November)
WorldBank: Imports as % of GDP 2015. WorldBank.
http://data.worldbank.org/indicator/NE.IMP.GNFS.ZS (accessed on the 8th of November)
WorldBankGroup: Economy Rankings 2015. WorldBankGroup.
http://www.doingbusiness.org/rankings (accessed on the 8th of November)
World by Map: Total airports by country. WorldbyMap. Obtido de http://world.bymap.org/Airports.html (accessed on the 8th of November)
WorldBank- GDP per capita 2015. WorlkBank.
http://data.worldbank.org/indicator/NY.GDP.PCAP.CD (accessed on the 8th of November)
WorldBank- GDP per capita growth (annual %) 2015. WorlkBank.
http://data.worldbank.org/indicator/NY.GDP.PCAP.KD.ZG (accessed on the 8th of