ISSN 0104-6632 Printed in Brazil
www.abeq.org.br/bjche
Vol. 23, No. 04, pp. 461 - 471, October - December, 2006
Brazilian Journal
of Chemical
Engineering
INCORPORATION OF THE CONCEPT OF
MICROBIAL PRODUCT FORMATION INTO ASM3
AND THE MODELING OF A MEMBRANE
BIOREACTOR FOR WASTEWATER TREATMENT
K. P. Oliveira-Esquerre
*, H. Narita, N. Yamato, N. Funamizu and Y. Watanabe
Department of Urban and Environmental Engineering, Hokkaido University, N13W8, Sapporo, 060-8628, Japan.
E-mail: [email protected]
(Received: January 15, 2006, Accepted: September 20, 2006)
Abstract - This paper proposes a modification of ASM3 in a way that takes into account the process of production and consumption of microbial products (MPs) in a submerged membrane bioreactor fed with the effluent of a particular precoagulation sedimentation unit. A comparative representation of the modeling results obtained with ASM3 and ASM1 is performed and it highlights the importance of considering the process of storage of organic substrate, including MPs, as a prior step to bacterial growth. In addition to the suspended solids and microorganisms, various soluble organic substances, which might be either undecomposed organic substances contained in the raw water or MPs, are assumed to be selectively retained within the bioreactor. The results show that the carbonaceous materials are more accurately estimated by ASM3, while ASM1 performs slightly better than ASM3 in the estimation of nitrate. The estimated MP concentration in the mixed liquor and permeate agrees with the experimental evidence, and as expected, MPs play a role in supplying organic substrate to heterotrophs in both ASM1 and ASM3.
Keywords: Membrane bioreactor; Modeling; Microbial products; Wastewater treatment.
INTRODUCTION
The current social and economic concern with environmental protection have resulted in the implementation of means for conserving natural resources to an extent never anticipated in the past. In this context, membrane bioreactors (MBRs) are becoming essential to achieving water sustainability, because they provide high-quality treatment of water, encourage the reuse of water and create opportunities for decentralized treatment, with small footprints.
Although it is very important to ensure the quality of treated wastewater prior to its discharge, the correct control and operation of MBRs are not well established. MBR is a common example of a process difficult to understand and model. Its inflow is
variable; the population of microorganisms varies over time, both in quantity and in number of species; process knowledge is scarce and the few on-line analyzers tend to be unreliable. Furthermore, due to the high concentration of activated sludge, long sludge retention time and low food to microorganism ratio (F/M) intrinsic to MBR processes, the behavior of the microbial products (MPs) and especially their influence on microbial activity and the fouling process must undeniably be evaluated.
pilots or full-scale MBR plants have been published. In this research, a mathematical model that characterizes the biological processes of a submerged hollow fiber MBR by incorporating the concept of MP formation into the ASM3 is proposed. The structure of this paper is as follows. First, a brief description of a submerged hollow fiber MBR is given. Concepts of MP formation and consumption, wastewater characterization, volumetric mass transfer coefficient (kLa) estimation related to the modified
ASM3 and membrane filtration are then described and the results of modeling are reported. Finally, the conclusions are drawn.
CASE STUDY
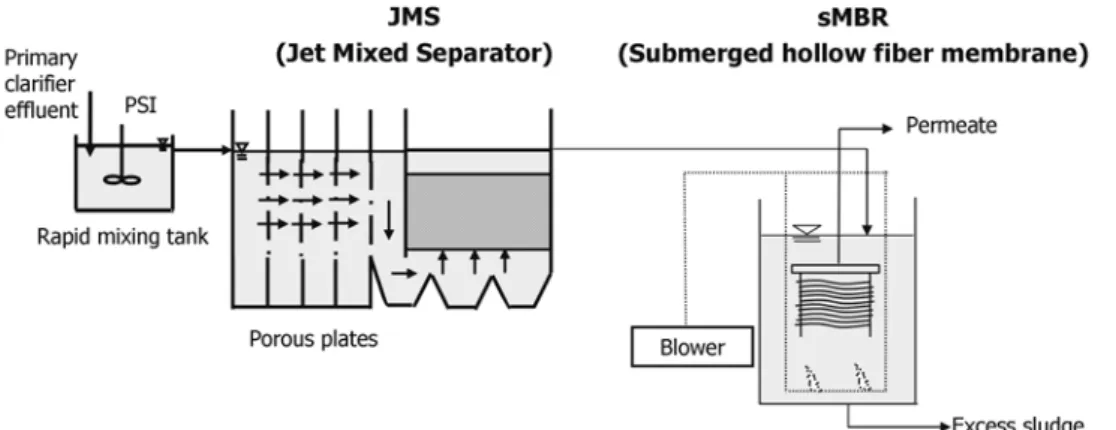
A pilot-scale plant for wastewater treatment was operated at the Soseigawa Treatment Plant, Sapporo, Japan. Wastewater collected from combined sewer pipes was fed into a particular pre-coagulation and sedimentation unit called the jet-mixed separator (JMS) (Watanabe and Itonaga, 2004; Watanabe et al., 1998). The case study analyzed here is a submerged hollow fiber membrane module (sMBR, Figure 1) fed with effluent from the JMS.
The module was equipped with a microfiltration (MF) membrane made of polyethylene with a total area of 3 m2 and a pore size of 0.2 µm. The working
volume of the membrane chamber is 180 liters. It was operated at a flux of 0.4 m day-1 and a hydraulic retention time of 4.4 hours. An intermittent operation (12-minute suction and 3-minute stop between operations) was adopted.
MODEL DEVELOPMENT
As mentioned above, a model designed for chemical oxygen demand (COD) and nitrogen removal based on ASM3 was developed (Gujer et al., 1999; Henze et al., 2000). ASM3 was proposed by the International Water Association (IWA) not only as a way to correct some defects of ASM1, but also to take into account the advances in experimental research on the storage of organic compounds. Nevertheless, even though the methodology and features offered by the activated sludge models contribute to a better understanding of the process dynamics and operational optimization of wastewater treatment systems (Furumai et al., 1999), it is not easy to define optimal operating conditions for nutrient removal based solely on influent characteristics. Here MPs were included in ASM3 as a new state variable and the degradation rates were incorporated into the mass balance equation for each component, assuming the MBR to be a CSTR. All coding was carried out in MATLAB.
Figure 1: Schematic representation of the sMBR.
Microbial Products
Previous models of wastewater treatment systems were based on the Monod model, which assumes that the soluble biodegradable organic matter in the effluent has the same characteristics as that in the influent and is present in the effluent as a result of a
process limitation on the organic removal rate. Consequently, the incorporation of MP formation paved the way for a more accurate modeling of wastewater treatment.
organic matter in the effluent (Barker and Stuckey, 1999; Boero et al., 1991; Lu et al., 2001; Namkung and Rittman, 1986; Noguera et al., 1994) and their presence is, therefore, of particular interest in terms of achieving discharge consent levels for BOD and COD. In addition, they play a role in suppling organic substrate to heterotrophs and exert a critical influence on the flux rate achieved in the membrane filtration of activated sludge suspensions (Amy et al., 1987).
Lu et al. (2001) divided MPs into two new species, utilization-associated products (UAPs) and biomass-associated products (BAPs), and for the sake of model simplicity and rapid calculation, included both in a modified ASM1 as SMPs (soluble
microbial products). Twelve mass balance equations for a single completely mixed membrane bioreactor system under intermittent aerobic conditions were then established.
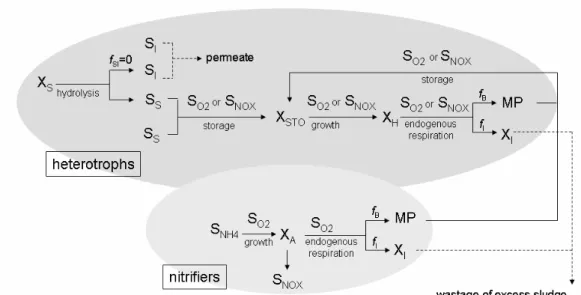
In this research, only biomass decay products were considered in the modified ASM3 because they account for most MPs rather than substrate metabolism products (Barker and Stuckey, 1999; Wintgens et al., 2003; Huang et al., 2000). Figure 2 shows the metabolic pathways according to the modified ASM3. As can be observed, MPs are used as an additional source of organic substrate for heterotrophs and, unlike ASM1, their storage is implemented as a precondition for microbial growth.
Figure 2: Metabolic pathways in the modified ASM3.
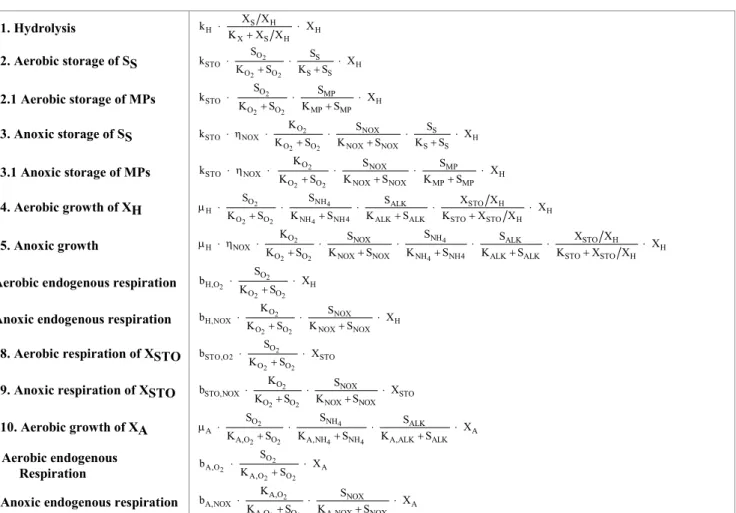
The stoichiometric (νj,i) and composition (ιk, j) matrixes are shown in Table 1; the values of most parameters were taken from ASM3 (Henze et al., 2000) or obtained using the composition equation, Equation (1). Table 2 shows the kinetic rate expressions where two additional processes, both related to the storage of MPs were established. The definition and description of the parameters of the MPs are shown in Table 3. The system reaction term, ri, is obtained with Equation (2).
∑
⋅
=
i
j , k i ,
j
ι
0
ν
for i = 1 to 12. (1)∑
==
121 j
j j , i i
r
ν
ρ
(2)where
ν
andι
are the stoichiometric andcomposition matrixes, respectively; r is the reaction term; ρ is the kinetic rate and j, i and k represent the biological processes, the components (or state variables) and the conservative terms, respectively.
The coefficients fB (=0.8) and fI (=0.2) were
estimated by trial and error and represent the fraction of biomass that respectively became MP and XI,
Table 1: Stoichiometric and composition matrixes of the modified ASM3.
Compound →
↓ Process SO2 SI SS MP SNH4 SN2 SNOX SALK XI XS XH XSTO XA XSS
1. Hydrolysis f SI x1 y1 z1 -1 -iXS
Heterotrophic organisms, denitrification
2. Aer. stor. of SS x2 -1 y2 z2 YSTO,O2 t2
2.1 Aer. stor. of MPs x2 -1 y2 z2 YSTO,O2 t2
3. Anox. stor. of SS -1 y3 -x3 x3 z3 YSTO,NOX t3
3.1 Anox. stor. of MPs -1 y3 -x3 x3 z3 YSTO,NOX t3
4. Aer. growth of XH x4 γMP,H y4 z4 1 -1/YH,O2 t4
5. Anoxic growth γMP,H y5 -x5 x5 z5 1 -1/YH,,OX t5
6. Aer. end. resp. x6 fB y6 z6 f I -1 t6
7. Anox. end. resp. fB y7 -x7 x7 z7 f I -1 t7
8. Aer. resp. of XSTO x8 -1 t8
9. Anox. resp. of XSTO -x9 x9 z9 -1 t9
Autotrophic organisms, nitrification
10. Aer. growth of XA x10 γMP,A y10 1/YA z10 1 t10
11. Aer. end. resp. x11 fB y11 z11 f I -1 t11
12. Anox. end. resp. fB y12 -x12 x12 z12 f I -1 t12
Conservatives
COD gCOD -1 1 1 -1.71 -4.75 1 1 1 1 1
Nitrogen gN iN,SI iN,SS iN,MP * 1 1 1 iN,XI iN,XS iN,BM iN,BM
Ionic charge Mole + 1/14 -1/14 -1
Observable
TSS gSS iSS,XI iSS,XS iSS,BM 0.6 iSS,BM
All empty spaced indicate values of 0.
*MP was considered to be mostly composed of organic matter, i.e., iN,MP = 0.
Table 2: Kinetic rate expressions for the modified ASM3.
1. Hydrolysis H S H H
X S H
X X
k X
K X X
⋅ ⋅
+
2. Aerobic storage of SS 2
2 2
O S
STO H
O O S S
S S
k X
K S K S
⋅ + ⋅ + ⋅
2.1 Aerobic storage of MPs 2
2 2
O MP
STO H
O O MP MP
S S
k X
K S K S
⋅ ⋅ ⋅
+ +
3. Anoxic storage of SS 2
2 2
O NOX S
STO NOX H
O O NOX NOX S S
K S S
k X
K S K S K S
⋅ η ⋅ + ⋅ + ⋅ + ⋅
3.1 Anoxic storage of MPs 2
2 2
O NOX MP
STO NOX H
O O NOX NOX MP MP
K S S
k X
K S K S K S
⋅ η ⋅ ⋅ ⋅ ⋅
+ + +
4. Aerobic growth of XH 2 4
2 2 4
O NH ALK STO H
H H
O O NH NH4 ALK ALK STO STO H
S S S X X
X
K S K S K S K X X
µ ⋅ ⋅ ⋅ ⋅ ⋅
+ + + +
5. Anoxic growth 2 4
2 2 4
O NOX NH ALK STO H
H NOX H
O O NOX NOX NH NH4 ALK ALK STO STO H
K S S S X X
X
K S K S K S K S K X X
µ ⋅ η ⋅ ⋅ ⋅ ⋅ ⋅ ⋅
+ + + + +
Aerobic endogenous respiration 2 2
2 2 O H,O H O O S b X K S ⋅ ⋅ +
Anoxic endogenous respiration 2
2 2
O NOX
H,NOX H
O O NOX NOX
K S
b X
K S K S
⋅ ⋅ ⋅
+ +
8. Aerobic respiration of XSTO 2
2 2 O STO,O2 STO O O S b X K S ⋅ ⋅ +
9. Anoxic respiration of XSTO 2
2 2
O NOX
STO,NOX STO
O O NOX NOX
K S
b X
K S K S
⋅ ⋅ ⋅
+ +
10. Aerobic growth of XA 2 4
2 2 4 4
O NH ALK
A A
A,O O A,NH NH A,ALK ALK
S S S
X
K S K S K S
µ ⋅ ⋅ ⋅ ⋅
+ + +
1. Aerobic endogenous Respiration 2 2 2 2 O A,O A A,O O S b X K S ⋅ + ⋅
2. Anoxic endogenous respiration 2
2 2
A,O NOX
A,NOX A
A,O O A,NOX NOX
K S
b X
K S K S
⋅ ⋅ ⋅
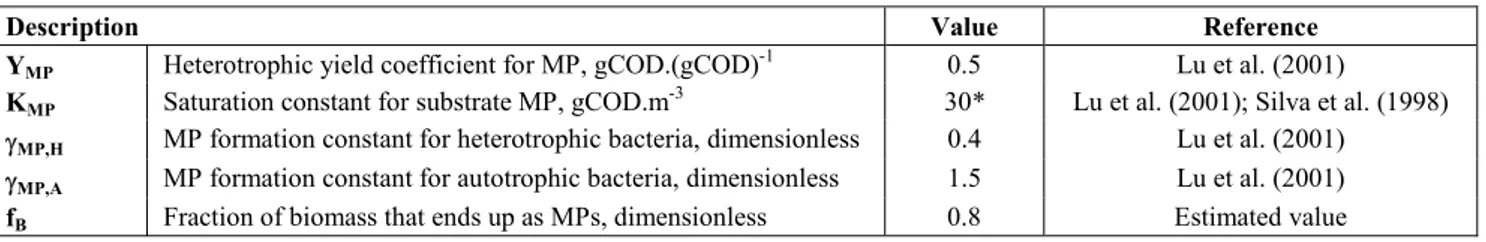
Table 3: List of parameters related to MPs in the model.
Description Value Reference
YMP Heterotrophic yield coefficient for MP, gCOD.(gCOD)
-1
0.5 Lu et al. (2001)
KMP Saturation constant for substrate MP, gCOD.m
-3
30* Lu et al. (2001); Silva et al. (1998)
γMP,H MP formation constant for heterotrophic bacteria, dimensionless 0.4 Lu et al. (2001)
γMP,A MP formation constant for autotrophic bacteria, dimensionless 1.5 Lu et al. (2001)
fB Fraction of biomass that ends up as MPs, dimensionless 0.8 Estimated value
*Assumed the same value as the half saturation coefficient for growth on MPs.
Wastewater Characterization
The simulations were initially run using the wastewater characteristics defined in Henze et al. (2000) (Figure 3(a)). Nevertheless, as the sMBR is fed with the effluent of a precoagulation and sedimentation unit (JMS), its characteristics do not correspond to those of the actual wastewater. The actual characteristics of the wastewater from the JMS were then obtained as explained below.
Readily and slowly biodegradable substrates (SS
and XS, respectively) and heterotrophic biomass (XH)
were estimated by comparing the respirometric curves obtained experimentally and those obtained by simulation (Vanrolleghen et al., 1999; Norr et al., 2002). The standard batch test for determination of the respirometric curves for SS and XS required the
addition of a wastewater sample to endogenous sludge and monitoring the respiration rate until it returned to the endogenous level. Here the sludge was centrifuged and then aerated for 12 hours in order to consume all substrate attached to or stored in the sludge. The same batch test as that used to estimate the maximum specific growth rate, µH, was
performed to assess XH. An oxygen uptake rate
(OUR) solution composed of CH3COONa, NH4Cl
and KH2PO4 was then used to guarantee that the
growth of XH was not limited. Because XSTO at time
zero can not be estimated or measured, the OUR method could not be used with ASM3 to estimate XH.
Therefore, ASM1 was used to simulate XH. The
simulation results are in good agreement with the experimental OUR profiles, as shown in Figure 4.
The inert soluble substrate (SI) was estimated by
measuring the residual COD of the permeate sample after 12 hours of aeration. Nevertheless, because of the MPs, the actual soluble inert organic matter had a little lower value than the residual COD. The particulate inert organic matter was estimated by XI
= T-COD – (SS + SI + XS + XI + XH). XA, and XSTO
was assumed to be zero. Through mass balance, the inorganic fraction was estimated to be equal to 13 g m-3. The carbonaceous composition of the influent wastewater is shown in Figure 3(b). As can been seen, the slowly biodegradable substrate represents the majority of the organic fractions in the JMS effluent, which agrees with the results obtained by Henze et al. (2000). The higher relative concentration of heterotrophic bacteria may suggest their growth during the JMS process, while the lower relative concentrations of the other fractions may be owing to a possible retention or degradation inside the JMS.
SI SS XI XS XH T-COD
0 40 80 120 160 200 240 280 R e la ti ve co n c e n tra ti o n (% ) C o n c e n tra ti o n ( g C O D m -3 ) Organic fractions 0 20 40 60 80 100
SI SS XI XS XH T-COD 0 20 40 60 80 100 120 R e la ti ve co n ce n tra ti o n (% ) C o n ce n tra ti o n (g C O D m -3 ) Organic fractions 0 20 40 60 80 100 (a) (b)
(a) (b)
Figure 4: OUR profiles to determine (a) Ss and XS (7 and 66.9 gCOD m-3, respectively) and (b) XH (23 gCOD
m-3).
Estimation of the Volumetric Oxygen Mass Transfer Coefficient (kLa)
The change (increase) in the oxygen concentration in the reactor owing to the addition of air through the aeration system was included in the differential equation for mass balance.
(
O2_sat O2)
La S S
k − (3)
where kLa is the volumetric mass transfer coefficient
and was calculated as described below and SO_sat is the
saturation concentration for oxygen in the wastewater and was assumed to be 10 gO2 m-3 at 15oC and 1 atm.
For estimation of kLa, the mixed liquor of the
sMBR was aerated for 2 hours without influent flow in order to consume the remaining SS in the reactor.
Then aeration was stopped until the oxygen had been completely consumed without influent flow. Aeration was then restarted without influent flow and the dissolved oxygen was recorded until its saturation was achieved. The kLa (=12 h-1) was
finally obtained by curve fitting using Equation (4). Figure 5 shows the simulated and measured data.
(
)
O2 O2 _ sat L
kLa t kLa t O2 _ ini
Rr
S (t) S
k a
. 1 e− ⋅ S e− ⋅
= − ⋅
− + ⋅
(4)
where t is time and Rr is the consumption of oxygen during the decay of the biomass.
Membrane Filtration
Phenomena involved during filtration of wastewater are very complex because of the nature of the have a fluid concerned. Soluble organic substances have been shown to have a negative effect on the membrane permeability of mixed liquor (Huang et al., 2000), and depending on their chemical and physical composition, they tend to affect in different ways the layers formed on the membrane surface (Norr et al., 2002). Even in the case where the amount is negligible compared to the total suspended solids (Lee et al., 2001), their attachment to suspended solids affects the cake specific resistance.
Microbial products have been shown to have higher molecular weights and be less biodegradable than the original soluble organic substrates (Carlson and Amy, 2000). In the simulations, it was assumed that only readily biodegradable organic substrates, inert soluble organic material and a fraction of microbial products pass through the membrane.
RESULTS
Table 4: Operating conditions of the sMBR.
Mode Simulation
Permeate flux 0.4 m day-1 0.4 m day-1
Operation cycle 15 min-3 min 15 min-3 min
HRT 4.38 hours 4.38 hours
Blower rate Below membranes: 2000 l h
-1
sMBR: 30 l min-1 kLa
(
SO2_sat−SO2(t))
Control of MLSS Average extraction of excess sludge: 3.5 l day-1
(MLVSS ≅ 11000g m-3) Constant extraction of sludge: 3.5 l day -1
Filtration Membrane pore size: 0.2 µm Only Si and MPs pass through the membrane
Table 5: Current data and simulation results.
Current data Simulation results
Parameter Unit Mixed liquor Permeate ASM3a ASM1b
DO gO2 m-3 8 - 7.78 7.75
COD gCOD m-3 - 6.3 7.14 88.1
MLSS gCOD m-3 12050 - 8330 3431
MLVSS gCOD m-3 7962 - 6330 1842
NO3- gN m-3 - 16.64 23.2 16.8
NH4+ gN m-3 - 1.68 0.19 0.26
TN gN m-3 - 20.1 23.5 17.3
aASM3 proposed here. b ASM1 proposed by Lu et al. (2001).
As mentioned above, the organic matter in the permeate was accounted for a combination of SS, SI
and MPs because it was assumed that there is no significant retention of MPs in the reactor by the MF
membrane. In both AMS3 and ASM1, SI was
constant during the process (fSI = 0) and SS was
almost completely decomposed. Nevertheless, while ASM3 gave a considerably low MP concentration
(0.75 gCOD m-3), a value of 80 gCOD m-3 was
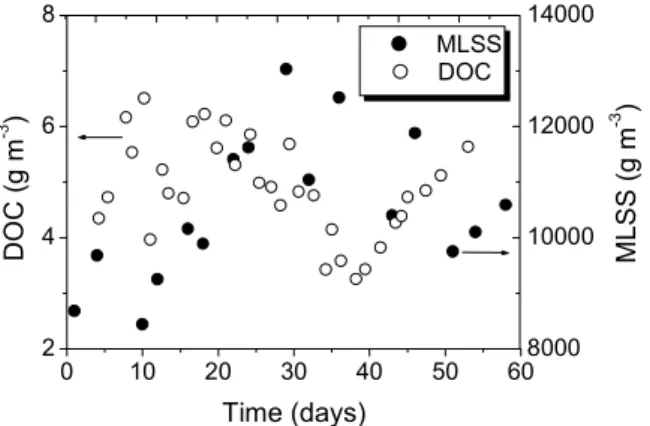
obtained with ASM1. ASM1 assumed hydrolysis of the slowly biodegradable substrates, including MPs, before their use for growth. On the other hand, ASM3 assumes that all organic substrates are directly converted into stored material and that stored compounds are subsequently used as a carbon and energy source for growth purposes. Consequently, as the specific rate of hydrolysis of MPs in ASM1 is considerably lower than the specific rate of storage in ASM3, it becomes a rate-limiting factor in the uptake of MPs. Both models would, however, give similar values of MP concentration if no storage was considered in ASM3 and MPs were directly used for bacterial growth, as assumed in ASM1. The MP concentration estimated by ASM3 agrees with the dissolved organic carbon (DOC) value measured in the mixed liquor and does not
represent most of the soluble organic matter, as shown in Figure 5.
The effective control of mixed liquor suspended solids (MLSS) is often complicated because of the complex dynamic of the microorganisms. Excess sludge is manually removed from the sMBR every day in order to control MLSS concentration at
11000g m-3; however, its concentration varies
considerably (see Figure 5). In the simulations, a constant daily removal of 3.5 liters of excess sludge was assumed.
Mixed liquor volatile suspended solids (MLVSS) concentration was estimated by adding XH, XA, XS
and XI for both ASM1 and ASM3, as shown in
Equations (5) and (6), respectively. As can be seen, XSTO was also taken into account in the case of
ASM3.
(
XH XA XI XS)
.
MLVSS=090 + + + (5)
(
XH XA XI XS)
XSTO.
MLVSS=075 + + + +060 (6)
weight around the activated sludge (Lu et al., 2001). In any event, a better performance in the estimation of MLVSS was clearly obtained using the modified ASM3.
The model simulations for nitrogen showed good agreement with the experimental data. The SS
used as electron donor in the process of denitrification has different origins ASM1 and ASM3. In ASM3, all XS is contained in the influent
and none is generated by the decay process; consequently, SS comes from either the influent or
hydrolysis of XS in the influent. On the other hand,
in ASM1 a large fraction of XS is produced through
decay and XS is then hydrolyzed to SS which is used
as an extra source of electron donor for denitrification. Therefore, the modified ASM1 performed slightly better than the modified ASM3 in terms of the estimation of nitrate.
0 200 400 600 800 1000 1200 0
2 4 6 8 10
kLa = 12 h-1
R2 = 0.999 Chi2 = 0.00437
D
O
(g
m
-3 )
Time (s)
Current data Simulated data
0 10 20 30 40 50 60 2
4 6 8
ML
S
S
(g
m
-3 )
D
O
C
(g
m
-3 )
Time (days)
MLSS
8000 10000 12000 14000
DOC
Figure 5: DO trends for estimation of kLa. Figure 6: DOC concentration in the mixed liquor and
MLSS concentration during the period analyzed.
CONCLUSION
Establishing a structured model for systems of biological treatment of industrial wastewater is a formidable task. This research demonstrates that the modeling concept outlined, based on ASM3 and MP formation, can be easily and successfully applied to describe the biological status of the submerged membrane bioreactor. Nevertheless, it should be emphasized that specific chemical compounds in the wastewater, which may act in either a stimulatory or an inhibitory manner, can influence the microbial activity in the MBR, and the quality of wastewater parameters can be strongly influenced by environmental conditions. Hence, the current knowledge of MPs is far from complete, and consequently, further testing and validation is required to fully understand their contribution to the treatment process.
In this case study, the carbonaceous materials are more accurately estimated by ASM3 because it assumes that easily degradable organic matter is almost completely decomposed and slowly degradable organic matter is not generated inside the reactor. Furthermore, the estimated MP concentration in the mixed liquor and permeate agrees with the experimental evidence, which concurs with the assumption that MPs are directly stored before
bacterial growth. ASM1 though performs slightly better than ASM3 in the estimation of nitrate because organic matter is generated inside the reactor and is used as electron donor during denitrification.
As occurred in Lee et al. (2001), the amount of MPs was observed to be negligible in relation to the total suspended solids; therefore, the MP contribution to the total cake mass may probably be ignored, but their effect on cake structure (specific resistance) must be considered.
The current knowledge of MPs is still far from complete and much work is required to fully understand their contribution to the treatment processes and fouling mechanism. In order to characterize the decrease in membrane permeability, a model describing their filtration performance will be developed as well. In the long term, a close connection between process control and simulation is envisaged to derive methods to optimize reactor design and operation.
NOMENCLATURE
ASM1 Activated sludge model no. 1
(-)
ASM3 Activated sludge model no. 3
bH,O2 Aerobic endogenous
respiration rate for XH,
d-1 bH,NOX Anoxic endogenous
respiration rate for XH,
d-1 bA,NOX Anoxic endogenous
respiration rate for XA,
d-1
bA,O2 Aerobic endogenous
respiration rate for XA,
d-1 bSTO,O2 Aerobic respiration rate for
XSTO,
d-1 bSTO,NOX Anoxic respiration rate for
XSTO,
d-1
Smbr Submerged hollow fiber
membrane bioreactor
(-)
CSTR Continuous stirred tank reactor
(-)
DO Dissolved oxygen, gO2 m-3
DOC Dissolved organic carbon, gCOD m-3 fB Fraction of biomass that
ends up as MPs,
dimensionless
fSI Production of SI in
hydrolysis, gCOD I S (gCOD S X ) -1
fXI Production of XI in
endogenous respiration, gCOD I X (gCOD BM X ) -1
iN,BM N content of biomass XH
and XA,
gN (gCOD
BM
X ) -1
iN,SI N content of SI, gN (gCOD
I
S ) -1
iN,SS N content of SS, gN (gCOD
S
S ) -1
iN,XI N content of XI, gN (gCOD
I
X ) -1
iN,XS N content of XS, gN (gCOD
S
X ) -1
iSS,BM SS-to-COD ratio of XH and
XA,
gSS (gCOD
BM
X ) -1
iSS,XI SS-to-COD ratio for XI , gSS
(gCOD I
X ) -1
iSS,XS SS-to-COD ratio for XS, gSS (g COD
S
X ) -1
KALK Saturation constant for
alkalinity of XH,
mole HCO3- m-3
KA.ALK Bicarbonate saturation for
nitrifiers,
mole HCO3- m -3
KA,NH4 Ammonium substrate
saturation for XA,
gN m-3 KA,O2 Oxygen saturation for
nitrifiers,
gO2 m-3
kH Hydrolysis rate constant, gCOD
S X (gCOD H X ) -1 d-1 KMP Saturation constant for
substrate MPs,
gCODMP m-3
KNO4 Saturation constant for
ammonium,
SNH4, gN m-3
KNOX Saturation constant for
SNOX,
gNO3- - N m-3
KO2 Saturation constant for SO2, gO2 m-3
KS Saturation constant for
substrate SS,
gCOD
S
S m
-3
kSTO Storage rate constant, g COD
S X (g COD H X ) -1 d-1 KSTO Saturation constant for
XSTO,
gCOD STO X (g COD H X ) -1 d-1
KX Hydrolysis saturation
constant, g COD S X (g COD H X ) -1
MBR Membrane bioreactor (-)
MLSS Mixed liquor suspended
solids,
gCOD m-3
MLVSS Mixed liquor volatile suspended solids,
gCOD m-3
MP Microbial products, moleCOD m-3
OUR Oxygen utilization rate, g m-3 hour
PSI Poly silicate iron.
Qin Flow rate in influent, m3 day-1
Rr Oxygen consumption in
decay of biomass
(gO2 m-3 day-1)
SO2 Dissolved oxygen, gO2 m-3
SO2_in Oxygen concentration in
the influent,
gO2 m-3
SO2_sat Saturated oxygen
concentration,
gO2 m-3
SI Inert soluble organic
material,
gCOD m-3
SS Readily biodegradable
organic substrates,
gCOD m-3
SNH4 Ammonium plus ammonia
nitrogen,
gN m-3
SN2 Dinitrogen, gN m-3
SNOX Nitrate plus nitrite nitrogen, gN m-3
SALK Alkalinity of the
wastewater,
moleHCO3- m-3
XI Inert particulate organic
material,
gCOD m-3
XS Slowly biodegradable
substrates,
gCOD m-3
XH Heterotrophic organisms, gCOD m-3
XSTO A cell internal storage
product of heterotrophic organisms,
gCOD m-3
XA Nitrifying organisms, gCOD m-3
XSS Suspended solids, gSS m-3
T Time, s
T-COD Total COD, gCOD m-3
YA Yield of autotrophic
biomass per NO3-N, g
COD A
X
(gN NOX
S ) -1
YH,O2 Aerobic yield of
heterotrophic biomass,
gCOD H
X
(gCOD STO
X ) -1
YH,NOX Anoxic yield of
heterotrophic biomass,
gCOD
H
X
(gCOD
STO
X )
-1
YMP Heterotrophic yield
coefficient for STO,
gCODMP
(gCOD
STO
X )
-1
YSTO,O2 Aerobic yield of stored
product per SS,
gCOD STO
X
(gCOD S
S ) -1
YSTO,NOX Anoxic yield of stored
product per SS,
gCOD STO
X
(gCOD S
S ) -1
Greek Symbols
γMP,H MP formation constant for
heterotrophic bacteria,
dimensionless.
γMP,A MP formation constant for
autotrophic bacteria,
dimensionless.
ηNOX Anoxic reduction factor, dimensionless j
, k
ι
Composition matrix, wherek is the conservative and j is the biological process.
(-)
µA Autotrophic maximum
growth rate of XA,
d-1
µH Heterotrophic maximum
growth rate of XH,
d-1
ρj Kinetic rate, where j is the biological process,
gCOD m-3 d-1
j,i
ν Stoichiometric matrix, where j is the biological process and i the component (or state variable).
(-)
ACKNOWLEDGMENTS
The work presented here is part of the project entitled “Sustainable metabolic systems of water and waste for area-based society” supported by the 21st Center Of Excellence Program (COE) of Japan. The authors would like to thank Dr. Tsukasa Ito (Hokkaido University) for his valuable comments.
REFERENCES
Amy, G. L., Bryant, C. W., Belyani, M. Jr and Belyani, M., Molecular Weight Distributions of Soluble Organic Matter in Various Secondary and Tertiary Effluents, Wat. Sci. Tech., 19, 529 (1987).
Barker, D. J. and Stuckey, D. C., A Review of Soluble Microbial Products (SMP) in Wastewater Treatment Systems, Wat. Res., 33, 3063 (1999). Boero, V. J., Eckenfelder Jr., W. W. and Bowers A.
R., Soluble Microbial Product Formation in Biological Systems, Water Sci. Technol., 23, 106 (1991).
Carlson, K. H. and Amy, G. L., The Importance of Soluble Microbial Products (SMPs) in Biological Drinking Water Treatment, Wat. Res., 34, 1386 (2000).
Furumai, H., Kazmi, A. A., Fujita, M., Furuya, Y. and Sasaki, K., Modeling Long Term Nutrient Removal in a Sequencing Batch Reactor, Wat. Res., 33, 2708 (1999).
Gujer, W., Henze, M., Activated Sludge Modelling and Simulation, Wat. Sci. Technol., 23, 1011 (1991).
Gujer, W., Henze, M., Mino, T. and Loosdrecht, M., Activated Sludge Model No. 3, Wat. Sci. Technol., 39, 183 (1999).
Henze, M., Gujer, W., Mino, T. and Loodrecht, M., Activated Sludge Models: ASM1, ASM2, ASM2D and ASM3. Rep. No. 9, IWA, London (2000).
Huang, X., Liu, R. and Qian, Y., Behaviour of Soluble Microbial Products in a Membrane Bioreactor, Proc. Biochem., 36, 401 (2000).
Kappler, J. and Gujer, W., Estimation of Kinetic Parameters of Heterotrophic Biomass Under Aerobic Conditions and Characterization of Wastewater for Activated Sludge Modelling, Wat. Sci. Technol., 25, 125 (1992).
Lee, Y., Cho, J., Youngwoo, S., Lee, J. W. and Ahn, K., Modeling of Submerged Membrane Bioreactor Process for Wastewater Treatment, Desalination, 146, 451 (2001).
Lu, S. G., Imai, T., Ukita, M., Sekine, M., Higuchi, T. and Fukagawa, M., A Model for Membrane Bioreactor Process Based on the Concept of Formation and Degradation of Soluble Microbial Products, Wat. Res., 35, 2038 (2001).
Noguera, D. R., Araki, N. and Rittmann, B. E., Soluble Microbial Products (SMP) in Anaerobic Chemostats, Biotechnol. Bioengng., 44, 1040 (1994).
Norr, M. J. M. M., Nagaoka, H. and Ayab, H., Treatment of High Strength Industrial Wastewater Using Extended Aeration-Immersed Microfiltration (EAM) Process, Desalination, 149, 179 (2002). Silva, D. G. V., Urbain, V., Abeysinghe, D. H.,
Rittmann, B. E., Advanced Analysis on Membrane Bioreactor Performance with Aerobic-Anoxic Cycling, Wat. Sci. Technol., 38, 505 (1998). Vanrolleghen, P. A., Spanjers, H., Petersen, B., Ginestet,
P. and Takacs, I., Estimating (Combination of) Activated Sludge Model No. 1 Parameters and
Components by Respirometry, Wat. Sci. Techol., 39, 195 (1999).
Watanabe, Y. and Itonaga, T., Hybrid Municipal Wastewater Treatment System with Pre-Coagulation/Sedimentation, J. Ind. Eng. Chem., 10, 122 (2004).
Watanabe, Y., Kasahara, S. and Iwasaki, Y., Enhanced Flocculation/Sedimentation Process by a Jet Mixed Separator, Wat. Sci. Technol., 27, 55 (1998).
Wintgens, T., Rosen, J., Melin, T., Brepols, C., Drensla K. and Engelhardt N., Modelling of a Membrane Bioreactor System for Municipal Wastewater Treatment, J. Memb. Sci,. 216, 55 (2003).