ISSN 0104-6632 Printed in Brazil
www.abeq.org.br/bjche
Vol. 24, No. 02, pp. 293 - 306, April - June, 2007
Brazilian Journal
of Chemical
Engineering
DETERMINATION OF SOLUBILITY
PARAMETERS AND THERMODYNAMIC
PROPERTIES IN HYDROCARBON-SOLVENT
SYSTEMS BY GAS CHROMATOGRAPHY
E. Díaz
*, A. Cazurro, S. Ordóñez, A. Vega and J. Coca
Department of Chemical Engineering and Environmental Technology, University of Oviedo, Fax: (34) 985 103 434, Julián Clavería s/n, 33006, Oviedo, Spain
E-mail: [email protected]
(Received: October 4, 2005 ; Accepted: December 20, 2006)
Abstract - Gas chromatography used to calculate the specific retention volume of several hydrocarbons in
different chromatographic liquid phases (Squalane, Carbowax-400, Carbowax-1500, Carbowax-4000, Amine-220, Dinonyl phthalate, Tributyl phosphate and Trixylenyl phosphate). Some thermodynamic parameters, such as enthalpy of sorption and Flory-Huggins parameters relating the interaction between liquid phases and solutes, were also calculated from the determined retention volumes. Liquid phase solubility parameters of Squalane, Carbowax-400, Carbowax-1500 and Carbowax-4000 at 80 ºC as well as the polar and apolar components were calculated too. A new model was proposed to correlate polar contribution to the solubility parameter of a liquid phase with the specific retention volume of a solute in this liquid phase.
Keywords: Gas chromatography; Solubility parameter; Specific retention volume; Polar component; Flory-Huggins interaction parameters.
INTRODUCTION
Gas chromatography is an appropriate tool for characterizing bulk solvent or surface interactions of solutes with substances that can be coated as liquid films (or particle layers) on chromatographic supports or the walls of open tubular columns (Abraham et al., 1999). Only small amounts of material are required and physicochemical properties can be determined over a wide temperature range when allowed by the physical properties of the materials.
The chromatographic experiment provides a retention parameter, such as specific retention volume, that requires a model to express the results in a suitable form for interpretation of material properties. The solubility parameter concept is
widely used because it provides a rough and ready approximation of solubility behaviour. It may be used directly, as in the classification of stationary phases, or indirectly to obtain quantitative structure-behaviour relationships, such as the relationship between polarity and relative volatility (Everson and Van der Merwe, 1998), which could be very useful in separating two solutes with very close boiling points. This is the purpose of extractive distillation, a separation process often considered as an alternative to conventional distillation.
selected from pure components properties only. At least in a preliminary stage, the appropriate solvent for a given separation can be selected based on selectivity at infinite dilution, defined as the ratio of the activity coefficients of both components at infinite dilution in the solvent. An efficient extractive distillation solvent must have not only high selectivity, but also sufficient capacity or solvency for to have a good performance in the distillation process. The pattern of selectivity-solvency can aid in the reliable choice of solvents having the best balance of these properties, although other factors, such as solvent cost and availability, solvent thermal and chemical stability, corrosion, etc, must be taken into account (Vega et al., 1997). The infinite dilution activity coefficient for a given solute can be used to characterize the solvent capacity or solvency (Deal and Derr, 1964).
The main purpose of this work is to obtain the solubility parameter for different combinations of hydrocarbons and liquid phases, a topic that has been extensively studied since the seventies (Letcher et al., 2001, 2004). The aim of this work is to develop a simple model for obtaining a correlation between the retention volume for hydrocarbon series and the polar contribution to the solubility parameter.
THEORY
The retention data determined by chromatography experiments were used to calculate the thermodynamic functions of solute dissolution in the solvents as well as solubility parameters.
The retention volume of the solute depends on its partition between the stationary and mobile phase and is an indication of the bonding strength between the solute molecule and the liquid phase. It is defined as the volume of dry carrier gas necessary to elute the solute sample at 0 ºC per gram of stationary liquid phase. The specific retention volumes were determined by the following equation:
(
)
0 o w
g R d
o s o
p p 273.15·F
V t t j
T w p
−
= −
(1)
where tR is the retention time in minutes; td, the dead time (min); F, the carrier gas flow-rate (ml/min); To, the flow meter temperature (K); ws, the mass of the stationary phase (g); po, the outlet column pressure (Pa); pw, the vapor pressure of water at the flow meter temperature (Pa); and j, the James-Martin
compressibility factor (which takes into account the pressure profile in the column) defined as
(
)
(
)
2 i o 3 i op / p 1 3
j
2 p / p 1
− = − (2)
where pi is the pressure at the beginning of the chromatographic column.
The retention volumes are related to the activity coefficients. These coefficients at infinite dilution are an important property, which is used for the selection of selective solvents (extraction and extractive distillation) and for the reliable design of thermal separation processes. More concretely, the influence of the solvent is usually quantified in terms of its so-called selectivity, which is defined as the ratio of the activity coefficients of two components in the presence of the solvent. The activity coefficients of solute 1 at infinite dilution in solvent 2, γ1∞, were determined from the specific retention volume, V0g, by the following equation, (Weidlich et al., 1987; Vega and Coca, 1991):
0 1 11 1 0 0
g 2 1
P B 273.15R
ln ln
RT V M P
∞
γ = −
(3)
where M2 is the molecular weight of the liquid phase; P1o, the saturated vapour pressure of the pure solute; B11, the second virial interaction coefficient of the solute; and R, the gas constant. Vapour pressures were calculated using the Antoine equation, and B11 was estimated from the Beattie-Bridgeman correlation (Alessi et al., 1978):
(
)
(
)
311 c c c
B / V =0.461 1.158 T / T− −0.503 T / T (4)
where Vc and Tc are the critical volume and temperature of the solute, respectively, values which were obtained from the literature (ESDU, 1987).
Likewise, also related to the specific retention volume is the molar heat (entalphy), ∆HS1, of sorption of the probe in the stationary phase. This parameter relates the absolute temperature (K) and the specific retention volume, in accordance with the following equation, (Kaya et al., 2002):
0 g S 1 ln V H R (1/ T) ∂ ∆ = −
The activity coefficient is commonly expressed as the contribution of two effects: the thermal contribution, γt∞, resulting from molecular interactions of the compounds, and the athermal contribution, γa∞, associated with the difference in size between the solute and solvent molecules:
1 t a
lnγ = γ + γ∞ ln ∞ ln ∞ (6)
The interaction parameter, χ∞, is related with ln
γ1∞ by subtracting the Flory-Huggins size correction:
1
1 1
ln ln 1
r r
∞ ∞
χ = γ − − −
(7)
where r is approximated as the molar volume ratio of solvent to solute.
The size correction is usually taken as the value of ln γa∞. The interaction parameter redefined as “residual” free energy involves the enthalpy and entropy effects
H S
∞ ∞ ∞
χ = χ + χ (8)
and from the regular solution theory
(
0)
(
)
2H∞ V / RT1 2 1
χ = δ − δ (9)
The solubility parameter is widely used to give a rough and ready approximation of solubility behaviour. The solubility parameter of the solute, δ1, is the square root of the cohesive energy density of a compound and thus is a measure of the strength of its intermolecular forces (Hildebrand and Scott, 1962). It is related to the enthalpy of vaporization, ∆Hvap, and the molar volume, V1o, by
vap
1 0 o
1 1
E H RT
V V
∆ ∆ −
δ = = (10)
Substituting Eq. (8) into Eq. (9) , the solubility parameter of the stationary phase, δ2, can be calculated
2 2
S
1 2 2
1
0 0
1 1
2
RT V RT RT V
∞
∞
δ − χ = δ δ −δ +χ
(11)
A plot of the left side of Eq. (11) against the probe solubility parameter, δ1, a straight line with a
slope of 2δ2/RT is obtained. This approach has been applied to a wide range of materials including polymers (Hamedi and Danner, 2001), organic pollutants (Voelkel and Kopczynski, 1998), chromatographic stationary phases (Vega and Coca, 1991) and biological materials (Pena et al., 2000) as well as electrokinetic chromatographies (Liu et al., 1999).
The effect of polar interactions can be approached by dividing the solubility parameter into thr different contributions. The interaction energies could be considered as additive contributions from dispersion and polar interactions:
2 2 2
δ = λ + τ (12)
where λ represents the non-polar (due to dispersive forces between molecules and stationary phase) and
τ , the polar component of the solubility parameter. The polar component, τ, may be subdivided into an electrostatic part (due to electron density of the chemical structure), δp, and a hydrogen bonding part,
δH. Probes interacting only with dispersive intermolecular forces (i.e. n-alkanes) should give a linear relation when plotted in accordance with Eq. (11). However, solutes with other contributions to their retention will deviate from the line, with the degree of deviation being a measure of the strength of the polar components.
EXPERIMENTAL SECTION
The flow rate was 30 cm3/min, and it was measured using a calibrated soap bubble flow meter.
Preliminary tests with variable amounts of sample showed that up to 2 µL, the retention times obtained did not depend on sample volume. For this reason, the injection sample was always less than 2 µL. The elution peaks were only slightly asymmetric, which is a good indication of infinite dilution conditions (Conder, 1969).
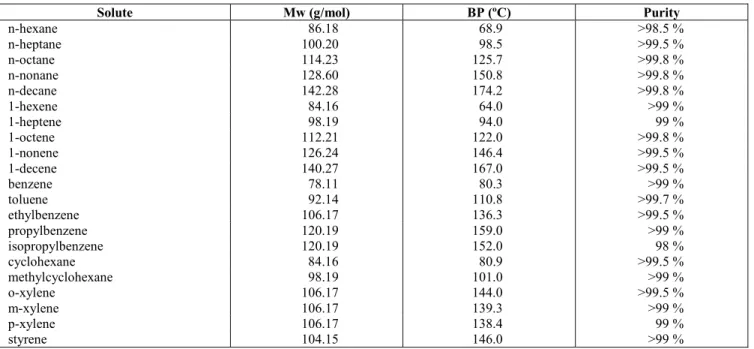
Solutes (hydrocarbons) were reagent grade from Fluka; purities and other information for these compounds are given in Table 1. The liquid phases used as well as their manufacturers are listed in Table 2. In order to minimize the bleeding of the column, a presaturator containing packing coated with the liquid phase was connected between the carrier gas regulator and the injection point to saturate the carrier gas with the liquid phase.
Table 1: Physical properties of solutes used in the present work
Solute Mw (g/mol) BP (ºC) Purity
n-hexane 86.18 68.9 >98.5 %
n-heptane 100.20 98.5 >99.5 %
n-octane 114.23 125.7 >99.8 %
n-nonane 128.60 150.8 >99.8 %
n-decane 142.28 174.2 >99.8 %
1-hexene 84.16 64.0 >99 %
1-heptene 98.19 94.0 99 %
1-octene 112.21 122.0 >99.8 %
1-nonene 126.24 146.4 >99.5 %
1-decene 140.27 167.0 >99.5 %
benzene 78.11 80.3 >99 %
toluene 92.14 110.8 >99.7 %
ethylbenzene 106.17 136.3 >99.5 %
propylbenzene 120.19 159.0 >99 %
isopropylbenzene 120.19 152.0 98 %
cyclohexane 84.16 80.9 >99.5 %
methylcyclohexane 98.19 101.0 >99 %
o-xylene 106.17 144.0 >99.5 %
m-xylene 106.17 139.3 >99 %
p-xylene 106.17 138.4 99 %
styrene 104.15 146.0 >99 %
Table 2: Liquid phases studied in this work
Stationary phase Manufacturer Purity
Dinonyl phthalate (DP) Sigma-Aldrich > 99 %
Squalane (SQ) Fluka 99 %
Carbowax 400 (C-400) Panreac > 95 %
Carbowax 1500 (C-1500) Panreac > 95 %
Carbowax 4000 (C-4000) Panreac > 95 %
Amine 220 (A-220) Alltech > 99 %
Tributyl phosphate (TBP) Sigma-Aldrich > 99 %
Trixylenyl phosphate (TXP) Graco > 98 %
RESULTS AND DISCUSSION
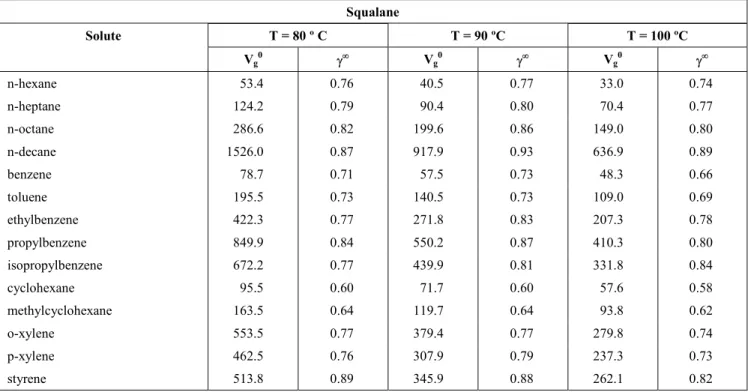
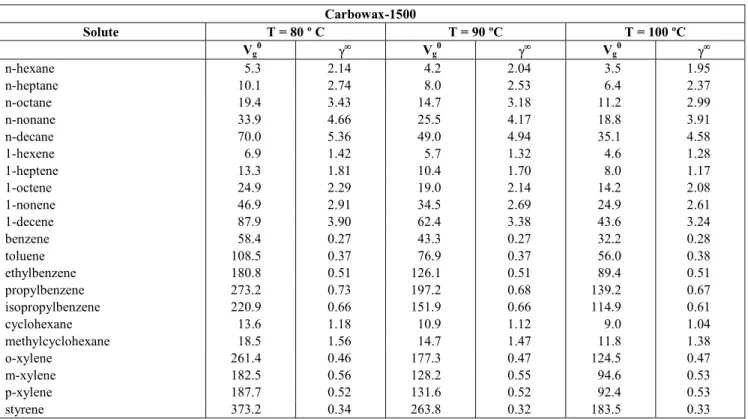
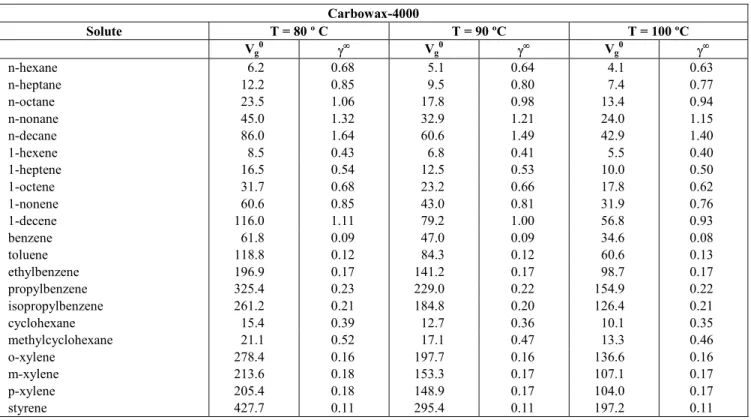
The specific retention volumes, Vg0, of the solutes calculated in accordance with Eq. (1) and activity coefficients at infinite dilution, γ∞, calculated in accordance with Eq. (3) are given in Tables 3 to 10. As shown in Tables 3 to 10, values of Vg0 increase with the molecular weight of each group of solvents with an elution order from a smaller to a larger number of carbon atoms for each homologous solute series.
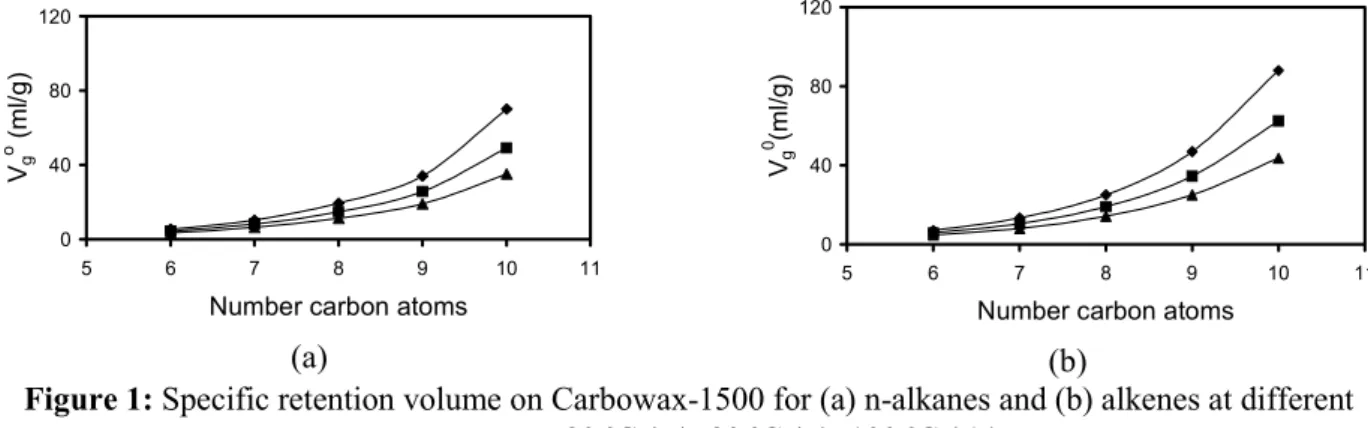
The behaviour of alkenes and n-alkanes is similar, as can be observed in Figs. 1 and 2. In both cases the Vg0 parameter decreases with operation temperature (reasonable, considering that this parameter is characterised by an exothermic equilibrium process) and increases as the solute molecular weight increases (higher molecular weight results in a higher boiling point and a higher affinity for condensed phases).
C-4000 > TBP > TXP > A-220 > DP > SQ, so Carbowax-1500 was taken as representative of high polarity solvents, whereas Amine-220 was been taken as an example of low polarity solvents. Hence, it can be observed that both, n-alkanes and alkenes have higher affinity for the less polar solvent. In the
case of alkenes this result and the likeness of the general behaviour between the alkenes and n-alkanes studied, lead one to think that the absorption properties of these alkenes are controlled by the bulk organic structure, rather than by the presence of the double bond.
Table 3: Specific retention volume (ml/g) and activity coefficients at infinite dilution calculated for Dinonyl phthalate at different temperatures
Dinonyl phthalate
T = 90 º C T = 100 ºC T = 120 ºC T = 130 ºC
Solute
Vg0 γ∞ Vg0 γ∞ Vg0 γ∞ Vg0 γ∞
n-hexane 25.8 1.22 20.5 1.20 12.5 1.24 11.6 1.09
n-heptane 57.3 1.27 42.9 1.27 24.5 1.33 22.2 1.15
n-octane 119.5 1.41 89.0 1.36 51.5 1.30 40.9 1.26
n-decane 484.7 1.79 360.1 1.60 179.0 1.54 129.5 1.53
benzene 69.9 0.61 54.3 0.59 31.4 0.63 28.6 0.56
toluene 157.9 0.66 118.5 0.64 63.3 0.69 56.7 0.60
ethylbenzene 325.1 0.71 235.0 0.72 113.3 0.78 99.0 0.68
propylbenzene 576.6 0.84 379.3 0.88 209.9 0.81 166.7 0.76
isopropylbenzene 466.3 0.77 315.4 0.80 173.4 0.76 137.9 0.72
cyclohexane 47.7 0.91 39.7 0.85 22.4 0.93 21.2 0.79
methylcyclohexane 76.7 1.01 60.0 0.98 37.3 0.95 30.1 0.92
o-xylene 444.0 0.67 306.9 0.68 148.4 0.75 129.8 0.64
p-xylene 341.8 0.72 240.5 0.72 122.9 0.76 110.3 0.64
styrene 434.7 0.71 320.2 0.68 169.0 0.68 134.7 0.64
Table 4: Specific retention volume (ml/g) and activity coefficients at infinite dilution calculated for Squalane at different temperatures
Squalane
Solute T = 80 º C T = 90 ºC T = 100 ºC
Vg 0
γ∞ V
g 0
γ∞ V
g 0
γ∞
n-hexane 53.4 0.76 40.5 0.77 33.0 0.74
n-heptane 124.2 0.79 90.4 0.80 70.4 0.77
n-octane 286.6 0.82 199.6 0.86 149.0 0.80
n-decane 1526.0 0.87 917.9 0.93 636.9 0.89
benzene 78.7 0.71 57.5 0.73 48.3 0.66
toluene 195.5 0.73 140.5 0.73 109.0 0.69
ethylbenzene 422.3 0.77 271.8 0.83 207.3 0.78
propylbenzene 849.9 0.84 550.2 0.87 410.3 0.80
isopropylbenzene 672.2 0.77 439.9 0.81 331.8 0.84
cyclohexane 95.5 0.60 71.7 0.60 57.6 0.58
methylcyclohexane 163.5 0.64 119.7 0.64 93.8 0.62
o-xylene 553.5 0.77 379.4 0.77 279.8 0.74
p-xylene 462.5 0.76 307.9 0.79 237.3 0.73
Table 5: Specific retention volume (ml/g) and activity coefficients at infinite dilution calculated for Carbowax-400 at different temperatures
Carbowax-400
Solute T = 80 º C T = 90 ºC T = 100 ºC
Vg 0
γ∞ V
g 0
γ∞ V
g 0
γ∞
n-hexane 4.6 9.25 3.8 8.56 3.2 8.00
n-heptane 8.7 11.91 6.9 10.92 5.7 10.03
n-octane 16.4 15.23 12.7 13.82 10.0 12.62
n-nonane 30.4 19.48 22.7 17.56 17.4 15.83
n-decane 56.6 24.87 40.6 22.35 30.1 20.00
1-hexene 6.5 5.62 5.3 5.30 4.3 5.05
1-heptene 12.3 7.33 9.7 6.86 7.7 6.49
1-octene 22.8 9.39 17.4 8.75 13.5 8.18
1-nonene 42.6 12.04 31.2 11.18 23.4 10.41
1-decene 78.3 16.42 55.5 14.23 40.4 13.10
benzene 53.2 1.11 39.0 1.13 29.2 1.15
toluene 97.2 1.54 68.2 1.59 52.4 1.52
ethylbenzene 159.2 2.17 110.8 2.16 78.9 2.17
propylbenzene 255.2 2.95 173.4 2.92 120.2 2.90
isopropylbenzene 209.4 2.63 141.8 2.65 100.0 2.63
cyclohexane 12.2 4.95 9.7 4.71 7.8 4.49
methylcyclohexane 16.2 6.77 12.6 6.44 10.1 6.08
o-xylene 219.6 2.05 155.3 1.99 109.5 1.99
m-xylene 167.0 2.29 119.6 2.21 84.3 2.22
p-xylene 161.7 2.29 115.2 2.23 82.2 2.22
styrene 344.7 1.37 236.0 1.36 159.7 1.42
Table 6: Specific retention volume (ml/g) and activity coefficients at infinite dilution calculated for Carbowax-1500 at different temperatures
Carbowax-1500
Solute T = 80 º C T = 90 ºC T = 100 ºC
Vg0 γ∞ Vg0 γ∞ Vg0 γ∞
n-hexane 5.3 2.14 4.2 2.04 3.5 1.95
n-heptane 10.1 2.74 8.0 2.53 6.4 2.37
n-octane 19.4 3.43 14.7 3.18 11.2 2.99
n-nonane 33.9 4.66 25.5 4.17 18.8 3.91
n-decane 70.0 5.36 49.0 4.94 35.1 4.58
1-hexene 6.9 1.42 5.7 1.32 4.6 1.28
1-heptene 13.3 1.81 10.4 1.70 8.0 1.17
1-octene 24.9 2.29 19.0 2.14 14.2 2.08
1-nonene 46.9 2.91 34.5 2.69 24.9 2.61
1-decene 87.9 3.90 62.4 3.38 43.6 3.24
benzene 58.4 0.27 43.3 0.27 32.2 0.28
toluene 108.5 0.37 76.9 0.37 56.0 0.38
ethylbenzene 180.8 0.51 126.1 0.51 89.4 0.51
propylbenzene 273.2 0.73 197.2 0.68 139.2 0.67
isopropylbenzene 220.9 0.66 151.9 0.66 114.9 0.61
cyclohexane 13.6 1.18 10.9 1.12 9.0 1.04
methylcyclohexane 18.5 1.56 14.7 1.47 11.8 1.38
o-xylene 261.4 0.46 177.3 0.47 124.5 0.47
m-xylene 182.5 0.56 128.2 0.55 94.6 0.53
p-xylene 187.7 0.52 131.6 0.52 92.4 0.53
Table 7: Specific retention volume (ml/g) and activity coefficients at infinite dilution calculated for Carbowax-4000 at different temperatures
Carbowax-4000
Solute T = 80 º C T = 90 ºC T = 100 ºC
Vg0 γ∞ Vg0 γ∞ Vg0 γ∞
n-hexane 6.2 0.68 5.1 0.64 4.1 0.63
n-heptane 12.2 0.85 9.5 0.80 7.4 0.77
n-octane 23.5 1.06 17.8 0.98 13.4 0.94
n-nonane 45.0 1.32 32.9 1.21 24.0 1.15
n-decane 86.0 1.64 60.6 1.49 42.9 1.40
1-hexene 8.5 0.43 6.8 0.41 5.5 0.40
1-heptene 16.5 0.54 12.5 0.53 10.0 0.50
1-octene 31.7 0.68 23.2 0.66 17.8 0.62
1-nonene 60.6 0.85 43.0 0.81 31.9 0.76
1-decene 116.0 1.11 79.2 1.00 56.8 0.93
benzene 61.8 0.09 47.0 0.09 34.6 0.08
toluene 118.8 0.12 84.3 0.12 60.6 0.13
ethylbenzene 196.9 0.17 141.2 0.17 98.7 0.17
propylbenzene 325.4 0.23 229.0 0.22 154.9 0.22
isopropylbenzene 261.2 0.21 184.8 0.20 126.4 0.21
cyclohexane 15.4 0.39 12.7 0.36 10.1 0.35
methylcyclohexane 21.1 0.52 17.1 0.47 13.3 0.46
o-xylene 278.4 0.16 197.7 0.16 136.6 0.16
m-xylene 213.6 0.18 153.3 0.17 107.1 0.17
p-xylene 205.4 0.18 148.9 0.17 104.0 0.17
styrene 427.7 0.11 295.4 0.11 197.2 0.11
Table 8: Specific retention volume (ml/g) and activity coefficients at infinite dilution calculated for Amine-220 at different temperatures
Amine-220
Solute T = 70 º C T = 80 ºC T = 90 ºC
Vg0 γ∞ Vg0 γ∞ Vg0 γ∞
n-hexane 30.1 2.17 23.1 2.12 17.0 2.21
n-heptane 69.1 2.40 50.2 2.37 36.3 2.40
n-octane 156.8 2.66 109.0 2.62 74.9 2.68
n-nonane 328.7 3.16 214.7 3.16 145.4 3.14
n-decane 786.8 3.28 503.3 3.20 315.5 3.29
1-hexene 28.6 1.95 21.2 1.99 16.3 1.98
1-heptene 65.1 2.19 46.3 2.22 34.0 2.24
1-octene 146.4 2.43 99.6 2.46 70.3 2.48
1-nonene 329.1 2.70 214.2 2.74 144.8 2.75
1-decene 733.1 3.20 456.2 3.22 306.9 2.94
benzene 94.2 0.98 69.9 0.96 51.0 0.99
toluene 218.1 1.12 154.9 1.11 108.9 1.14
ethylbenzene 447.7 1.30 305.4 1.29 207.3 1.32
propylbenzene 893.6 1.48 585.7 1.47 384.4 1.50
isopropylbenzene 665.8 1.42 459.8 1.37 305.3 1.41
cyclohexane 61.9 1.51 47.1 1.47 34.9 1.50
methylcyclohexane 101.5 1.71 75.5 1.66 53.9 1.72
o-xylene 620.5 1.24 425.6 1.21 281.6 1.26
m-xylene 462.3 1.40 310.2 1.40 215.4 1.40
p-xylene 486.3 1.29 335.6 1.26 223.9 1.31
Table 9: Specific retention volume (ml/g) and activity coefficients at infinite dilution calculated for Tributyl phosphate at different temperatures
Tributyl phosphate
Solute T = 80 º C T = 90 ºC T = 100 ºC
Vg 0
γ∞ V
g 0
γ∞ V
g 0
γ∞
n-hexane 15.2 3.06 12.0 2.96 9.6 2.90
n-heptane 33.8 3.75 25.1 3.31 19.3 3.22
n-octane 70.5 3.85 51.8 3.68 38.2 3.59
n-nonane 149.4 4.21 105.8 4.11 75.3 3.99
n-decane 315.7 4.85 214.9 4.89 147.7 4.44
1-hexene 17.4 2.30 13.9 2.20 11.1 2.17
1-heptene 38.0 2.57 29.1 2.49 22.2 2.46
1-octene 81.2 2.88 59.8 2.77 44.0 2.73
1-nonene 171.1 3.26 122.4 3.10 86.9 3.05
1-decene 363.6 3.84 248.1 3.46 169.1 3.41
benzene 74.3 0.85 56.7 0.85 42.0 0.87
toluene 165.1 0.99 120.8 0.97 86.6 1.00
ethylbenzene 327.6 1.14 232.0 1.12 160.4 1.16
propylbenzene 620.4 1.32 426.5 1.29 286.0 1.32
isopropylbenzene 497.1 1.20 347.9 1.17 234.2 1.22
cyclohexane 32.7 2.01 25.8 1.92 20.2 1.88
methylcyclohexane 51.5 2.31 40.3 2.19 30.5 2.18
o-xylene 459.3 1.07 317.6 1.06 218.0 1.09
m-xylene 360.8 1.15 253.4 1.13 175.4 1.16
p-xylene 352.7 1.14 244.2 1.14 172.3 1.15
styrene 576.8 0.89 397.9 0.88 269.2 0.91
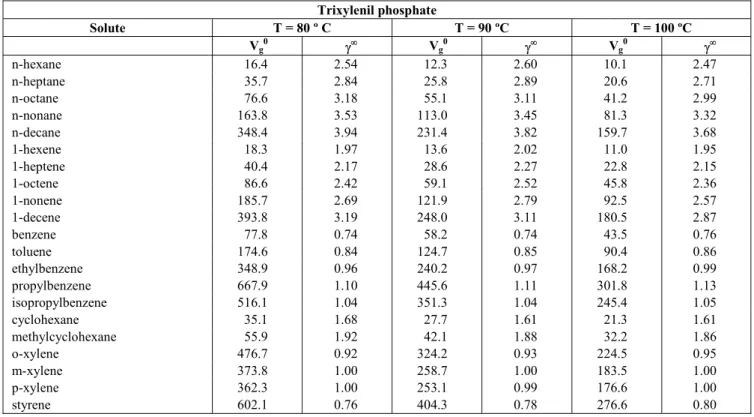
Table 10: Specific retention volume (ml/g) and activity coefficients at infinite dilution calculated for Trixylenil phosphate at different temperatures
Trixylenil phosphate
Solute T = 80 º C T = 90 ºC T = 100 ºC
Vg 0
γ∞ V
g 0
γ∞ V
g 0
γ∞
n-hexane 16.4 2.54 12.3 2.60 10.1 2.47
n-heptane 35.7 2.84 25.8 2.89 20.6 2.71
n-octane 76.6 3.18 55.1 3.11 41.2 2.99
n-nonane 163.8 3.53 113.0 3.45 81.3 3.32
n-decane 348.4 3.94 231.4 3.82 159.7 3.68
1-hexene 18.3 1.97 13.6 2.02 11.0 1.95
1-heptene 40.4 2.17 28.6 2.27 22.8 2.15
1-octene 86.6 2.42 59.1 2.52 45.8 2.36
1-nonene 185.7 2.69 121.9 2.79 92.5 2.57
1-decene 393.8 3.19 248.0 3.11 180.5 2.87
benzene 77.8 0.74 58.2 0.74 43.5 0.76
toluene 174.6 0.84 124.7 0.85 90.4 0.86
ethylbenzene 348.9 0.96 240.2 0.97 168.2 0.99
propylbenzene 667.9 1.10 445.6 1.11 301.8 1.13
isopropylbenzene 516.1 1.04 351.3 1.04 245.4 1.05
cyclohexane 35.1 1.68 27.7 1.61 21.3 1.61
methylcyclohexane 55.9 1.92 42.1 1.88 32.2 1.86
o-xylene 476.7 0.92 324.2 0.93 224.5 0.95
m-xylene 373.8 1.00 258.7 1.00 183.5 1.00
p-xylene 362.3 1.00 253.1 0.99 176.6 1.00
0 40 80 120
5 6 7 8 9 10 11
Number carbon atoms Vg
o (ml
/g
)
(a)
0 40 80 120
5 6 7 8 9 10 11
Number carbon atoms Vg
0 (ml
/g
)
(b)
Figure 1: Specific retention volume on Carbowax-1500 for (a) n-alkanes and (b) alkenes at different temperatures: 80 ºC (♦), 90 ºC (■), 100 ºC (▲)
0 500 1000 1500
5 7 9 11
Number carbon atoms
Vg
0 (m
l/
g
)
(a)
0 500 1000 1500
5 7 9 11
Number carbon atoms
Vg
0 (m
l/
g
)
(b)
Figure 2: Specific retention volume on Amine-220 for (a) n-alkanes and (b) alkenes at different temperatures: 70 ºC (♦), 80 ºC (■), 90 ºC (▲)
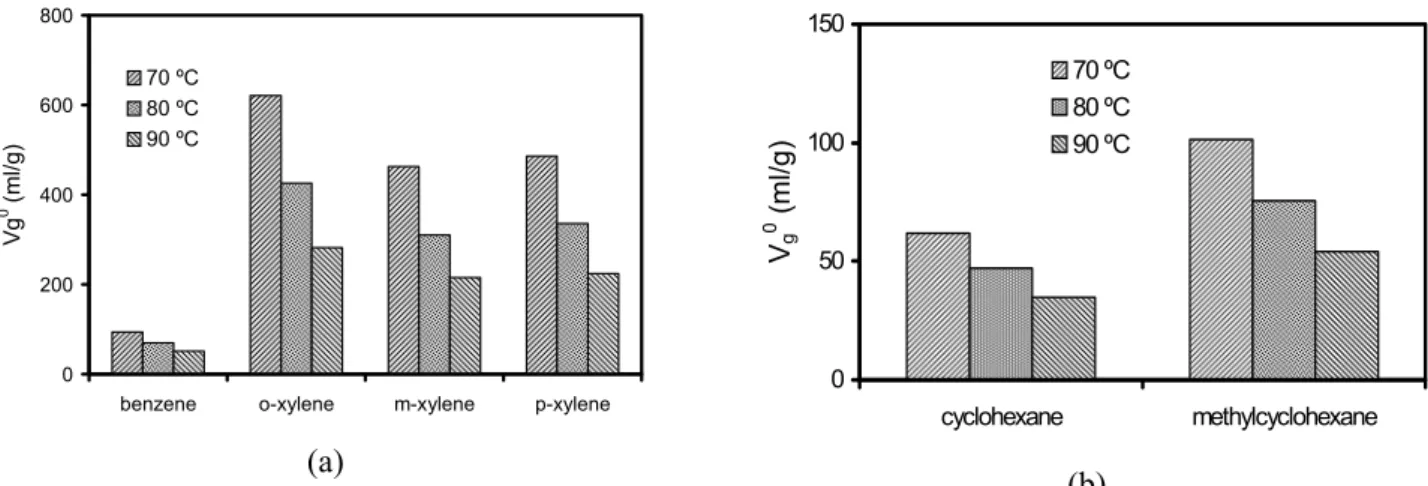
For the aromatic compounds (Fig. 3 and 4), a more similar behaviour between highly polar and lowly polar liquid phases was found, suggesting a selective interaction of the aromatic with the polar groups of the liquid phase. In the case of cycloalkanes, this selective interaction was lower (the difference in the interaction
strength increases again). In both cases, the presence of methyl groups increased the interaction of the solutes with the active phases. This increase was more important for aromatic compounds and was supposedly caused by the increase in the electronic density, and hence the polarity, of the aromatic compounds.
0 100 200 300
benzene o-xylene m-xylene p-xylene
Vg
0 (m
l/
g
)
80 ºC 90 ºC 100 ºC
(a)
0 5 10 15 20
cyclohexane methylcyclohexane
Vg
0 (m
l/
g
)
80 ºC
90 ºC
100 ºC
(b)
0 200 400 600 800
benzene o-xylene m-xylene p-xylene
Vg
0 (m
l/
g
)
70 ºC 80 ºC 90 ºC
(a)
0 50 100 150
cyclohexane methylcyclohexane
Vg
0 (m
l/
g
)
70 ºC 80 ºC 90 ºC
(b)
Figure 4: Specific retention volume on Amine-220 for (a) aromatic and (b) cyclic compounds
Activity coefficients at infinite dilution for squalane were less than one; these low values suggest low solution enthalpies for the methyl-alkane interactions, as found by Langer et al. (1982). It can also be observed that this value increased as the size of solute increased. This can be explained by the parallel arrangement between the solute and the solvent, so small molecules were closer to the solvent, thus having stronger interactions than larger molecules. For the polar liquid phases, it can be observed that alkenes and especially aromatic hydrocarbons were retained with higher selectivity than alkanes, this behaviour being explained by the fact that alkanes experience less polarization. On the other hand, it can also be observed that the solubility of alkanes decreased as the molecular mass of the liquid phase (Carbowax) increased, with this effect being more marked for aromatic compounds than for alkanes and alkenes (Tables 5-7). Due to the electronegativity of the O atom, the C-O bond has a dipole moment, and this polarity is determined by the conformations adopted by chain segments. The global structure of the chain is correlated with polar interactions with other molecules, the strength of the bond between liquid phase and solute increasing as the freedom of the C-O bond increases (González et al., 2002; González and Pérez-Parajon, 2003).
Values of interaction parameter at infinite dilution, χ∞, obtained with Eq. (5) (Table 11) as well as values of solubility parameter of solute, δ1, obtained with Eq. (10) were used in Eq. (11) to calculate δ2. It had already been established that, when χ∞was lower than about 0.5, the liquid phase and the solute were compatible, whereas when χ∞ was greater than about 0.5, solvent-solute interactions were unfavourable (Abraham et al.,
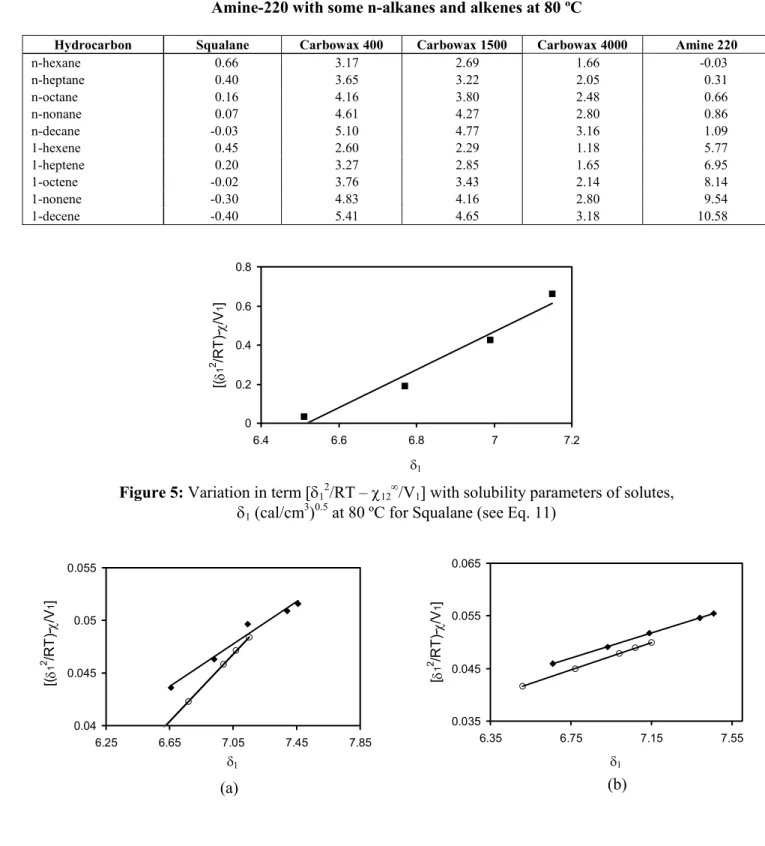
1999). The solubility parameter of the stationary phase, δ2, was determined from the slope of a straight line obtained by plotting the left-hand side of Eq. (11) versus δ1; an illustration of the method employed is shown in Fig. 5 for Squalane. The solubility parameters, δ2, for Squalane, Carbowax-400, Carbowax-1500, Carbowax-4000 and Amine-220 are listed in Table 12.
According to Eq. (12), probes that interact only with dispersion intermolecular forces (i.e. n-alkanes) should give a straight linear relationship when plotted in accordance with Eq. (11) (Fig. 5). However, probes that have other contributions to their retention will deviate from the line, with the degree of deviation being a measure of the strength of the polar components. Typical plots are depicted in Fig. 6, with the difference between the n-alkanes and alkenes being clear in these plots. The contributions to δ2 for the compounds studied are given in Table 12.
Although values of the specific retention volumes are found in the literature, solubility parameters are not often reported. To obtain the specific retention volume dependence on the solubility parameters for the systems studied here, values of Vg0 for a solute are plotted vs. values of τ for the different liquid phases studied in this work. As can be observed in Fig. 7, an exponential trend can be inferred from these plots, so these plots can be linearized by an equation of the following type:
0 g
V =a lnτ +b (13)
atoms, N, within a homologous series (correlation coefficient, r2, of 0.996 and 0.98 for alkanes and alkenes, respectively). The equations for parameters a and b are shown in Table 13.
An examination of Eq. (13) may give indications about the retention of a solute in a liquid phase and some conclusions can be drawn: (i) A solute will
have approximately the same retention volume in any non-polar liquid phase and (ii) a solute will have approximately the same retention volume in any liquid phase with the same polar solubility parameter. Hence, the polar solubility parameter τ1 is a useful parameter for classifying and selecting liquid phases for a given separation.
Table 11: Interaction parameters, χ∞, of Squalane, Carbowax-400, Carbowax-1500, Carbowax-4000 and Amine-220 with some n-alkanes and alkenes at 80 ºC
Hydrocarbon Squalane Carbowax 400 Carbowax 1500 Carbowax 4000 Amine 220
n-hexane 0.66 3.17 2.69 1.66 -0.03
n-heptane 0.40 3.65 3.22 2.05 0.31
n-octane 0.16 4.16 3.80 2.48 0.66
n-nonane 0.07 4.61 4.27 2.80 0.86
n-decane -0.03 5.10 4.77 3.16 1.09
1-hexene 0.45 2.60 2.29 1.18 5.77
1-heptene 0.20 3.27 2.85 1.65 6.95
1-octene -0.02 3.76 3.43 2.14 8.14
1-nonene -0.30 4.83 4.16 2.80 9.54
1-decene -0.40 5.41 4.65 3.18 10.58
0 0.2 0.4 0.6 0.8
6.4 6.6 6.8 7 7.2
δ1
[(δ
1
2 /R
T
)-χ
/V
1
]
Figure 5: Variation in term [δ1 2
/RT – χ12∞/V1] with solubility parameters of solutes,
δ1 (cal/cm3)0.5 at 80 ºC for Squalane (see Eq. 11)
0.04 0.045 0.05 0.055
6.25 6.65 7.05 7.45 7.85
δ1
[(δ
1
2 /R
T
)-χ
/V
1
]
(a)
0.035 0.045 0.055 0.065
6.35 6.75 7.15 7.55
δ1
[1δ
2 /R
T
)-χ
/V
1
]
0.04 0.05 0.06 0.07
6.4 6.8 7.2 7.6
δ1
[(δ
1
2 /R
T
)-χ /V1
]
(c)
0 0.02 0.04 0.06 0.08
6 6.5 7 7.5 8
δ1
[(δ
1
2 /R
T
)-χ
/V
1
]
(d)
Figure 6:
Estimation of the contributions to the solubility parameter at 80 ºC [alkanes (♦), alkenes (o)] for different liquid phases: (a) Carbowax 400, (b) Carbowax 1500, (c) Carbowax 4000, (d) Amine 220.Table 12: Solubility parameter, δ2 (cal/cm 3
)0.5, and the dispersive, λ , and polar, τ, contributions at 80 ºC for different liquid phases
Liquid phase δ2 λ τ
Squalane 9.19 9.19 0
Carbowax-400 6.90 5.75 3.82
Carbowax-1500 6.40 4.52 4.53
Carbowax-4000 6.27 4.90 3.90
Amine-220 5.16 3.83 3.46
0 20 40 60 80
0 1 2 3 4 5
τ
V
g
0
(a) (b)
Figure 7: Vg0 as a function of τ at 80 ºC for different liquid phases [Squalane (♦), Amine 220 (■), Carbowax 400 (▲), Carbowax 1500 (○), Carbowax 4000 (-)] : (a) for n-hexane, (b) for 1-hexene
Table 13: Relationship between the coefficients of Eq. (13) and the number of atoms (N) of alkanes and alkenes.
a = -73N + 465
normal alkane series
b = 156N - 981 a = -193N + 1234
1-alkene series
CONCLUSIONS
Retention data obtained by gas chromatography was used successfully for calculating the polar solubility parameter of a given liquid phase. Results obtained for different liquid phases and solutes were compared in terms of specific retention volumes and activity coefficients.
This work shows that values of solubility parameter, δ, involving the polar and apolar contributions (τ and λ, respectively) can be estimated from specific retention volume, Vg0. This parameter is related with the relative volatility, which determines the distribution of components between different phases (Everson and Van der Merwe, 1998).
REFERENCES
Abraham, H., Poole, C.F. and Poole, S.K., Classification of Stationary Phases and Other Materials by Gas Chromatography, J. Chromatogr. A, 842, 79 (1999).
Alessi, P., Kikic, I., Papo, A. and Torriano, G., Gas chromatographic Characterization of Phosphate Esters, J. Chem. Eng. Data, 23, 29 (1978).
Conder, J.R., The Derivation of Thermodynamic
Information from Asymmetrical Chromatographic Peaks when More than One
Distribution Mechanism Contributes to Retention, J. Chromatogr. A, 39, 273 (1969).
Deal, C.H. and Derr, E.L., Selectivity and Solvency in Aromatics Recovery, Ind. Eng. Chem. Process Des. Dev., 3, 394 (1964).
ESDU International Ltd – Engineering Sciences Data, Physical Data, General,
November, 1987.
Everson, R.C. and Van der Merwe, B.J., The Effects of Selected Solvents on the Relative Volatility of a Binary System Consisting of 1-Octene and 2-Hexanone, Fluid Phase Equilibria, 143, 173 (1998).
González, F.R. and Pérez-Parajón, J., Effects of Solvent Density on Retention in Gas – Liquid chromatography: II. Polar Solutes in Poly(ethylene glycol) Stationary Phases, J. Chromatogr. A, 969, 265 (2003).
González, F.R., Pérez-Parajón, J. and García-Domínguez, J.A., Effects of Solvent Density on
Retention in Gas Liquid Chromatography: I. Alkanes Solutes in Polyethylene Glycol Stationary Phases, J. Chromatogr. A, 953, 151 (2002).
Hamedi, M. and Danner, R.P., Prediction of Solubility Parameters using the Group - Contribution Lattice - Fluid Theory, J. Appl. Polym. Sci., 80, 197 (2001).
Hildebrand, J.H. and Scott, R.L., Regular Solutions, Prentice-Hall, Englewood Cliffs, New York (1962).
Kaya, I., Ilter, Z. and Senol, D., Thermodynamic Interactions and Characterisation of Poly[(glycidyl methacrylate-co-methyl, ethyl, butyl) methacrylate] by Inverse Gas Chromatography, Polymer, 43, 6455 (2002).
Langer, S.H., Sheehan, R.J. and Huang, J.C., Gas - Chromatographic Study of the Solution Thermodynamics of Hydroxylic Derivates and Related Compounds, J. Phys. Chem., 86, 4605 (1982).
Letcher, T.M., Harris, R.A., Ramjugernath, D. and Raal, J.D., Activity Coefficients of Hydrocarbon Solutes at Infinite Dilution in Monoethanolamine from Gas – Liquid Chromatography, J. Chem. Thermodynamics, 33, 1655 (2001).
Letcher, T.M., Kozlowska, M.K. and Domanska-Zelazna, U., The Determination of Activity Coefficients at Infinite Dilution using G.L.C. for Hydrocarbons in Furfural at T=278.15 K and T=298.15 K, J. Chem. Thermodynamics, 36, 37 (2004).
Liu, Z., Zou, H.F., Ye, M.L., Ni, J.Y. and Zhang, Y.K., Effects of Organic Modifiers on Retention Mechanism and Selectivity in Micellar Electrokinetic Capillary Chromatography Studied by Linear Solvation Energy Relationships, J. Chromatogr. A, 863, 69 (1999).
Pena, M.A., Daali, Y., Barra, J. and Bustamante, P., Partial Solubility Parameters of Lactose, Mannitol and Saccharose using the Modified Extended Method and Evaporative Light Scattering Detection, Chem. Pharm. Bull., 48, 179 (2000).
Vega, A. and Coca, J., Activity Coefficients at Infinite Dilution Determined by Gas – Liquid Chromatography: Organic Solvents in Apiezon L, J. Chromatogr. A, 586, 303 (1991).
using Non-Steady - State Gas Chromatography, Ind. Eng. Chem. Res., 36, 803 (1997).
Voelkel, A. and Kopczynski, T., Inverse Gas Chromatography in the Examination of Organic Compounds: Polarity and Solubility Parameters of Isoquinoline Derivatives, J. Chromatogr. A,
795, 349 (1998).
![Figure 6: Estimation of the contributions to the solubility parameter at 80 ºC [alkanes ( ♦ ), alkenes ( o )] for different liquid phases: (a) Carbowax 400, (b) Carbowax 1500, (c) Carbowax 4000, (d) Amine 220](https://thumb-eu.123doks.com/thumbv2/123dok_br/18894406.425946/12.892.82.805.130.370/estimation-contributions-solubility-parameter-different-carbowax-carbowax-carbowax.webp)
