ISSN 0104-6632 Printed in Brazil
www.abeq.org.br/bjche
Vol. 27, No. 02, pp. 265 - 273, April - June, 2010
*To whom correspondence should be addressed
Brazilian Journal
of Chemical
Engineering
A NEW APPROACH TO CHARACTERIZE
SUSPENSIONS IN STIRRED VESSELS BASED ON
COMPUTATIONAL FLUID DYNAMICS
E. Cekinski
1,2*, M. Giulietti
3and M. M. Seckler
11
IPT, Institute for Technological Research of the State of São Paulo, Phone: + (55) (11) 3767-4484/ + (55) (11) 3767-4889, Fax: + (55) (11) 3767 4052, Av. Almeida Prado 532, 05508 901,
Butantã, Cidade Universitária, São Paulo - SP, Brasil. E-mail: [email protected]
2
Mauá Engineering School, Brazil. 3
Federal University of São Carlos, Brazil.
(Submitted: May 5, 2009 ; Revised: March 4, 2010 ; Accepted: March 16, 2010)
Abstract - Fluid dynamics simulations were applied for evaluating the suspension of particles in stirred vessels. The spatial distribution of particles throughout the vessel was characterized by a single parameter, here called the suspension quality (σ). Based on simulation results, a semi-empirical correlation was developed that correlated the suspension quality with the vessel geometry and solid and fluid properties, including a large variety of conditions, such as vessel and impeller diameters, impeller clearances, rotational speeds, particle densities and sizes. Comparison of the model with experimental data from the literature (Bohnet and Niesmak, 1980) suggests that the model can be extended to systems with different impeller geometries by adjustment of one single empirical parameter. The model can be used in the design of stirred vessels for the identification of the rotation speeds necessary to promote a specified suspension quality.
Keywords: Agitated vessel; Stirred tank; Solid suspension; Homogeneous suspension; Computational fluid dynamics.
INTRODUCTION
Two limiting situations can be distinguished for characterizing the distribution of solid particles dispersed in a liquid: just suspension and homogeneous suspension. The former occurs when the solid particles are in movement and no particle remains longer than 1 to 2 seconds at the bottom of the vessel. The latter is characterized by the uniform spatial distribution of the solid particles throughout the vessel. In practice, agitation systems operate between these two ideal situations, in conditions usually referred to as complete suspension. Complete suspension is important in industrial applications as diverse as suspension polymerization, dissolution, crystallization, extraction and in several catalytic processes.
Determination of conditions for just suspension is well documented, since it is simple to determine
experimentally and gives sufficient information for several industrial applications. The most common approach is to experimentally determine the rotational stirrer speed that promotes just suspension (Njs). The following classic empirical correlation has
been derived (Zwietering, 1958):
0,45 0,1 0,2 0,13
p L JS
0,85
S d g
N
D
⎛ Δρ⎞ ν ⎜ ⎟ Χ
ρ ⎝ ⎠
= (1)
Brazilian Journal of Chemical Engineering
For complete suspension, a correlation similar to Equation (1), which is valid for wide variety of suspension properties, vessel and impeller geometries, is not yet available. Earlier semi-empirical work is summarized in Table 1. In spite of this, much progress has been made in the understanding of the solids distribution throughout vessels. It is now established that computational fluid dynamics (CFD) provides a reasonably good description of complete suspension if an appropriate drag coefficient is considered. For example, it has been shown that drag models based on solids volume fraction are better than those based on Reynolds number only (Ochieng and Onyango, 2008). Such CFD models are most often based on the Euler/Euler approach with the k-e turbulence model (Spidla et al., 2005; Tamburini et al., 2009), but the Eulerian/Lagrangian approach has also been reported (Srinivasa and Jayanti, 2007). Models are often in 3 dimensions, but when the vessel geometry permits, a two dimensional symmetry may be applied (Khopkar et al., 2006). In some cases, solids distributions calculated by CFD are used as a basis to model other processes such as mixing (Ranade, 2009) and crystallization (Kougoulos et al., 2005; Woo et al., 2006) or to derive an optimal design of the impeller (Spogis and Nunhez, 2009). Advanced CFD techniques such as large eddy simulations and direct numerical simulations have also been explored to simulate turbulent mixing in stirred vessels, in order to gain insight into the details of local processes and transient flow conditions (Van den Akker, 2006). Recently, a detailed experimental study using radioactive particle tracking has shown the possibilities and limitations of both the Euler/Euler and the Large Eddy Simulation approaches for a vessel provided with a 6-blade Rusthon turbine (Guha et al., 2008).
Since CFD reasonably describes the solids distribution throughout mixing vessels, it may be applied for design or scale-up with respect to the degree of homogeneity of the suspension. In such
cases, new simulations have to be performed for each application, in order to determine the impeller rotation speed that provides a specified solids spatial distribution in a vessel-impeller of given geometry. The disadvantage of this procedure is that it is time consuming. Besides, it is cumbersome for seeking the optimal geometric configuration for a given task.
Therefore, attempts have been made to use CFD either in combination with theoretical arguments or empirical evidence in order to find trends of general value. For example, the scale up criterion "ND0.93 = constant", derived from a turbulence intermittency theory, was proposed for preserving the solids vertical distribution (Montante et al., 2008) for high aspect ratio vessels stirred by multiple impellers. In another contribution, an empirical correlation for the cloud height in baffled tanks provided with a hydrofoil propeller was suggested on the basis of the mixing features identified by CFD and experiments (Ochieng and Lewis, 2006). It has been suggested that a mean suspension height of 90% of the liquid level assures a uniform solids vertical distribution inside the cloud for pitched blade turbines (Angst and Kraume, 2006).
In the present work, we have used CFD to describe the suspension of particles in water. The simulated spatial distribution of solids was characterized by a single parameter, here called the suspension quality. Based on simulations for particles of different density and size in vessels of various geometries and scales, a semi-empirical correlation was developed for predicting the suspension quality. Since literature data is mostly concerned with 45o pitched blades and Rushton turbines, flat blade impellers were studied. Such impellers are commonly encountered when the stirring must both suspend the solids and provide a high shear rate, such as in processes for solids dissolution, solid-liquid reactions, particle dispersion and deaggregation. The proposed correlation was validated with literature experimental data (Bohnet and Niesmak, 1980).
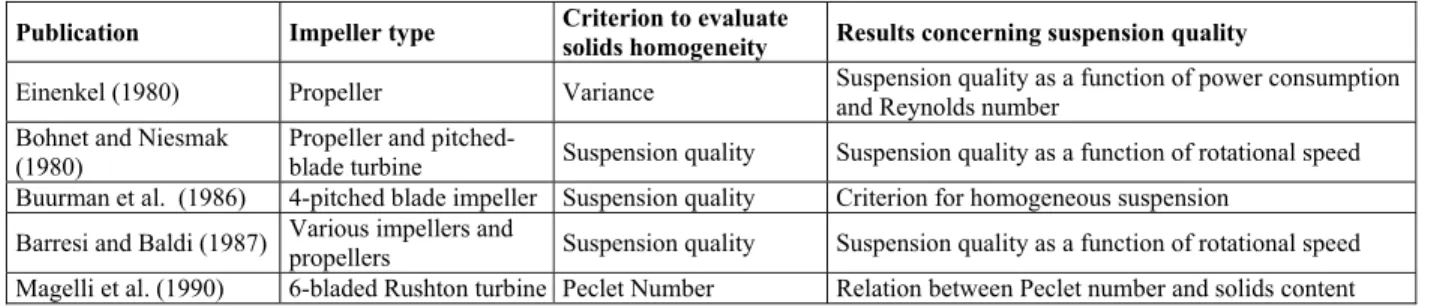
Table 1: Early work on solid distribution in stirred tanks
Publication Impeller type Criterion to evaluate
solids homogeneity Results concerning suspension quality
Einenkel (1980) Propeller Variance Suspension quality as a function of power consumption
and Reynolds number Bohnet and Niesmak
(1980)
Propeller and
pitched-blade turbine Suspension quality Suspension quality as a function of rotational speed Buurman et al. (1986) 4-pitched blade impeller Suspension quality Criterion for homogeneous suspension
Barresi and Baldi (1987) Various impellers and
Brazilian Journal of Chemical Engineering Vol. 27, No. 02, pp. 265 - 273, April - June, 2010
PROCEDURE
The operation of solid-liquid vessels at steady state in the turbulent flow regime was considered. The vessel was filled with water and particles of uniform size and density. Stirring took place in a vertical cylindrical vessel by means of the rotation of a single impeller agitator axisymetrically mounted. The volumetric fraction of solids in the suspension was 5 vol%. Particle sizes were 10, 50, 100 and 500
μm. Particles densities were 1375 kg/m3 and 2650 kg/m3, representing, respectively, a polymeric resin and sand.
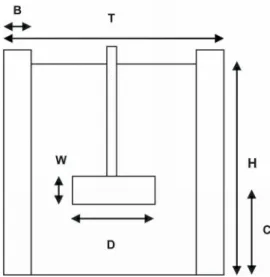
The stirred vessel dimensions are shown in Figure 1. The vessel was provided with a two-bladed flat impeller and 4 baffles spaced from each other at angles of 90o. Both blade width and baffle width corresponded to 10% of the vessel diameter. The liquid height had the same value as the vessel diameter. The simulations were performed in vessels with diameters of 1 m and 5 m, rotational speeds of 20, 34, 45 and 100 rpm. The D/T and C/T ratios investigated assumed the values of 1/4, 1/3 and 1/2.
Figure 1: Main dimensions of stirred vessel. T = tank
diameter; D = impeller diameter; C = clearance; W = impeller width; B = baffle width; H = liquid height.
The computations were conducted in Fluent version 4.5 in combination with the software MixSim version 1.7. Particles were treated as a single phase, shear forces within the particle and between solid and liquid phase were considered. The liquid surface was assumed to be flat. The k-ε turbulence model was used. The velocity profiles in the fluid adjacent to the agitator blades were obtained from three-dimensional single phase
simulations (not shown). Two-phase simulations were conducted in a two-dimensional model due to limitations in the time needed for computations. For the 3D simulations of the vessel with 1 m in diameter, 80.000 computational cells were used. Mesh-independency was assured by repeating a simulation using 220.000 cells. For the 3D simulations with the 5 m vessel the number of cells was 400.000. The 2D simulations of the 1 m and the 5 m vessels were performed, respectively, with 2000 and 5000 computational cells.
Simulation results included the time averaged spatial distribution of the solids content, the energy dissipation, as well as the liquid and solid phase velocities (not shown).
Characterization of the Suspension Quality
The degree of homogeneity of the suspension was assessed through the ratio of the standard deviation to the mean of the particles volumetric fraction, defined by Equation (2) below:
2 n
M 1
1 c
1
n c
⎛ ⎞ σ = ⎜ − ⎟ ⎝ ⎠
∑
(2)The variable σ is called here the suspension quality. For a perfectly homogeneous distribution of particles throughout the vessel, the local and the
mean concentrations, c and cM, are identical
Brazilian Journal of Chemical Engineering
Table 2: Characterization of the degree of
homogeneity in terms of the suspension quality (σ).
σ Suspension quality
> 0.8 Portions of the solids settle at the bottom of the vessel
0.25 – 0.8 Complete suspension, with variable degree of homogeneity
< 0.25 Proximity to homogeneous suspension
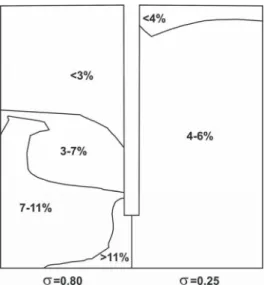
In order to illustrate how the chosen limiting values for σ translate into the spatial distribution of particles throughout the mixing vessel, two simulation cases are shown in Figure 2 for a mean volumetric solids content of 5%. The right section of the figure shows the solids content distribution for σ close to the limiting value of 0.25. About 95% of the vessel volume assumes a concentration close to the desired mean value and the remaining 5% has very low solids content. The left section of the figure shows the solids distribution for a suspension quality of about 0.8: only a small fraction of the vessel has solids contents around the desired mean value of 5%. A condition of extremely poor mixing (not shown), with most particles settled at the bottom, resulted in a
σ value of 2.8.
EDITORIAL QUERY: inside the figure, change 0,80 and 0,25 in this figure to 0.80 and 0.25 (decimal point, not comma)
Figure 2: Spatial distribution of solids content (in
volume % units) in stirred vessels for two simulation cases with suspension qualities of 0.8 (left) and 0.25 (right). The mean solids content in both cases is 5%.
For each simulation the degree of homogeneity was therefore assessed by the suspension quality σ
as defined above. In total, 94 simulations were performed.
RESULTS AND DISCUSSION
Influence of the Particle Size
Figure 3 shows the suspension quality σ as a function of the particle size for several vessel geometries. As expected, the degree of homogeneity decreases (i.e., σ increases) with particle size, due to the increased gravity action with size. It is also noteworthy that the vessel geometry (D/T and C/T) plays an important role in determining suspension quality. Only for very small particles, where the mixer is likely to be overdimensioned, does the suspension quality become insensitive to the vessel geometry.
Influence of the Impeller Diameter
For both types of particles, sand and resin, the best suspension qualities (lowest σ values) were achieved for the largest impeller diameters, as shown in Figure 4. This may be attributed to the strong influence of D/T on the energy input to the mixer, as shown in Table 3.
Influence of the Clearance
Brazilian Journal of Chemical Engineering Vol. 27, No. 02, pp. 265 - 273, April - June, 2010 0.0 0.2 0.4 0.6 0.8 1.0
0 20 40 60 80 100 120
su sp en si o n q u al it y
particle size (μm)
1/4 1/4 1/4 1/3 1/3 1/4 1/3 1/3 1/2 1/4 1/2 1/3 D/T C/T
resin 1/4 1/4
1/4 1/3
1/3 1/4
1/3 1/3
1/2 1/4
1/2 1/3 D/T C/T
0.0 0.2 0.4 0.6 0.8 1.0
0 20 40 60 80 100 120
su sp en si o n q u al it y
particle size (μm)
1/4 1/4 1/4 1/3 1/3 1/4 1/3 1/3 1/2 1/4 1/2 1/3 D/T C/T
resin 1/4 1/4
1/4 1/3
1/3 1/4
1/3 1/3
1/2 1/4
1/2 1/3 D/T C/T
1/4 1/4 1/4 1/3 1/3 1/4 1/3 1/3 1/2 1/4 1/2 1/3 D/T C/T
0.0 0.2 0.4 0.6 0.8 1.0 1.2 1.4 1.6 1.8 2.0 2.2
0 20 40 60 80 100 120
s u sp en si o n q u al it y
particle size (μm)
1/4 1/4 1/4 1/3 1/3 1/4 1/3 1/3 1/2 1/4 1/2 1/3 1/2 1/2 D/T C/T sand
Figure 3: Suspension quality versus particle size for simulations with resin (upper figure) and sand particles
(lower figure). Tank diameter T = 1m and rotation speed N = 100 rpm.
0.0 0.2 0.4 0.6 0.8 1.0 1.2 1.4 1.6
0.2 0.3 0.4 0.5 0.6
su s p en si o n q u al it y D/T sand resin C/T=1/4 0.0 0.2 0.4 0.6 0.8 1.0 1.2 1.4 1.6 sus p ens io n qu al it y
0.2 0.3 0.4 0.5 0.6
D/T sand resin C/T=1/4 0.0 0.2 0.4 0.6 0.8 1.0 1.2 1.4 1.6
0.2 0.3 0.4 0.5 0.6
su s p en si o n q u al it y D/T sand resin C/T=1/4 0.0 0.2 0.4 0.6 0.8 1.0 1.2 1.4 1.6 sus p ens io n qu al it y
0.2 0.3 0.4 0.5 0.6
D/T sand resin C/T=1/4 0.0 0.2 0.4 0.6 0.8 1.0 1.2 1.4 1.6 sus p ens io n qu al it y 0.0 0.2 0.4 0.6 0.8 1.0 1.2 1.4 1.6 sus p ens io n qu al it y
0.2 0.3 0.4 0.5 0.6
D/T
0.2 0.3 0.4 0.5 0.6
D/T sand resin C/T=1/4 sand resin C/T=1/4 0.0 0.2 0.4 0.6 0.8 1.0 1.2 1.4 1.6
0.2 0.3 0.4 0.5 0.6
s u s p e n s ion qua lit y D/T sand resin C/T=1/3 0.0 0.2 0.4 0.6 0.8 1.0 1.2 1.4 1.6 s u sp ens io n qu al it y
0.2 0.3 0.4 0.5 0.6
D/T sand resin C/T=1/3 0.0 0.2 0.4 0.6 0.8 1.0 1.2 1.4 1.6
0.2 0.3 0.4 0.5 0.6
s u s p e n s ion qua lit y D/T sand resin C/T=1/3 0.0 0.2 0.4 0.6 0.8 1.0 1.2 1.4 1.6 s u sp ens io n qu al it y
0.2 0.3 0.4 0.5 0.6
D/T sand resin C/T=1/3 0.0 0.2 0.4 0.6 0.8 1.0 1.2 1.4 1.6 s u sp ens io n qu al it y 0.0 0.2 0.4 0.6 0.8 1.0 1.2 1.4 1.6 s u sp ens io n qu al it y
0.2 0.3 0.4 0.5 0.6
D/T
0.2 0.3 0.4 0.5 0.6
D/T sand resin C/T=1/3 sand resin C/T=1/3 0.0 0.2 0.4 0.6 0.8 1.0 1.2 1.4 1.6
0.2 0.3 0.4 0.5 0.6
su sp en si o n q u al it y D/T sand resin C/T=1/2 0.0 0.2 0.4 0.6 0.8 1.0 1.2 1.4 1.6 susp ens io n qu al it y
0.2 0.3 0.4 0.5 0.6
D/T sand resin C/T=1/2 0.0 0.2 0.4 0.6 0.8 1.0 1.2 1.4 1.6
0.2 0.3 0.4 0.5 0.6
su sp en si o n q u al it y D/T sand resin C/T=1/2 0.0 0.2 0.4 0.6 0.8 1.0 1.2 1.4 1.6 susp ens io n qu al it y
0.2 0.3 0.4 0.5 0.6
D/T sand resin C/T=1/2 0.0 0.2 0.4 0.6 0.8 1.0 1.2 1.4 1.6 susp ens io n qu al it y 0.0 0.2 0.4 0.6 0.8 1.0 1.2 1.4 1.6 susp ens io n qu al it y
0.2 0.3 0.4 0.5 0.6
D/T
0.2 0.3 0.4 0.5 0.6
D/T sand resin C/T=1/2 sand resin C/T=1/2
Figure 4: Influence of impeller diameter and clearance on the suspension quality (dp = 50 μm).
Tank diameter T = 1m and rotation speed N = 100 rpm.
Table 3: Energy dissipation as a function of impeller diameter D and clearance C in the mixing tank. For the sake of comparison, the highest values of energy dissipation in single phase flow fields are shown.
D/T (-)
C/T (-)
Highest energy dissipation (W/kg)
1/4 1/4 0.072
1/3 1/4 0.236
1/2 1/4 1.132
1/4 1/3 0.080
1/3 1/3 0.311
1/2 1/3 1.117
1/4 1/2 0.090
1/3 1/2 0.171
Brazilian Journal of Chemical Engineering
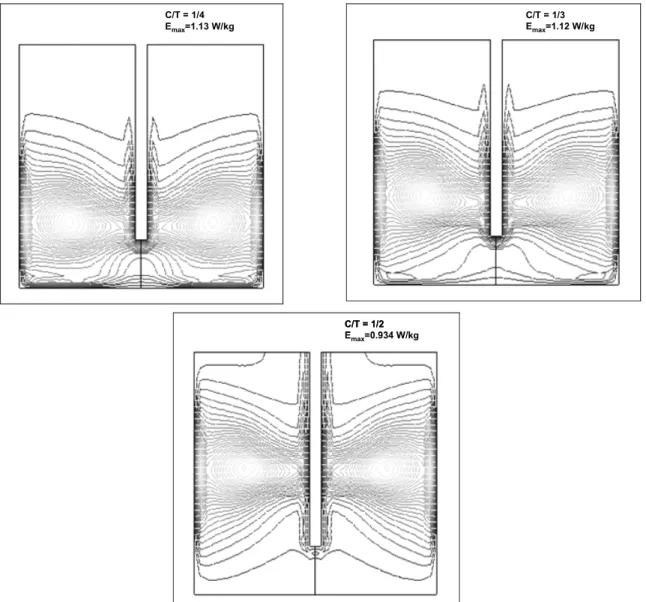
C/T = 1/4 Emax=1.13 W/kg C/T = 1/4 Emax=1.13 W/kg
C/T = 1/3 Emax=1.12 W/kg C/T = 1/3 Emax=1.12 W/kg
C/T = 1/2 Emax=0.934 W/kg C/T = 1/2 Emax=0.934 W/kg
Figure 5: Spatial distribution of the energy dissipated (E) into the fluid for D/T =1/2, T = 1m. Lighter lines
indicate higher values of E. The highest value of E, Emax, in the vessel as well as the C/T value are indicated in
the upper right corner of the figures.
A Mathematical Model for Particles Suspension
A mathematical model based on dimensionless parameters is sought that correlates the simulated σ values to the mixing conditions, solids and fluid properties. Possible dimensionless parameters for such a correlation are taken from previous work on theories for stirred vessels in the just suspended condition (Musil and Vlk, 1978; Wichterle, 1988; Rieger and Ditl, 1994; Rieger, 2000; Murugesan, 2001; Rieger, 2002). Such theories often predict that the suspension of particles in stirred vessels depends on certain dimensionless numbers, such as the Froude number (Fr’), the modified Froude number (Fr*), the Archimedes number (Ar), the Reynolds number (Re), the particle Reynolds number, as well
as other dimensionless ratios such as dp/T, D/dp,
CD2/T3, ρL/ Δρ, D/T and the solids content, with the
following definitions:
(
2)
(
)
L
*
p 2
L L
3 2
p L L
Fr N D / g /
D
Fr Fr
d
Re N D /
Ar d g /
′ = ⋅ ρ Δρ
⎛ ⎞ ′ = ⋅⎜⎜ ⎟⎟
⎝ ⎠ = ⋅ ⋅ρ μ = ⋅ ρ Δρ μ
(3)
Brazilian Journal of Chemical Engineering Vol. 27, No. 02, pp. 265 - 273, April - June, 2010
1 2
a a 0 1 2 a
σ = ⋅ π ⋅ π ⋅… (4)
where π1, π2,… are dimensionless variables and a0,
a1,… are model parameters that minimize the
difference between model-derived values of the suspension quality (σcalc) and values determined by
CFD simulations (σsim). Minimization was achieved
by linearization of Equation (4) (by taking the natural logarithm of both sides of the equation), followed by multilinear regression.
Several different combinations of dimensionless variables were investigated. A suitable correlation was selected based on three criteria. First, the model should fit well to CFD simulations. Second, the model parameters should be consistent, that is, the model should correctly predict trends for all variables (for instance, a model that predicts that a higher density leads to a better degree of homogeneity is rejected). Third, the model should be simple, that is, excessive or redundant dimensionless numbers are avoided. A correlation that fulfills these criteria is
0.446 0.132 0.382
0 p
a Fr′− Ar (d / T)
σ = ⋅ ⋅ ⋅ (5)
with a0 = 6.127. The coefficient of correlation
(multiple R) for the natural logarithm-based linearized correlation between σsim and σcalc is 0.81
when the 94 CFD simulations are considered.
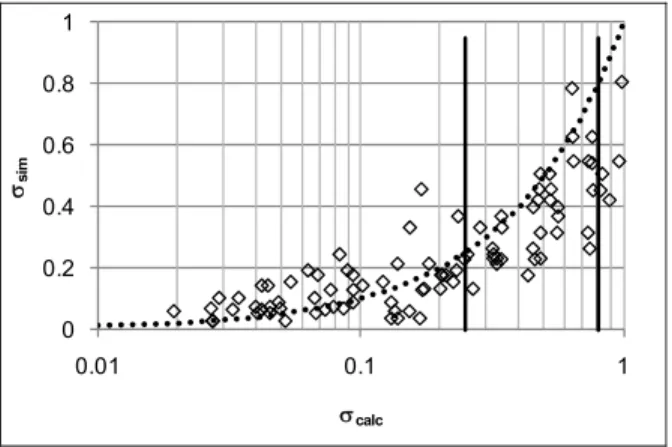
In Figure 6 values of the suspension quality determined with this correlation (σcalc) are plotted
against our simulation data (σsim). The dotted line
gives the σsim = σcalc condition. The correlation
reasonably predicts the suspension quality for the whole range of stirring conditions investigated.
Model Validation with Experimental Data
So far we have shown how CFD modeling can be applied to support the development of a mathematical model for particle suspension over a wide range of conditions. In order to validate this procedure, the proposed correlation was applied to laboratory scale experimental data obtained from the literature (Bohnet and Niesmak, 1980).
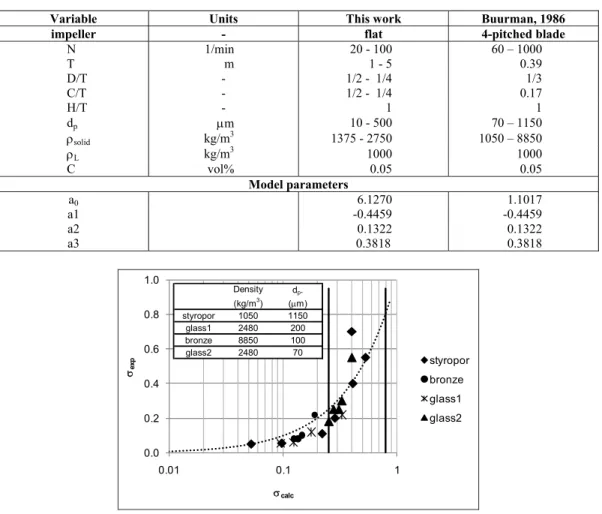
The model did not match the experimental data, as expected, because of the different range of conditions in the experiments and in our simulations, particularly the impeller type and particle densities and sizes, as given in Table 4. However, fitting was easily obtained, as shown in Figure 7, by adjusting the pre-exponential term a0 of the correlation
(Equation (5)), while keeping unchanged the dimensionless parameters and their powers:
0.446 0.132 0.382
0 p
a Fr′− Ar (d / T)
σ = ⋅ ⋅ ⋅ (6)
with a0 = 1.102. This result indicates that the model
represented by Equations (5) or (6) can be extended to systems with different impeller types and particle and fluid properties by the mere adjustment of the pre-exponential parameter a0.
0 0.2 0.4 0.6 0.8 1
0.01 0.1 1
σsim
σcalc
Figure 6: Suspension quality obtained by CFD simulations σsim (markers) versus values calculated with the
correlation of Eq. (5), σcalc. The dotted line represents the σsim = σcalc condition. The vertical lines indicate the
Brazilian Journal of Chemical Engineering
Table 4: Range of validity for the correlations developed for CFD simulations in this work and for laboratory scale data of Buurman, 1986.
Variable Units This work Buurman, 1986
impeller - flat 4-pitched blade
N 1/min 20 - 100 60 – 1000
T m 1 - 5 0.39
D/T - 1/2 - 1/4 1/3
C/T - 1/2 - 1/4 0.17
H/T - 1 1
dp μm 10 - 500 70 – 1150
ρsolid kg/m3 1375 - 2750 1050 – 8850
ρL kg/m
3
1000 1000 C vol% 0.05 0.05
Model parameters
a0 6.1270 1.1017
a1 -0.4459 -0.4459
a2 0.1322 0.1322
a3 0.3818 0.3818
0.0 0.2 0.4 0.6 0.8 1.0
0.01 0.1 1
σexp
σcalc
styropor
bronze
glass1
glass2
Density dp.
(kg/m3) (μm)
styropor 1050 1150
glass1 2480 200
bronze 8850 100
glass2 2480 70
Figure 7: Suspension quality obtained experimentally by Bohnet and Niesmak (1980)versus calculated values
with the correlation of Eq. (7). The dotted line represents the correlation outputs, and symbols the experimental values. The vertical lines indicate the limits for complete suspension (0.25 < σcalc < 0.80) and homogeneous
suspension (0 < σcalc < 0.25).
Design of Solid-Liquid Mixers with Respect to Suspension Quality
Equations (5) and (6) can be rearranged into a more suitable form for the process designer. Isolating Fr’ in the equation, one gets:
0,446 0.296 0.856
0 p
Fr′ =a ⋅σ− ⋅Ar ⋅(d / T) (7)
where a0 = 2.244 for the simulations with a flat blade
impeller and a0 = 1.044 for the experiments with a
pitched blade turbine. For given vessel geometry and particle and fluid properties, the appropriate value of suspension quality σ is chosen, depending
on whether homogeneous suspension (σ = 0.25) or complete suspension (σ = 0.8) is desired. Using the chosen value of σ in Equation (7), the Froude number Fr’ is calculated. From this quantity the required rotation speed corresponding to the chosen suspension quality is derived.
CONCLUSIONS
Brazilian Journal of Chemical Engineering Vol. 27, No. 02, pp. 265 - 273, April - June, 2010
and fluid properties for a large variety of conditions, such as vessel and impeller diameters, impeller clearances, rotational speeds, particle densities and sizes. By adjusting one single parameter, the model fit to experimental data of Bohnet and Niesmak (1980), indicating that the model structure is suitable for describing systems with different impeller types and materials properties. The model can be used in the design of stirred vessels for identification of the rotation speeds necessary to promote a specified suspension quality.
ACKNOWLEDGEMENT
The authors would like to thank The State of São Paulo Research Foundation (FAPESP) and the National Council for Scientific and Technological Development (CNPq) for the financial support to this study.
NOMENCLATURE
B baffle width m
C clearance m
c solids volumetric fraction m3/m3
mixture cAV mean solids volumetric
fraction
m3/m3 mixture
D impeller diameter m
dp particle size m
Fr* modified Froude Number (-)
g gravitational constant m/s2
H vessel height m
N stirrer rotational speed 1/s
NJS minimum rotational speed 1/s
Pe Péclet Number for the solid (-)
S geometric constant (-)
T vessel diameter m
W impeller width m
X weight of solid per weight of liquid
kg/100 kg
Greek Letters
ν kinematic viscosity m2/s
σ suspension quality (-)
ρ particle density kg/m3
ρL liquid density kg/m
3
REFERENCES
Angst, R. and Kraume, M., Experimental investigations of stirred solid/liquid systems in three different scales: Particle distribution and power consumption. Chemical Engineering Science, 61, 2864 (2006).
Bohnet, M. and Niesmak, G., Distribution of solids in stirred suspensions. Ger. Chem. Eng., 3, 57 (1980).
Murugesan, T., Critical impeller speed for solid suspension in mechanically agitated contactors. Journal of Chemical Engineering of Japan, 34, 423 (2001).
Musil, L. and Vlk, J., Suspending solid particles in an agitated conical-bottom tank. Chemical Engineering Science, 33, 1123 (1978).
Ochieng, A. and Lewis, A. E., CFD simulation of solids off-bottom suspension and cloud height. Hydrometallurgy, 82, 1 (2006).
Ochieng, A. and Onyango, M. S., Drag models, solids concentration and velocity distribution in a stirred tank. Powder Technology, 181, 1 (2008). Ranade, V. V., CFD simulation of liquid-phase
mixing in solid-liquid stirred reactor. Chemical Engineering Science, 64, 2273 (2009).
Rieger, F., Effect of particle content on agitator speed for off-bottom suspension. Chemical Engineering Journal (Lausanne), 79, 171 (2000). Rieger, F., Effect of particle content on agitator
speed for off-bottom suspension. Chemical Engineering and Processing, 41, 381 (2002). Rieger, F. and Ditl, P., Suspension of solid particles.
Chemical Engineering Science, 49. 2219 (1994). Spogis, N. and Nunhez, J. R., Design of a
high-efficiency hydrofoil through the use of computational fluid dynamics and multiobjective optimization. AIChE Journal, 55, 1723 (2009). Srinivasa, T. and Jayanti, S., An eulerian/lagrangian
study of solid suspension in stirred tanks. AIChE Journal, 53, 2461 (2007).
Van den Akker, H. E. A., The details of turbulent mixing process and their simulation. Adv. Chem. Eng., 31, 151 (2006).
Wichterle, K., Conditions for suspension of solids in agitated vessels. Chemical Engineering Science, 43, 467 (1988).