ISSN 0104-6632 Printed in Brazil
www.abeq.org.br/bjche
Vol. 27, No. 02, pp. 253 - 264, April - June, 2010
Brazilian Journal
of Chemical
Engineering
CHARACTERIZATION OF GAS-LIQUID
PARAMETERS IN A DOWN-FLOW JET LOOP
BUBBLE COLUMN
Ajay Mandal
Department of Petroleum Engineering, Indian School of Mines, Fax: 91-3262296632, Dhanbad-826004, India.
E-mail: [email protected]
(Submitted: July 24, 2009 ; Revised: February 19, 2010 ; Accepted: March 18, 2010)
Abstract - In order to characterize the gas-liquid parameters of a down-flow jet loop reactor, experiments were carried out to study the gas holdup, bubble sizes and their distribution, mass transfer area and mass transfer coefficient. The experiments were performed in the bubbly flow regime because of its stability and uniformity. Analysis of experimental data showed an unambiguous relationship between gas holdup, bubble size, bubble size distribution and interfacial area. It has also been found that gas holdup and interfacial area is a strong function of slip velocity. The variation of interfacial area and mass transfer coefficient were also analyzed and expressed as a function of operational and geometric parameters.
Keywords: Bubble column; Down-flow; Bubble size; Interfacial area; Mass transfer coefficient.
INTRODUCTION
Because of simple construction and low operating costs, bubble columns are widely used in various fields, which include petrochemical, chemical, biochemical and pharmaceutical industries, and water pollution abatement. Although numerous studies have been devoted to the fundamental understanding of complex behavior in bubble column reactors, their design and scale-up mostly relies on semi-empirical relations.
Studies on the two-phase co-current jet loop bubble column have gained considerable importance in recent years, in view of its inherent advantages, viz., finer and uniform bubble size, negligible coalescence of bubbles, homogenization of the phases, higher residence time of the gas bubbles and efficient dispersion of a very small amount of gas in a large amount of liquid. A literature review reveals that studies on the dispersion of gas in two-phase downflow have been carried out either with plunging jet or with sparger type systems. In a sparger type
system, the gas sparger is fixed at the top of the column. Liquid with high velocity is forced through the column and, as it moves, it shears the gas from the sparger in the form of bubbles(Shah et al., 1983; Kulkarni and Shah, 1984). The concept of plunging jet in a downflow column comes from the studies of gas entrainment and dispersion by a liquid jet impinging into a pool of liquid (Van de Sande and Smith, 1973; McKeogh and Ervine, 1981). However, this offers poor gas-liquid contacts due to lower residence time of the gas bubbles. Therefore, studies have concentrated on attempts to increase the gas-liquid contact time. Higher gas-gas-liquid contact can be obtained by increasing bubble penetration, but it requires enough downward liquid flow to overcome the buoyant force of the bubbles produced by the liquid jet. In another way, a higher residence time of the entrained bubbles can be obtained by plunging a vertical liquid jet in a vertical column (Ohkawa et al., 1986; Bando et al., 1988; Yamagiwa et al.,
1990). Milenković et al. (2007) reported the
254 Ajay Mandal
Brazilian Journal of Chemical Engineering
turbulent, periodically-excited, as well as naturally-developing bubbly jets and the interactions between bubbles and large-scale vortices.
In a plunging jet system having a downcomer, the liquid jet coming out through the nozzle directly impinges into the liquid inside the downflow contactor and forms an intense mixing zone, where the entrained gas breaks into fine bubbles by shearing forces of the jet. The gas and liquid then flow cocurrently down the column where they are discharged at the bottom. As the gas bubbles are forced to move downward against their upward buoyant force, the bubbles spend more time in the column compared to an upflow system.
The performance of a jet loop bubble column is best characterized by the available gas-liquid interfacial area (a), especially in the regime in which absorption is accompanied by a fast chemical reaction. Again, for gas-liquid processes that take place in the absorption regime with slow reaction, the mass transfer properties can be characterized by the volumetric mass transfer coefficient (kLa). Thus, a precise knowledge of available
gas-liquid interfacial area and volumetric mass transfer coefficient is very important for designing and scaling up a gas-liquid reactor. Efficient gas dispersion in a cocurrent downflow bubble column with ejector type gas distributor leads to an enhanced mass transfer. Investigations on mass transfer in bubble columns with liquid driven ejectors have been reported by several authors. Atkinson et al. (2003) studied the bubble size distribution and energy dissipation rate measured in a plunging liquid jet bubble column. They predicted the maximum stable bubble diameter in the mixing zone based on Weber number analysis. Uchiyama et al. (2008) reported the gas holdup distribution in a gas bubble dispersed phase generated by an impinging gas– liquid two-phase jet measured with an optical fiber void probe. They also studied the effects of structural factors of nozzle and column diameter on gas holdup distribution. Huynh et al. (1991) studied mass transfer characteristics in an upward Venturi/bubble column combination. They reported that gas holdup was increased by 50% to 150% and the overall volumetric mass transfer coefficient was tripled when Venturi was used as “gas distributor” instead of a porous distributor. Manish and Majumder (2009) investigated the quality of mixing in a modified downflow bubble column, which they analyzed by using information entropy theory. They also developed empirical models for a downflow system based on parameters that affect the quality of mixing and mass transfer efficiency.
Havelka et al. (2000) measured the volumetric liquid-side mass transfer coefficient in the cocurrent ejector-distributor bubble column. Significant works have also been done on mass transfer in downflow
system with efficient dispersion, e.g., liquid jet ejector (Dutta and Raghavan, 1987), Venturi-bubble column (Briens et al., 1992) and plunging jet bubble column (Evans et al., 2001). However, comparison of these different systems is difficult, because of their different ejector-contactor configurations and operating ranges of liquid and gas flow rates.
The present paper deals with the performance characteristics of a jet loop bubble column, with special emphasis on gas entrainment, gas holdup, bubble sizes, interfacial area and mass transfer coefficient. The novelty of the system is that no extra energy is required for gas dispersion and gas holdup is significantly high. The experimental results are analyzed and elucidated as a function of operational and geometric parameters.
EXPERIMENTAL
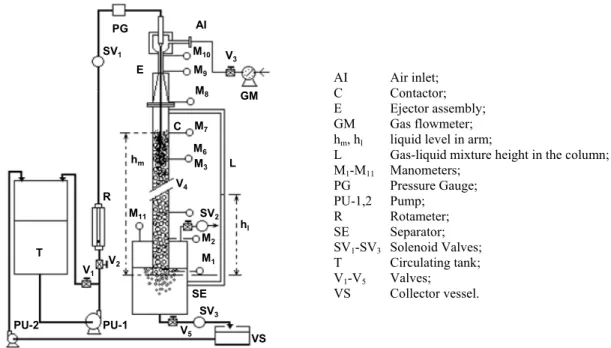
A detailed experimental set up for the ejector induced downflow system is shown in Fig. 1. It consists of an ejector assembly, an extended pipeline contactor, a gas liquid separator, and other accessories. The ejector assembly and extended contactor are made of transparent Perspex for visual observation of the flow and mixing patterns. The inside diameter of the column is 51.6 mm and length of the column is 1.5 m. A high velocity liquid jet is produced through the nozzle of the ejector system, which entrains air along with it. The liquid jet with surrounding air plunges at the top of the column, forming fines bubbles, which are moved downward by the higher momentum of the liquid jet prevailing over the upward buoyancy forces of the bubbles. The column is then filled with gas-liquid mixture by proper adjustment of pressure and liquid level inside
the separator through the valves V4 and V5,
AI Air inlet; C Contactor; E Ejector assembly; GM Gas flowmeter; hm, hl liquid level in arm;
L Gas-liquid mixture height in the column; M1-M11 Manometers;
PG Pressure Gauge; PU-1,2 Pump;
R Rotameter; SE Separator; SV1-SV3 Solenoid Valves;
T Circulating tank; V1-V5 Valves;
V4
M3
C
VS PU-1
SE M1
M2
M6
M8
M9
M10
M7
M11
V3
V1
V2
E
GM AI
PG SV1
T
R hm
SV2
SV3
V5
PU-2
L
hl
V4
M3
C
VS PU-1
SE M1
M2
M6
M8
M9
M10
M7
M11
V3
V1
V2
E
GM AI
PG SV1
T
R hm
SV2
SV3
V5
PU-2
L
hl
VS Collector vessel.
Figure 1: Schematic diagram of the experimental set-up
Gas Hold-Up
Gas holdup for the present system has been measured by the “flow isolating technique” as reported in the literature (Watson and Grainger-Allen, 1974; Kundu et al., 1995). When a steady state condition of the system is attained, the total height of the gas-liquid mixture in the column is noted. Then the three solenoid valves, SV1, SV2 and
SV3 (Fig. 1) are switched off simultaneously. This
causes an immediate termination of flow of both the fluids. The liquid gas mixture inside the column gets arrested and is allowed to settle for some time, whereby all gases get separated. The clear liquid height inside the column is then noted. The difference between the gas liquid mixing height (hm)
and the corresponding clear liquid height (hl) gives
the holdup of gas in the column. Thus, the average gas holdup can be represented as:
m l
g m
h h
h −
ε = (1)
Bubble Size
Bubble sizes are measured by a photographic method (Schafer et al., 2002). The column is surrounded by a 150 mm×150 mm clear Perspex jacket with flat surfaces and the gap between the column and the jacket is filled with distilled water. This arrangement is made to avoid the optical
distortions caused by the curved surface of the Perspex column. The rear part of the column is illuminated by a 500 W halogen lamp and the opposite wall is covered with a diffusion screen to avoid undesired reflections and refractions as much as possible. Then images are taken at different heights of the bubbly flow zone under different operating conditions in the column with a high-speed digital camera. Good quality images are then analysed by image processing software (Olympus Microsuite [TM] Basic) to obtain the bubble sizes. More than 100 bubbles are considered in each experimental condition to obtain the size distribution.
Interfacial Area
Interfacial area can be obtained both by physical and chemical methods. The chemical method of interfacial area determination is based on gas absorption followed by chemical reaction. In general, when physical absorption is followed by a chemical reaction, the overall rate is governed by both the physical rate of absorption and the kinetics of the reaction. Brian (1964) has discussed the theory of absorption followed by a chemical reaction of general order. The liquid phase reaction between dissolved carbon dioxide and sodium hydroxide satisfies the condition for a pseudo-first order reaction at certain alkali concentrations and was therefore selected for the present study. This reaction is said to take place as,
256 Ajay Mandal
Brazilian Journal of Chemical Engineering
HCO3− + OH−→ CO3−2 + H2O (3)
Since the second reaction is ionic, it takes place at a much faster rate than the first one; therefore, the first reaction step is rate controlling. The second order rate constant, k2, was determined by the
equation suggested by Porter et al. (1966). If the concentration of OH−remains essentially constant in the bulk of the solution, the equation becomes pseudo-first order. The condition to be satisfied for this is given by the following condition (Danckwerts, 1970),
1
o 2
A 2 B
2 L D k C
k
⎡ ⎤
⎢ ⎥
⎣ ⎦ << 1+
o B
* A C
2C (4)
DA, the diffusivity of carbon dioxide in aqueous
solutions was obtained from the equation reported by Nijsing et al. (1959)], It has been shown by Sharma and Danckwerts (1970) that the specific rate of absorption per unit area for a second order reaction satisfying the condition of Equation (4) is,
* o 2
A A 2 B L
R=C D k C +k (5)
If further,
1
o 2
A 2 B
2 L D k C
k
⎡ ⎤
⎢ ⎥
⎣ ⎦ > 3 , (6)
the second term within the square root of Equation (5) becomes small compare to the first term and, therefore, the specific rate is given by the simplified Equation (7),
* o *
A A 2 B A LR
R=C D k C =C k (7)
When the conditions given by Eqs. (4) and (6) are satisfied, the rate of absorption will be a function of the physical-chemical factors and will be independent of the hydrodynamic conditions in the system.
If further the gas phase resistance can be neglected, the concentration of carbon dioxide at the interface, C , is related to its partial pressure in the *A gas phase by,
* *
A e A A
p =H C =p =yP′ (8)
There are some experimental evidences in the literature (Porter et al., 1966; Voyer and Miller,
1968) to suggest that gas phase resistance does not exceed about 10 percent of total resistance and can be neglected. Therefore, following the method suggested by Voyer and Miller (1968), one can write the rate of absorption in a differential volume dv ,
* A LR
Radv=aC k dv (9)
From a material balance equation on a solute free basis, one can derive (Mandal, 2003) the following expression for interfacial area:
e o i
LR o i i o
G H 1 y y 1 1
a ln
k P V y 1 y 1 y 1 y
⎡ ⎤ ⎡ ⎤
′ −
= ⎢ ⎥ ⎢+ − ⎥
′ ⎣ − ⎦ ⎣ − − ⎦ (10)
Eq. (10) can be used to determine the specific interfacial area, provided the conditions for the pseudo-first order reaction are satisfied. Experimental results for the present system were found to satisfy the conditions for “fast pseudo-first order reaction” as given by Eqs. (4) & (6). The values of specific interfacial area were obtained by using Eq. (10) with knowledge of DA, k2 and He
together with the data of inlet and outlet concentration of carbon dioxide, volume of gas-liquid mixture in the column and gas flow rate. The Henry’s law constant, He, in ionic solution was
directly obtained from solubility, S. The diffusivity of carbon dioxide in aqueous solution, DA, was
calculated from equations suggested by Nijshing et al. (1959), while the second-order reaction rate
constant, k2, was determined by the equation
suggested by Porter et al. (1966).
Liquid-Side Volumetric Mass Transfer Coefficient
Similar to interfacial area, experimental measurements of volumetric mass transfer coefficient are also categorized as physical and chemical methods. Measurements taken in the absence of simultaneous chemical reaction are commonly used to determine the volumetric mass transfer coefficients in bubble columns. Investigations involve the purely physical mass transfer between the gas and the liquid phase. Oxygen is used as the exchange gas in the majority of the studies, as its partial pressure in the liquid phase is easy to determine electrochemically using polarographic electrodes. Van de Sande and Smith (1975), Bin and Smith (1982) have used the above method to study the mass transfer characteristics.
absorption of CO2 into a carbonate- bicarbonate buffer
solution is a convenient system, and is represented by the second-order reaction Equation (11).
2 3
CO OH + −→ HCO −
(11)
Under certain conditions the above reaction is sufficiently fast, so that the concentration of CO2 in
the bulk of the liquid phase is equal to zero. The condition to be satisfied for this is,
o
L l 2 B
k a<< εk C (12)
Further, the reaction rate is such that no appreciable amount of reaction takes place in the diffusion films, and the condition to be satisfied for this is given by,
o
A 2 B
2 L D k C
1
k << (13)
When the conditions given by Equations (12) and (13) are satisfied, the rate of mass transfer is given by (Danckwerts, 1970)
*
L A
Ra=k aC (14)
The ratio of CO23− to HCO3− in the buffer solution was maintained within 1.6-4.3 to satisfy the conditions given by Eqs. (12) and (13). By measuring Ra, the rate of mass transfer per unit volume and interfacial concentration of carbon dioxide (C*A =HePA), the mass transfer coefficient, kLa, can be determined.
RESULT AND DISCUSSIONS
Flow Rates and Regimes
Flow conditions have significant effects on momentum, mass and energy transfer in gas-liquid contacting systems and, hence, it is desirable to maintain a constant flow regime throughout. Depending on the flow conditions, there are mainly four types of flow, viz., homogeneous bubbly flow, heterogeneous churn flow, slug flow and annular flow. Generally flow regimes are largely dependent upon the superficial gas velocity and column diameter. But for the present system of an ejector-induced downflow bubble column, where gas is sucked in by a high velocity liquid jet, the flow regimes depend primarily on liquid flowrate at constant column diameter. As liquid flowrate increases, there is a natural tendency of the gas bubbles to coalesce, forming large bubbles. Under this condition, large bubbles tend to move upward due to higher buoyant forces and, consequently, heterogeneous churn-turbulent or slug flow results. Kulkarni and Shah (1984) reported a flow regime map in terms of superficial gas and liquid velocities for possible operation in a cocurrent downflow system. With a sparger type gas distributor they found that operation is possible only in regime A; regime C is undesirable practically and operation is not possible in regime B. However, from Fig. 2 it is found that operation is also possible in regime B with an efficient gas-liquid distributor like an ejector-nozzle system. The Fig. 3 also shows that the gas to liquid flow ratio in the present work is much higher than that employed by Bando et al. (1988) with a similar system.
0.0 0.1 0.2 0.3 0.4
0.00 0.05 0.10 0.15
Reg
ime
C
Practically undesirable Regime-B
operation not possible
Regime-A operation possible
Transit
ion reg
ime Kulk
arni & S
hah (198
4)
Ba nd
o e
t a l.(1
98 8)
Symbol Fluids dn(mm)
Water 6
Su
per
ficial gas v
e
locity, V
g
[m
/s]
Superficial liquid velocity, Vl [m/s]
2.0x10³ 4.0x10³ 6.0x10³ 8.0x10³
0.0
5.0x10⁻⁵
1.0x10⁻⁴
1.5x10⁻⁴
System: Air-water dn:6 mm
Symbol Ql(m 3
/s)
2.18x10⁻⁴
2.35x10⁻⁴
2.52x10⁻⁴ 2.68x10⁻⁴
2.85x10⁻⁴
G
a
s en
trai
n
men
t ra
te,
Q
g
[
m
3 /s
]
Separator pressure, P
s[Pa]
Figure 2: Flow regime map of stable co-current
downflow
Figure 3: Effect of separator pressure on gas entrainment
258 Ajay Mandal
Brazilian Journal of Chemical Engineering Gas Entrainment by Liquid Jet Ejector
The downflow bubble column with gas entrainment by a liquid jet ejector system conforms to a new type of cocurrent bubble column, which can be successfully used in chemical, fermentation and waste treatment processes because of its self aeration characteristics. Entrainment occurs due to characteristics of the plunging liquid jet and the rate of entrainment is mostly controlled by the jet velocity. However, for a plunging liquid jet with a downcomer, entrainment also depends on the two-phase gas-liquid mixing height inside the downcomer. The entrained gas disperses into the liquid as fine bubbles in the intense mixing zone and the dispersed gas bubbles are then carried downward by the high momentum of downflow liquid. A minimum liquid flowrate is required to move the bubbles in the downward direction by prevailing over their upward buoyant force, which depends on the bubble size and physical properties of the fluids. Significant works have been reported on gas entrainment by plunging liquid jets through nozzles, Venturies and ejector system with and without downcomers.
The variations of gas entrainment rate (Qg) with
separator pressure for air–water at different liquid flow rates are presented in Fig. 3. It may be seen from the figure that, at constant liquid flow rate, gas entrainment rate decreases with separator pressure, Ps. As the separator pressure increases, the entrained
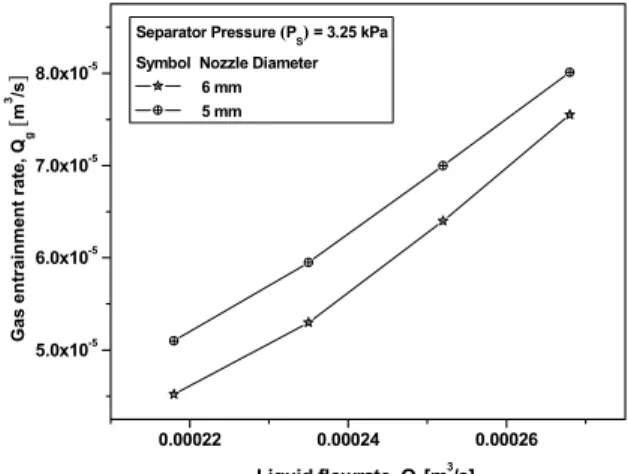
gas bubbles face more resistance to move downward and, consequently, lower entrainment results. The effects of motive liquid flow rate on air entrainment rate at constant Ps are presented in Fig. 4. It may be
seen from the plots that entrainment rate increases with liquid flow rate for a particular nozzle, due to the increase in the average velocity of the air film around the liquid jet (Evans et al., 1996). Entrainment rate generally increases with a decrease in nozzle diameter for constant liquid flow rate due to increased jet velocity. Further, on extrapolating the plots of Qg vs QL of Fig. 4, the liquid flow rate
corresponding to zero gas flowrate gives the minimum entrainment flow rate. For the present system, the minimum entrainment velocity based on nozzle diameter was found to vary between 5 m/s and 5.5 m/s.
0.00022 0.00024 0.00026
5.0x10⁻⁵
6.0x10⁻⁵
7.0x10⁻⁵
8.0x10⁻⁵
Gas en
tr
ai
n
m
en
t
ra
te
, Q
g
[
m
3 /s
]
Liquid flowrate, Ql [m3/s]
Separator Pressure (PS)= 3.25 kPa Symbol Nozzle Diameter
6 mm 5 mm
Figure 4: Effect of motive liquid flowrate on the air entrainment rate
0.0 2.0x10⁻²
4.0x10⁻²
6.0x10⁻²
0.3 0.4 0.5 0.6
Nozzle diameter = 6 mm
Symbol Vl (m/s)
0.1005 0.1172 0.1254 0.1335 0.1412
Ga
s
hol
dup,
εg
Superficial gas velocity, Vg [m/s]
0.08 0.10 0.12 0.14 0.16 0.18 0.20 0.22 0.24
0.40 0.45 0.50 0.55
Gas
ho
ldu
p
Slip velocity, us(m/s)
Nozzle diameter = 6 mm Liquid flowrate = 2.68x10⁻³
m3
/s
Figure 5: Variation of overall gas holdup with gas
flowrate
Figure 6: Variation of gas holdup with slip
Gas Hold-Up
In cocurrent downflow, the gas bubbles move against their high buoyant force, having a higher slip velocity compared to an upflow system. Thus, the bubbles have a longer residence time and hence higher gas holdup. Fig. 5 shows the variation of overall gas holdup with gas flowrate at constant liquid flowrate. At a constant liquid flowrate, gas holdup increases with increase in gas flowrate because of increased bubble population. However, the range of gas holdup variation is very small, because even at very low gas flow rate a higher gas holdup was observed due to a higher residence time of the bubbles. It may also be seen from the plots that gas holdup decreases with liquid flow rate at the same separator pressure, due to the increase in momentum imparted by the liquid on the gas bubbles.
The slip velocity model, first introduced by Behringer (1936), has been used to analyze the experimental holdup data for two-phase flow in the present system. The slip velocity of bubbles relative to the surrounding liquid is defined as;
us = ± [ug – ul]
= ±
[
g g Vε − lg
]
V
1− ε (15)
where the negative sign has been incorporated to consider the downflow system. Thus, gas holdup data can be correlated as a function of Vg and Vl. The
variation of gas holdup with slip velocity is shown in Fig. 6. The gas holdup increases with increase in slip velocity because of the increasing number of bubbles with higher residence time in the column.
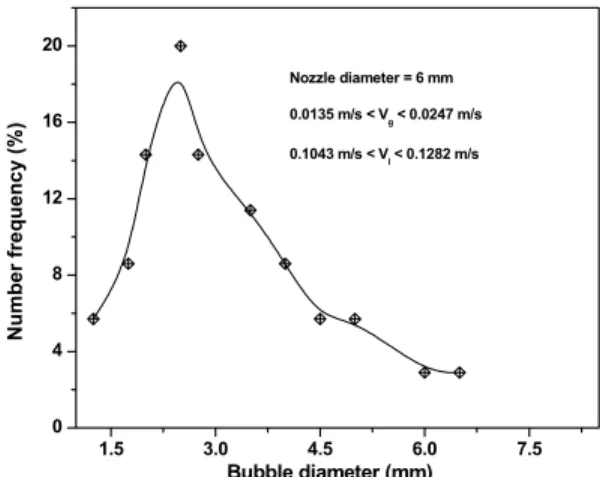
Bubble Size
In the two-phase gas-liquid system, the simultaneous bubble coalescence and breakup was considered to be largely responsible for the variation in bubble sizes throughout the column. The bubble size distribution was obtained at different axial positions of the column under steady state of a homogeneous bubbly flow. The sampling of bubbles was taken at different axial positions of the column, when the column is completely filled with the gas liquid mixture. Typical bubble size frequency distribution curves are shown in Fig. 7. The size distributions of the bubbles were found to deviate from a normal distribution with a skewness towards the larger bubble sizes. The Sauter mean bubble diameter was then calculated from the sampled bubble’s size and, consequently, interfacial area was calculated from Eq. (16).
g s 6 a
d ε
= (16)
where ds is the Sauter mean bubble diameter and is
defined as,
3 i i
s 2
i i n d d
n d
=
∑
∑
(17)where ni is the number of bubbles of diameter di. The
distribution of ds along the column is presented in
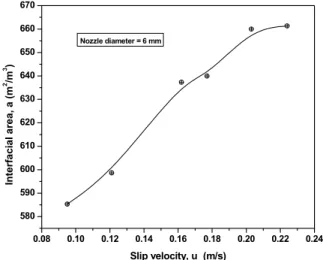
Fig. 8. Using this value of Sauter mean bubble diameter, one can calculate the interfacial area from Eq. (16). The calculated values of interfacial area are shown as a function of slip velocity in Fig. 9. Interfacial area increases with slip velocity because of increasing gas holdup.
1.5 3.0 4.5 6.0 7.5
0 4 8 12 16 20
Num
b
er
f
re
quenc
y (
%
)
Bubble diameter (mm)
Nozzle diameter = 6 mm 0.0135 m/s < Vg < 0.0247 m/s
0.1043 m/s < Vl < 0.1282 m/s
Figure 7: Distribution of bubble size at the
middle of the column.
0 10 20 30 40 50 60 70 80 90 100
1.0 1.5 2.0 2.5 3.0 3.5 4.0 4.5 5.0
Nozzle diameter = 6 mm 0.0135 m/s < V
g < 0.0247 m/s
0.1043 m/s < V
l < 0.1282 m/s
S
a
u
ter
mean
bu
bb
le d
iameter,
ds
(m
m)
Height of column (cm)
Figure 8: Variations of Sauter mean bubble
260 Ajay Mandal
Brazilian Journal of Chemical Engineering
0.08 0.10 0.12 0.14 0.16 0.18 0.20 0.22 0.24
580 590 600 610 620 630 640 650 660 670
Int
e
rf
a
c
ial a
rea
,
a
(m
2 /m
3 )
Slip velocity, us (m/s)
Nozzle diameter = 6 mm
Figure 9: Variation of interfacial area with slip velocity
Measurement of Interfacial Area by Chemical Method
In the chemical method, the interfacial area was measured by absorbing carbon dioxide into an aqueous solution of sodium hydroxide. For the present system, there is an unambiguous relationship between the gas flow rate and interfacial area. The variations of interfacial area are shown graphically with superficial gas velocity, Vg in Fig. 10. With an increase in gas flow
rate, both bubble population and gas holdup increase in the column. Therefore, higher interfacial area was observed at higher gas flow rate. The interfacial area obtained by the carbon dioxide absorption method in the present system was 100-300 m2/m3.
Mass Transfer Coefficient
The product of the liquid-side mass transfer coefficient kL and the specific interfacial area a is
known as the volumetric mass transfer coefficient (kLa). The product kLa, which is easy to determine
experimentally, is the only essential feature for a reaction that is slow enough in comparison with mass transfer (Schumpe and Deckwer, 1980). In the present system, kLa was measured by absorbing CO2
into a carbonate-bicarbonate buffer solution. The variations of kLa with simultaneous superficial liquid
and gas velocity are shown in Fig. 11. kLa increases
with superficial gas and liquid velocity due to increased gas bubble population and turbulences of the system, respectively.
If we assume that the interfacial area, a, measured by absorption of carbon dioxide in dilute aqueous solution of NaOH is more or less the same in the carbonate-bicarbonate buffer system, the true liquid-side mass transfer coefficient, kL, can be calculated
from Eq. (18).
L L
k a k
a
= (18)
A series of empirical and semi-empirical correlations have been proposed for liquid-side mass transfer coefficients in gas-liquid dispersions (Calderbank, 1959; Akita and Yoshida, 1974). Essentially, kL values are a function of bubble size
and liquid flow pattern around the bubbles. Calderbank and Moo-Young (1961) carried out detailed and extensive research on the mass transfer coefficient kL as a function of bubble diameter in
stirred tank reactors and bubble layers. A rule of thumb for low-viscosity media is that kL values range
between 0.015-0.035 cm s-1.
The kL values for the present system, ranging
0.01 0.02 0.03 0.04 0.05 0.06 0.07 50
100 150 200 250 300
Nozzle diameter= 6 mm
Superficial gas velocity, Vg(m/s)
Mas
s
tr
ans
fer
ar
ea
, (m
2/m
3)
Figure 10: Variation of interfacial area with superficial gas velocity
0.08 0.09
0.10 0.11
0.12 0.02
0.03 0.04 0.05 0.06 0.07 0.08
0.01 0.02
0.03 Nozzle diameter : 6 mm
Super
ficial g
as vel
ocity,
Vg [m
/s]
V
o
lu
m
e
tr
ic
m
a
s
s
t
ra
n
s
fe
r
c
o
e
ff
.,
kL
a
[
s
-1 ]
Superficial liq uid vel
ocity, V
l [m/s]
Figure 11: Variation of kLa with superficial liquid and gas velocity
Table 1: Comparison of gas holdup, interfacial area and mass transfer coefficients for different gas-liquid contactors
Author Type of reactor
Superficial Liquid velocity,
Vl, m/s
Superficial Gas velocity,
Vg, m/s
Gas holdup, dimen- sionless
Interfacial area
a (m2/m3)
Mass transfer
coeffi., kLa (s-1)
Ohkawa et al. (1987) Downflow liquid jet
bubble column 0.30-0.60 0.001-.02 0.10-0.40 250-450 0.02-0.10 Dutta and Raghavan
(1987) Jet loop reactor 0.001-0.005 0.001-0.006
0.02-0.15
30-500 0.01-0.08 Havelka et al. (2000) Upflow ejector loop
reactor 0.017-0.025 0.02-0.09 0.15-0.35
180-450 0.03-0.20 Bouaifi et al. (2001) Bubble column ⎯ 0.0025-0.04 0.01-0.30 2-130 0.005-0.10 Ide et al. (2001) Plunging jet absorber 0.028-0.071 ⎯ 0.09-0.35 80-800 0.02-0.20 Cerri et al. (2009) Concentric-tube
airlift reactors ⎯ 0.001-0.10 0.01-0.16 25-250 0.01-0.07 Present system Downflow ejector
262 Ajay Mandal
Brazilian Journal of Chemical Engineering CONCLUSION
Experiments were carried out to measure the gas-liquid parameters of a down-flow jet loop bubble column reactor. Based on the experimental results and analysis of the data, the following conclusions may be drawn:
Gas holdup obtained in the present system is
significantly higher compared to other reported gas-liquid systems because of the fine dispersion of gas bubbles with the plunging jet and the higher residence time of the gas bubbles in the downflow column.
Gas holdup and interfacial area is a strong
function of gas-liquid slip velocity.
Interfacial area obtained from gas holdup and
Sauter mean bubble diameter was found to be higher than that from the chemical method because, the bubbles in the present case are mostly distorted and have substantial common interfaces between them.
Mass transfer coefficients are functions of both liquid and gas flow rate, as both are responsible for bubble population and turbulence of the system. However, beyond a certain flow rate, the effects gradually decrease and the mass transfer coefficient values remain constant.
NOMENCLATURE
a specific interfacial area per
unit volume
m2/m3 *
A
C concentration of dissolved gas at the interface, in equilibrium with gas at the interface
gmol/cm3
o B
C concentration of reactant B
in the bulk of the solution
gmol/l
DA diffusivity of reactant A
inthe liquid phase
cm2/s
dn diameter of the nozzle m
ds Sauter mean bubble
diameter
m
G′ molar flowrate of inert gas, gmol/s
hl clear liquid height,
corresponding to total gas-liquid mixing height in the column
m
hm gas-liquid mixing height in
the column
m
He Henry’s law constant cm3.atm/gmol
k2 second order reaction rate
constant
cm3/gmol.s
kL liquid-side mass transfer
coefficient
cm/s
kLR coefficient of chemical
absorption
( o
A 2 B D k C )1/2,
cm/s
A
p partial pressure of A atm
* A
p equilibrium partial pressure
of A
atm
P′ system pressure atm.
Ps separator pressure Pa
Qg volumetric flow rate of gas m3/s
Ql volumetric flow rate of
liquid
m3/s
us slip velocity of gas and
liquid
m/s
V volume of gas-liquid
mixture inside the column
m3
Vg gas superficial velocity m/s
Vl liquidsuperficial velocity m/s
y composition of CO2 in gas
phase
mol%
yo composition of CO2 in gas
phase at inlet
mol%
yi composition of CO2 in gas
phase at outlet
mol%
εg gas holdup dimensionless
εl liquid holdup dimensionless
REFERENCES
Akita, K. and Yoshida, F., Bubble Size, Interfacial Area and Liquid-Phase Mass Transfer Coefficient in Bubble Columns. Ind. Eng. Process Des. Dev., 13, pp. 84-91 (1974).
Atkinson, B. W., Jameson, G. J., Nguyen, A. V., Evans, G. M. and Machniewski, P. M., Bubble Breakup and Coalescence in a Plunging Liquid Jet Bubble Column. Canadian Journal of Chemical Engineering, 81, pp. 519-527 (2003). Bando, Y., Kuraishi, M., Nishimura, M., Hattori, M.
and Asada, T., Cocurrent Downflow Bubble Column with Simultaneous Gas-Liquid Injection Nozzle. Journal of Chemical Engineering of Japan, 21, pp. 607-612 (1988).
Behringer, H., The Flow of Liquid-Gas Mixtures in Vertical Tubes. Zeit. Ges. Kalte-Ind., 43, pp. 55-58 (1936).
Bin, A. K. and Smith, J. M., Mass Transfer in a Plunging Liquid Jet Absorber, Chemical Engineering Communication, 15, pp. 367-383 (1982).
Bubble Columns. Chem. Eng. Proc., 40, 97-111 (2001).
Brian, P. L. T., Gas Absorption Accompanied by an Irreversible Reaction of general Order, AIChE Journal, 10, pp. 5-10 (1964).
Briens, C. L., Huynh, L. X., Large, J. F., Catros, A., Bernard, J. R. and Bergougnou, M. A., Hydrodynamics and Gas-Liquid Mass Transfer in a Downward Venturi-Bubble Column Combination. Chemical Engineering Science, 47, pp. 3549-3556 (1992).
Calderbank, P. H. and Moo-Young, M. B., The continuous phase heat and mass transfer properties of dispersions. Chemical Engineering Science, 16, pp. 39-54 (1961).
Calderbank, P. H., Physical Rate Processes in Industrial Fermentation: Part II-The Interfacial Area in Gas-Liquid Contacting with and without Mechanical Agitation. Trans. Instn. Chem. Engrs., 37, 173-185 (1959).
Cerri, M. O., Baldacin, J. C., Cruz, A. J. G., Hokka, C. O. and A. C. Badino, Prediction of mean bubble size in pneumatic reactors. Biochemical Engineering Journal, (March) (2009).
Danckwerts, P. V., Gas-Liquid Reactions. McGraw-Hill, New York, pp.17-20 & 97-205 (1970). Dutta, N. N. and Raghavan, K. V., Mass Transfer
and Hydrodynamics of Loop Reactors with Downflow Liquid Jet Ejector. Chemical Engineering Journal, 36, pp. 111-121 (1987). Evans, G. M., Bin, A. K. and Machniewski, P. M.,
Performance of Confined Plunging Liquid Jet Bubble Column as a Gas-Liquid Reactor. Chemical Engineering Science, 56, pp. 1151-1157 (2001).
Evans, G. M., Jameson, G. J. and Rielly, C. D., Free Jet Expansion and Gas Entrainment Characteristics of Plunging Liquid Jet, Experimental Thermal and Fluid Science. 12, pp. 142-149 (1996).
Havelka, P., Linek, V., Sinkule, J., Zahradnik, J. and Fialova, M., Hydrodynamic and Mass Transfer Characteristics of Ejector Loop Reactors. Chemical Engineering Science, 55, pp. 535-549 (2000).
Huynh, X., Briens, C. L., Catros, A., Bernard, J. R. and Bergougnou, M. A., Hydrodynamics and Mass Transfer in an Upward Venturi/Bubble Column Combination. Canadian Journal of Chemical Engineering, 69, pp. 711-722 (1991). Ide, M., Uchiyama, H. and T. Ishikura, Mass
Transfer Characteristics in Gas Bubble Dispersed Phase Generated by Plunging Jet Containing
Small Solute Bubbles. Chemical Engineering Science, 56, pp. 6225-6231 (2001).
Kulkarni, A. and Shah, Y. T., Gas Phase Dispersion in a Downflow Bubble Column. Chemical Engineering Communication, 28, pp. 311-326 (1984).
Kundu, G., Mukherjee, D. and Mitra, A. K., Experimental Studies on a Co-current Gas-Liquid Downflow Bubble Column. Int. J. Multiphase Flow, 21, pp. 893-906 (1995).
Mandal, A., Kundu, G. and Mukherjee, D., Gas-Holdup Distribution and Energy Dissipation in an Ejector Induced Downflow Bubble Column: The Case of Non-Newtonian Liquid. Chemical Engineering Science, 59, pp. 2705-2713 (2004). Mandal, A., Kundu, G. and Mukherjee, D.,
Interfacial area and liquid-side volumetric mass transfer coefficient in a downflow bubble column. Canadian Journal of Chemical Engineering, 81, pp. 212-219 (2003).
Manish P. and Majumder, S. K., Quality of Mixing in a Downflow Bubble Column Based on Information Entropy Theory. Chemical Engineering Science, 64, 1798-1805 (2009).
McKeogh, E. J. and Ervine, D. A., Air Entrainment Rate and Diffusion Pattern of Plunging Liquid Jet. Chemical Engineering Science, 36, pp. 1161-1172 (1981).
Milenković, R. Ž., Sigg, B. and Yadigaroglu, G., Bubble clustering and trapping in large vortices. Part 1: Triggered bubbly jets investigated by phase-averaging. International Journal of Multiphase Flow, 33, pp. 1088-1110 (2007).
Nijsing, R. A. T. O., Hendriksz R. H. and Kramers, H., Absorption of CO2 in Jets and Falling Films
of Electrolyte Solutions, with and without Chemical Reaction. Chemical Engineering Science 10, pp. 88-104 (1959).
Ohkawa, A., Kawai, Y., Ksabiraki, D., Saki, N. and K. Endoh, Bubble Size, Interfacial Area and Volumetric Liquid-Phase Mass Transfer Coefficient in Downflow Bubble Columns with Gas Entrainment by a Liquid Jet. Journal of Chemical Engineering of Japan, 20, pp. 99-101 (1987).
Ohkawa, A., Kusabiraki, D., Kawai,Y. and Sakai, N., Some Flow Characteristics of a Vertical Liquid Jet System having Downcomers. Chemical Engineering Science, 41, pp. 2347-2361 (1986). Porter, K. E., King, M. B. and Varshney, K. C.,
264 Ajay Mandal
Brazilian Journal of Chemical Engineering
and Caustic Soda Solution. Trans. Instn. Chem. Engrs., 44, pp. 274-278 (1966).
Schafer, R., Merten, C., and Eigenberger, G., Bubble Size Distributions in a Bubble Column Reactor under Industrial Conditions. Experimental Thermal and Fluid Science, 26, pp. 595-604 (2002).
Schumpe, A. and Deckwer, W. D., Analysis of Chemical Methods for Determination of Interfacial Areas in Gas-in-Liquid Dispersions with Non-uniform Bubble Sizes. Chemical Engineering Science, 35, pp. 2221-2233 (1980). Shah, Y. T., Kulkarni, A. A. and Wieland, J. H., Gas
Holdup in Two- and Three-Phase Downflow Bubble Columns. Chemical Engineering Journal, 26, pp. 95-104 (1983).
Sharma, M. M. and Danckwerts, P. V., Chemical Methods of Measuring Interfacial Area and Mass Transfer Coefficients in Two-fluid Systems. Brit. Chem. Eng., 15, pp. 522-528 (1970).
Uchiyama, H., Ishikura T. and Ide, M., Gas Holdup Distribution of Gas Bubble Dispersed Phase in Gas–Liquid Two-Phase Jet Absorber. Journal of
Chemical Engineering of Japan, 41, pp. 533-539 (2008).
Van de Sande, E. and Smith, J. M., Mass Transfer from Plunging Water Jets. Chemical Engineering Journal, 10, pp. 225-233 (1975).
Van de Sande, E. and Smith, J. M., Surface Entrainment of Air by High Velocity Water Jets. Chemical Engineering Science, 28, pp.1161-1168 (1973).
Voyer, R. D. and Miller, A. I., Improved Gas-Liquid Contacting in Co-Current Flow. Canadian Journal of Chemical Engineering, 46, pp. 335-341 (1968).
Watson, D. and Grainger-Allen, T. J. N., Study of Froth Floatation using a Steady-state Technique. Trans. Soc. Mech. Eng. AIME, 256, pp. 242-247 (1974).