doi: 10.1590/0101-7438.2017.037.02.0229
DEMAND FORECAST AND OPTIMAL PLANNING OF INTENSIVE CARE UNIT (ICU) CAPACITY
Simone A. Angelo
1, Edilson F. Arruda
1, Rosane Goldwasser
2*,
Maria S.C. Lobo
2, Andr´e Salles
3and Jos´e Roberto Lapa e Silva
4Received January 20, 2017 / Accepted June 20, 2017
ABSTRACT.Critical Care is a medical specialty which addresses the life-saving and lifesustaining man-agement of patients at risk of imminent death. The number of Intensive Care Unit (ICU) beds has an impact on patient’s prognosis. This paper aims to determine the optimal number of ICU beds to reduce patient’s waiting time. Time series was applied to predict demand making use of information on the daily patient’s requests for ICU beds to obtain a demand forecast by means of exponential smoothing and Box-Jenkins models, which provided the input of a Queuing model. The outputs were the optimal number of ICU beds, in different scenarios, based on demand rate and patient’s length of stay (LOS). A maximum waiting time in the queue of 6 hours was proposed and compared to government recommendation (118-353 beds). The need for ICU beds varied from 345 to 592 for a 6-hour waiting time (for a LOS of 6.5 to 11.2 days, respectively). The results show that managing demand and discharge timing could control the queue. Moreover, they also suggest that the current recommendation is inadequate for the demand.
Keywords: intensive care unit, hospital bed capacity, health services accessibility, unified health system, time series, systems theory.
1 INTRODUCTION
Critical Care is a medical specialty which addresses the life-saving and life-sustaining manage-ment of patients at risk of imminent death. The most critical delays for healthcare are arguably those associated with emergencies and critical care. Lack of Intensive Care Unit (ICU) beds may cause ambulance diversion and surgery cancellation. Overcrowding in either the emergency
*Corresponding author.
1Programa de Engenharia Industrial, Instituto Alberto Luiz Coimbra – Escola de Graduac¸˜ao e Pesquisa em Engenharia, Universidade Federal do Rio de Janeiro, 21941-972 Rio de Janeiro, RJ, Brasil. E-mail: [email protected] 2Hospital Universit´ario Clementino Fraga Filho, Universidade Federal do Rio de Janeiro, 21941-913 Rio de Janeiro, RJ, Brasil.
E-mails: [email protected]; [email protected]
Department or the ICU typically results in long waiting times which, in turn, can lead to adverse clinical consequences. When the number of patients requiring intensive care is greater than the number of beds available, ICU entry flow is obstructed (Levin & Sprung, 2001). As critically ill patients need early interventions to improve their outcomes, delayed ICU bed availability has been suggested to be associated with higher mortality (e.g., Blow et al., 1999; Chalfin et al., 2007; Rivers et al., 2001; Young et al., 2003).
In the face of an aging and increasingly morbid global population, timely access to ICU beds becomes increasingly important (Angus et al., 2000). Official government data states that the Brazilian population nearly tripled in the last 54 years, going from approximately 70 million in 1960 to about 200 million in 2014. In addition to this steep growth, life expectancy also raised, thus increasing the elder population, which amounts to about 10.7% of the current Brazilian population. According to official estimates, the Brazilian elderly population will correspond nearly 26 million people in 2025 (IBGE, 2013). It is estimated that patients older than 65 occupy approximately 60% of ICU beds and their length of stay (LOS) is seven times greater than that for a younger population. Moreover, the incidence of respiratory failure treated with mechanical ventilation increases 10 times from 55 to 85 years, resulting in increasing numbers of elderly requiring intensive care (Angus et al., 2000). These and other statistical data can only provide a small glimpse of the complex dynamics behind the ever increasing demand for ICU’s. While it does encompass the dynamics of population growth, it is also influenced by other countless factors which are hard to predict and quantify, such as case-mix (by diagnosis and severity) and unexpected epidemiological demands (epidemics). On top of that, the expansion of ICU’s is complex and expensive due to both the technology and the high costs involved. As a result, the increase in ICU beds typically does not meet the increase in demand, and the imbalance thus created typically results in long queues, large waiting times and higher mortality.
From the preceding hints one can infer that ICU scheduling and planning is a very impor-tant problem. As such, it received much attention in the literature (e.g., Cardoen et al., 2010). Scheduling and allocation rules are proposed and studied by Cayirli & Veral (2003); Kim & Horowitz (2002), Van Houdenhoven et al. (2008), Litvak et al. (2008), Gupta & Denton (2008), and Sadki et al. (2013). Studying pediatric ICU occupation rates for a specific population in the UK over a one-year period, Milne & Whitty (1995) derived the required number of ICU beds as a linear function of the population size, and showed that over this period the arrivals closely follow a Poisson process with constant rate. This study suggests that a Poisson process may be used to derive the queueing model of ICU units for a short-term period. Pearson et al. (2012) addressed the same problem and employed both a Poisson model and a more complex Monte Carlo simulation model. Their study suggested that the variation in the mean demand rates for ICU beds may not be linear with respect to the population size. It also suggested that seasonal factors may have an impact in the demand rate variation.
et al., 2012). It is also flexible to the point of enabling the decision maker to test and compare different scenarios for improving the operation. The complexity of the system, however, may remain poorly understood and that may render the proposal of efficient optimizing rules infeasi-ble. Queuing models may provide a better understanding of the system, while also simplifying the derivation of optimizing policies. Shmueli et al. (2003) made use of queuing theory to com-pare distinct admission policies, whereas McManus et al. (2004) reported that queuing models proved very precise in a typical real world ICU problem.
In this paper, we make use of the rationale behind the works of Milne & Whitty (1995) and Pearson et al. (2012) and assume that, for a short span of time, the arrival process of ICU’s can be modeled as a stochastic process with constant rate. However, such rate may vary because of seasonal factors, changing population dynamics, and a series of complex factors which are very hard, if not impossible, to quantify (e.g. Pearson et al., 2012). Nonetheless, we argue that such a variation must be accounted for. In that sense, we propose that the dynamic variations in the average demand rate for ICU beds be modeled by means of time series (e.g. Hyndman & Khandakar, 2008; Hyndman et al., 2008). These models are suggested because they offer a framework to describe complex processes whose dynamics remain hidden, but can be inferred to a certain degree of precision by observing past data.
The novelty in the proposed approach is that we treat the demand for ICU beds as a time varying stochastic process. The varying parameter in the proposed time varying process is the daily de-mand rate for ICU beds, which is studied by means of time series models. That enables one to use classical queueing models to optimize the ICU capacity for a prescribed performance criterion over a short time frame. To address the long-term planning problem, we proceed in two steps. At the first step, the decision maker makes use of time series models to predict the average de-mand for ICU beds over a given period of interest in the future. With such a prediction, we can apply a classical queuing model, with a prescribed performance criterion, to derive an optimal expansion plan.
The time series evaluations employed in the proposed framework make use of exponential smoothing and ARIMA, which are very efficient methods for time series forecasting (Hyndman & Khandakar, 2008; Hyndman et al., 2008). While it can be argued that exponential smoothing is a more general framework than ARIMA, both methods typically yield good responses and there is no obvious answer on which performs better for a given set of data. As a result, this paper applies both methods to foresee the input rate of the queuing process that describes the usage of ICU beds, and makes use of the method which performs best for the available data.
from any pre-hospital health unit, such as a hospital Emergency Department or an Emergency Unit (Unidade de Pronto Atendimento – UPA), they strive to find an available bed, by location, resources or specialty, in any of the hospitals they regulate. When they find an ICU bed, the incoming patient is then routed to the selected hospital.
To estimate the incoming rate of requests for ICU beds, we make use of a time series comprised of the daily incoming requests for ICU beds from January 2010 to November 2011. This time series is studied by means of efficient time series models, that are employed to make a long-term prediction of the demand rate for ICU units. Such a rate is then inputted to a queuing model to find the optimal number of ICU beds in the long-term. Note that the time series model predictions are used only to estimate the mean rate of arrival of ICU patients in a stochastic queuing model. Note also that, since a stochastic queuing model is used, it does account for the stochastic fluc-tuations in the daily demand.
With respect to the case study, the objectives of are:
• Identify the most adequate forecast method for the daily rate of ICU requests, making use of the data made available by CER;
• Determine an optimal expansion plan for the ICU beds in the metropolitan area of Rio de Janeiro, considering different scenarios with respect to the average LOS;
• Compare the number of ICU beds yielded by the model under different scenarios with Brazilian government’s recommendation wich indicates the number of ICU beds as a linear function of the total population.
Figure 1 features a graphical representation of the methodology.
This paper is organized as follows. Section 2 features a brief introduction to time series, and applies this approach to the data arising from the case study. Section 3 deals with queuing theory and proposes a queuing model to address the ICU planning problem. The proposed models are applied to the case study in Section 4, and Section 5 concludes the paper.
2 TIME SERIES FORECASTING
A time series can be seen as a set of chronologically ordered observations (Chatfield, 2000). A typical application of a time series study is to forecast future values of a data series based on the past history of this and possibly other series. Detailed treatments of time series can be found in Box & Jenkins (1970) and Brockwell & Davis (1991), among others.
There is a wide range of prediction methods for time series, such as moving average, classical decomposition, exponential smoothing, Box-Jenkins methods, neural networks, etc. Making use of the results by Hyndman et al. (2008) and Hyndman & Khandakar (2008), we applied expo-nential smoothing and Box-Jenkins methods, chosen for their simplicity and because they tend to be consistently more effective than more sophisticated methods (e.g., Gardner, 2006; Hyndman & Khandakar, 2008).
2.1 Forecasting the ICU Daily Demand
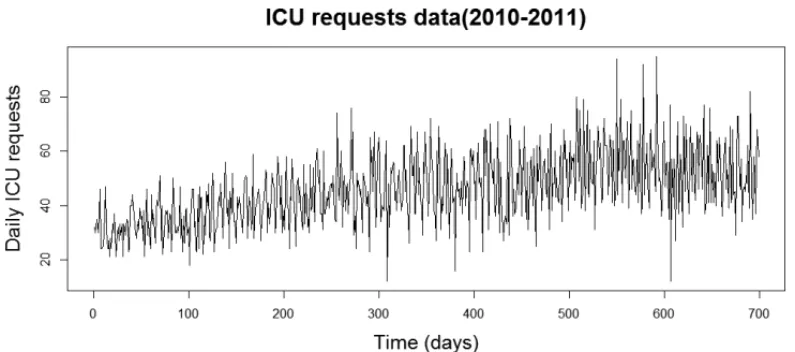
We used the statistical software RR (R Development Core Team, 2015) to make all the predic-tions. We made predictions with the following methods: Holt-Winters additive and multiplica-tive, damped additive and multiplicative trend, and SARIMA. To make the predictions, we split the data into two parts, corresponding to about 70% and 30% of the data, respectively: the first part was used for adjusting and second part for validation of predictions. We used the models learned from the first part to make the prediction of the remaining data. This prediction was then compared to the original validation data, and the best model with respect to classical performance criteria was selected. The original time series is depicted in Figure 2.
The performance measures for the selected models are presented in Table 1. Each column on the right-hand side corresponds to a classical measure. In the table RMSE stands forroot mean squared error, MAE corresponds tomean absolute error, MPE representsmean percentage er-ror, and MAPE is themean absolute percentage error.
From the data in Table 1 one can see that the best prediction method among the selected ones is the damped multiplicative trend method, which is an exponential smoothing method. This is consistent with the results presented by Gardner & McKenzie (2010), who argue that the damped trend method stands out for its precision, making it hard for other methods to present a better performance.
Figure 2–Daily ICU requests for 2010 and 2011.
Table 1–Model Comparison for the ICU Time Series.
Model Performance Measure
RMSE MAE MPE MAPE
Multiplicative Holt-Winters 12.37 10.06 –0.16 22.36
Additive Holt-Winters 11.73 9.64 –0.14 21.56
Damped Multiplicative Trend 10.44 8.57 0.03 16.64
SARIMA 10.46 8.60 0.01 16.98
Based on the preceding results, the damped multiplicative trend method will be employed for prediction in the queuing model presented in Section 3. The predicted daily request rate will feed the queuing model to produce an optimal expansion plan for the ICU beds regulated by CER.
While the error measures presented in Table 1 indicate that the forecast is not perfect, the pre-diction error is, in part, accounted for in the queuing model used in Section 3 for the planning step, which considers that the daily demands are, in fact, stochastic. Indeed, the predicted de-mands are employed only as the average values of a stochastic process that describes the actual demand. Hence, the queuing model accounts for demand fluctuations. Moreover, the expansion is naturally incremental, and adjustments can be made along the way to compensate for eventual prediction errors.
3 QUEUEING MODEL SELECTION
Queueing theory is an operations research framework that is used to model the mismatch be-tween demand and service in systems where customers wait for service in lines (e.g., Hillier & Lieberman, 2010; Kleinrock, 1975). A very popular approach in queueing theory is to model the system as a stochastic birth-and-death process (Br´emaud, 1999), with the time between arrivals modeled as an independent and identically distributed (i.i.d) random variable with exponential distribution, and the service time also modeled as an i.i.d. exponentially distributed variable. Such a model is referred to in queueing theory as anM/M/smodel, where the two first acronyms are referred to the input and service distributions (M for Markovian or memoryless, an exclu-sive attribute of exponential distributions) andsrefers to the number of service units, which in our case are the available ICU beds. This model is generally applied because it does result in simple analytic solutions that simplify the analysis of the studied system (Blumenfeld, 2010; Kleinrock, 1975).
The times between successive ICU requests were collected, and split into daily data. Indeed, as suggested in the studies of Milne & Whitty (1995) and Pearson et al. (2012), we verified that the daily inter-arrival times do follow exponential distributions (e.g., Ross, 2009; Wasserman, 2004). Naturally, the parameters of the distributions vary over time, but at any given day an exponential distribution can be effectively fitted into the inter-arrival times. To illustrate the results, Figure 4 shows the empirical cumulative distribution of inter-arrival times for October 1, 2010, versus the fitted empirical distribution. The times are presented in hours, and the probabilities are presented in the y-axis. The p-value for the fitted distribution is 0.8184, which evidences a good fit.
Figure 4–Times between successive ICU requests for selected day.
Figure 5–Service time for individual ICU patients for selected day.
3.1 Closed Form Equations and Performance Function
Once an M/M/squeuing model can be used to model the studied problem, one can make use of the closed form solutions available for such model (e.g., Blumenfeld, 2010; Hillier & Lieber-man, 2010). The parameters of such a model are the demand (input) rate
0< λ <∞,
and the service rate for a single server 0< µ <∞.In our case study,µrepresents the average number of patients released from a single ICU bed per time period. For the system to be stable, the following expression must hold:
λ <sµ.
M/M/squeue, the long-term probability thatnclients are in the system is given by (e.g. Hillier & Lieberman, 2010):
πn(s)= ⎧ ⎪ ⎪ ⎪ ⎨ ⎪ ⎪ ⎪ ⎩ λ µ n
n! π0, 0≤n ≤s
λ µ
n
s!sn−sπ0, n >s
, n∈N, (1)
with
π0(s)= s−1
n=0 λ µ n n! + λ µ s s! · 1 1−sµλ
−1
. (2)
In possession of the term probability distribution just described, one can evaluate any long-term performance criterion as a function of the number of ICU beds (s) made available (e.g., Br´emaud, 1999), thus determining the optimal number of ICU beds for the prescribed criterion.
Considering that the waiting time, here defined as the time spent in the queue prior to being serviced, seems to be the most critical variable in the model, we propose a maximum waiting time approach in which the decision maker selects the maximum waiting time allowedtmax. Given that the system is stochastic, for any finite number of ICU beds, there will be a probability that a patient selected at random waits more than a prescribed waiting timeωq,t <∞, for a bed to become available. Whensservers are made available, that probability is given by:
Ps(ωq>t)=1−Ps(ωq =0)e−(sµ−λ)t,
Ps(ωq =0)=sn−=10πn(s).
(3)
The optimal number of ICU bedss∗is chosen in such a way that:
s∗=min{s∈N: Ps(ωq>tmax)≤ pmax}, (4) where 0 < pmax < 1 is a prescribed probability chosen by the decision maker. For example, if the decision maker wants that at most 1% of the patients wait more than 1 hour, they should selecttmax=1handpmax=0.01.
The proposed performance criterion, which does not focus on the average waiting time, but in a maximum allowed waiting time, is also a novel contribution of the this paper. While the average waiting time is a valid criterion, it says little about the actual waiting time distribution and may force a significant portion of the patients to wait much longer. Focusing on the max-imum allowed waiting time, on the other hand, we guarantee that a prescribed portion of the patients will wait less than a prescribed threshold. And one can improve the performance by tightening the threshold or decreasing the probability of violating it.
4 NUMERICAL SIMULATIONS
shed light into the daily problem of ICU planning and operation in Rio de Janeiro. Considering the results in Section 2.1, the average daily request is forecast by means of a Multiplicative Damped Trend time series method. We obtain the optimal number of ICU beds s∗ for each experiment with the method proposed in Section 3, using the average demand forecast for the last week of the planning period as the input data. We have chosen this period because the time series has a 7-day seasonality, which is expected in view of the variation of the demand with the day of the week.
4.1 Scenario One
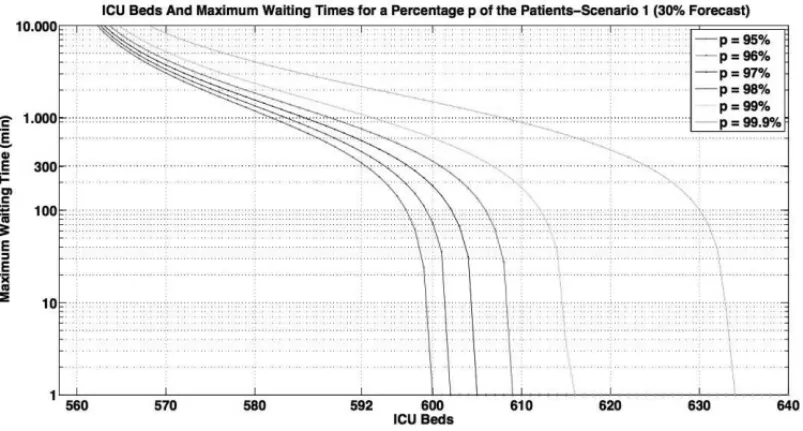
This scenario considers the totality of adult ICU requests formalized to CER as the input data, which also contains the requests for patients that improved their health condition while waiting in line, until doctors diagnosed they no longer needed intensive care (ICU beds) and released them from the queue. This data is kept because the doctors did not know a priori that the beds would not be needed. Moreover, if the system was more efficient, some of these patients would probably pay a brief visit to an ICU bed before being released. In the first experiment, we divided the se-ries in 70% of adjusting data and 30% of validation data, as in Section 2.1. The forecast demand for the validation period isλ =2.065 patients per hour, and the average release time for ICU patients, i.e. the LOS, is 11.255 days, which results in a service (release) rateµ = 0.003702 patients per hour per ICU bed, according to data from the Brazilian Ministry of Health (DATA-SUS, 2013). With the input and output rates defined, we made use of the results in Section 3 to produce the results depicted in Figure 6.
Figure 6–Maximum Waiting Time For Selected Percentages of Patients: 30% Forecast.
interest, ranging from pmax = 0.05 to pmax = 0.01. For the sake of simplicity, the legends in Figure 6 show the minimum percentage of patients that wait less thantmax. Thus, the values
p in the legend are defined as p = 100·(1 − pmax)%. Note that, for a single value p, the number of beds increase as the waiting time decreases, which is expected. Observe also that, as the percentage of patients waiting less than a prescribed threshold increases, more ICU beds are needed to keep the maximum waiting time below that same threshold. That is also expected since increasing the capacity we keep less patients in line, which decreases the time in the queue.
The plot in Figure 6 is general in that it permits the decision maker to dimension the ICU capacity for any combination of maximum waiting timetmaxand probabilitypmaxof exceed-ing this value. An attentive look at Figure 6 reveals that one needs 559 beds for the system to be stable; 592 beds for the waiting time be limited to 6 hours for at least 95% of the patients, and 634 beds for a maximum waiting time of 1 minute, for at least 99.9% of the patients. The 6-hour waiting time cut-off assumes that prognosis will not be worsened if pre-ICU guidelines are appropriately adopted.
The second experiment considers a planning period of one year. For such a period, the forecast average daily demand isλ = 2.198204 patients per hour, and the service (release) rateµ = 0.003702 patients per hour per ICU bed is the same of the first experiment. Figure 7 depicts the results.
Figure 7–Maximum Waiting Time For Selected Percentages of Patients: One Year Planning.
medical attention at the Emergency Room and present clinical improvement, no longer requiring intensive care. A compromise should be reached by the decision maker between investment and maximum waiting time.
4.2 Scenario Two: Reducing Service Time
Official data states that the average release time for CER patients is considerably higher than the average release time for the whole set of hospitals in the state of Rio de Janeiro (DATA-SUS, 2013). In possession of the data, we can estimate the gain in performance for CER if the hospitals it regulates attain the same performance. To make this estimation, we keep the same demand levels of the experiments in Scenario One, but with a change in the output (service) rate.
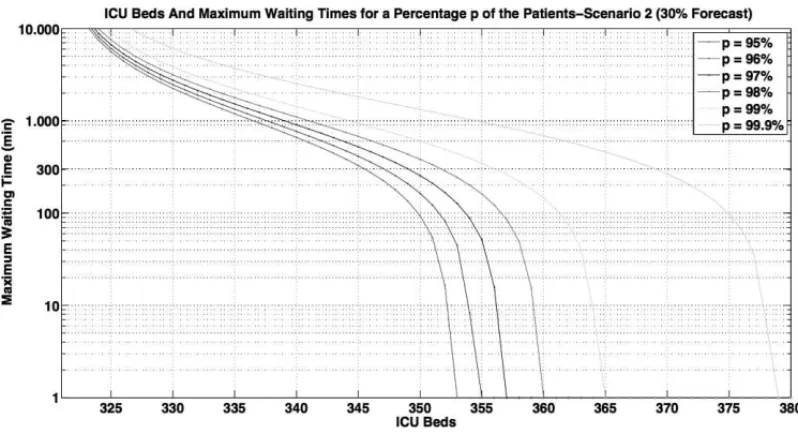
For the third experiment, the demand rate forecast for the 30% validation period is kept as
λ = 2.065 patients per hour. In addition, the output rate is changed to the average rate for Rio de Janeiro in 2012,µ=0.006442 releases per hour per bed. Figure 8 depicts the results.
Figure 8–Maximum Waiting Time For Selected Percentages of Patients: 30% Forecast.
From the results in Figure 8, one can see that we need 321 ICU beds for stability, 345 to ensure a maximum waiting time of 6 hours for at least 95% of patients, and 379 ICU beds to ensure a waiting time of less than 1 minute for at least 99.9% of the patients. Note the substantial decrease with respect to the results in Figure 6, where 559 beds were need to attain stability. This result illustrates the expressive gains for CER ICU’s flow organization if they could pursue a policy for shortening their patients LOS.
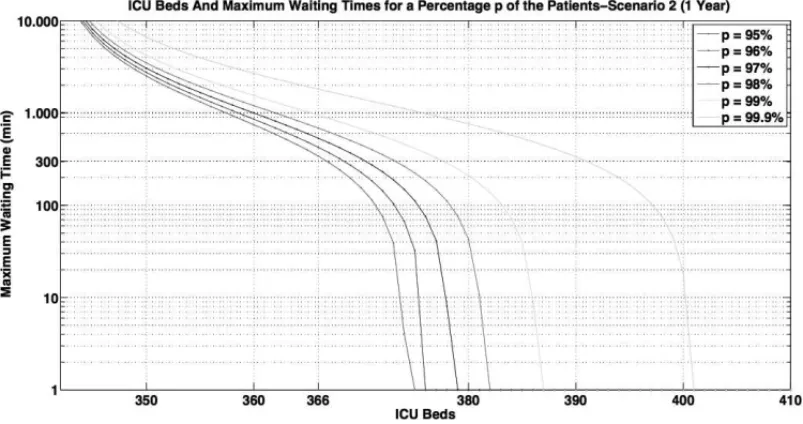
service rate, however, is changed toµ =0.006442, as in the previous experiment. The results are depicted in Figure 9.
Figure 9–Maximum Waiting Time For Selected Percentages of Patients: One Year Planning.
Note in Figure 9 that stability is attained with 342 beds, while for the current CER service levels one would need 595 ICU beds for stability, as illustrated in Figure 7. The gain in performance is, therefore, substantial. Figure 9 also yields that 366 beds ensure a maximum waiting time of 6 hours for at least 95% of patients, while 401 beds ensure a waiting time of less than one minute for at least 99.9% of patients.
4.3 Comparing Scenarios
This section is concerned with comparing the optimal number of ICU beds found for each ex-periment in Sections 4.1 and 4.2 with the number recommended by the Brazilian government through decree GM/MS #1.101/2002. This decree establishes that the total number of ICU beds per thousand habitants should be in the interval[0.1,0.3]. We also compare the referred results with the current number of CER adult ICU beds: 268.
Figure 10 shows the number of ICU beds for selected performance criteria for each experiment in Sections 4.1 and 4.2. Table 2 summarizes these experiments.
Number of ICU Beds Versus Performance
Figure 10–Number of ICU Beds Versus Performance.
The horizontal lines represent the minimum and maximum number of ICU beds for CER ac-cording to decree GM/MS #1.101, as well as the current number of CER adult ICU beds. The experiments reveal that the maximum number of ICU beds according to the Brazilian norm is not enough for stability in Experiments 1 and 2, which means that such a number of ICU beds would cause ever increasing queues, thus compromising the performance. We recall that these experiments address the dimensioning of the total capacity for the latter 30% of the period 2010-2011 and for the year of 2012, if the average LOS is kept constant.
Table 2–Performed Experiments.
Experiment Description Arrival Rate Service Rate
(patients/hour) (patients/hour)
1 current demand, current service rate 2.065000 0.003702 2 1-year planning, current service rate 2.198000 0.003702 3 current demand, improved service rate 2.065000 0.006442 4 1-year planning, improved service rate 2.198000 0.006442
for the latter 30% of the period 2010-2011 and was kept in the year of 2012, the maximum number of ICU beds according to the current norm would be enough to keep the system stable in both experiments. Furthermore, it would keep the maximum waiting time below the 6-hour threshold for over 95% of the patients in the latter third of the period 2010-2011. But for 2012 it would result in a maximum waiting time exceeding 16 hour for over 95% of the patients.
Figure 10 clearly suggests that the Brazilian norm may be inadequate for the current demand profile for ICU beds, even for reduced LOS levels. It also suggests that, by decreasing the length of stay, CER could expand in a more incremental manner, thus saving valuable resources for future investments. It is worth pointing out, however, that the average LOS of public hospitals, such as those regulated by CER, is typically much higher than that for private hospitals. In that sense, attaining an average LOS compatible with the global average can be an unrealistic goal. Hence, a more thorough analysis is needed to access what the attainable goals are in terms of the average LOS.
The current number of CER adult ICU beds is not enough for stability in any experiment. This result is in line with the current situation of long queues and large waiting times for CER’s ICU beds, and strongly suggests that an expansion plan should be pursued, possibly also addressing the issue of shortening the average LOS. As demonstrated in Experiments 3 and 4, shortening the LOS increases the efficiency of the system, requiring less ICU beds to serve the same population.
5 CONCLUDING REMARKS
This paper proposes a hybrid time series and queuing theory approach to address the problem of planning and operating a set of ICU beds that are regulated by a single center. The proposed model accounts for both the stochastic variation due to daily fluctuations in the demand for ICU beds and the temporal variation in the average daily demand. The latter one is due to population dynamics and other factors which are difficult to be determined and evaluated.
The time series approach makes the quantification of the temporal variation in the daily demand possible, while the queuing model enables the decision maker to design a more robust service system, which accounts for the variability in the demand in a short span of time. The proposed approach is applied successfully applied to the problem of operating and planning the expansion of the adult ICU beds run by the Rio State Central Regulation (CER). The results also suggest that the decree GM/MS #1.101/2002, which indicates the number of ICU beds as a function of the total population, may be inadequate for the current levels and characteristics of the demand. They also shed light into the operation of CER and indicate some issues that should be dealt with to reduce the waiting time for ICU beds.
ACKNOWLEDGMENTS
REFERENCES
[1] ANGUSD, KELLEYM, SCHMITZR & WHITEA, JRJP. 2000. Committee on manpower for pul-monary and critical care societies (COMPACCS): Caring for the critically ill patient. current and projected workforce requirements for care of the critically ill and patients with pulmonary disease: can we meet the requirements of an aging population?JAMA,284: 2762–2770.
[2] BLOWO, MAGLIOREL, CLARIDGEJ, BUTLER K & YOUNGJ. 1999. The golden hour and the silver day: Detection and correction of occult hypoperfusion within 24 hours improves outcome from major trauma.J. Trauma.,47: 964–969.
[3] BLUMENFELDD. 2010. Operations Research Calculations Handbook. CRC Press, Boca Raton.
[4] BOXG & JENKINSG. 1970. Time Series Analysis: Forecasting and Control, 4th edn. Wiley, New York.
[5] BREMAUD´ P. 1999. Gibbs fields, monte carlo simulation, and queues. Springer-Verlag, New York.
[6] BROCKWELLP & DAVISR. 1991. Time Series: Theory and Methods, 2nd edn. Springer, New York.
[7] CARDOENB, DEMEULEMEESTERE & BELIENJ. 2010. Operating room planning and scheduling: A literature review.European Journal of Operational Research,201(3): 921–932,http://dx. doi.org/10.1016/j.ejor.2009.04.011.
[8] CAYIRLI T & VERAL E. 2003. Outpatient scheduling in health care: A review of literature. Production and Operations Management, 12(4): 519–549, 10.1111/j.1937-5956.2003. tb00218.x.
[9] CHALFIND, TRZECIAKS, LIKOUREZOSA, BAUMANNB & DELLINGERR. 2007. DELAY-ED study group: Impact of delayed transfer of critically ill patients from the emergency department to the intensive care unit.Crit. Care Med.,35: 1477–1483.
[10] CHATFIELDC. 2000. Time-Series Forecasting. Chapman & Hall, New York.
[11] DATASUS. 2013. Departamento de inform´atica do sistema ´unico de sa ´ude – DATASUS.http: //www.datasus.gov.br.
[12] GARDNERE. 2006. Exponential smoothing: The state of the art – Part II.International Journal of Forecasting,22(4): 637–666,10.1016/j.ijforecast.2006.03.005.
[13] GARDNER E & MCKENZIE E. 2010. Why the damped trend works.Journal of the Operational Research Society,62(6): 1177–1180.
[14] GRIFFITHSJ, PRICE-LLOYDN, SMITHIESM & WILLIAMSJ. 2005. Modelling the requirement for supplementary nurses in an intensive care unit.J. Oper. Res. Soc.,56: 126–133.
[15] GUPTAD & DENTONB. 2008. Appointment scheduling in health care: Challenges and opportuni-ties.IIE Transactions,40(9): 800–819,10.1080/07408170802165880.
[16] HILLIER F & LIEBERMANG. 2010. Introduction to Operations Research, 9th edn. McGraw-Hill, New York.
[17] HYNDMANR & KHANDAKARY. 2008. Automatic time series forecasting: The forecast package for R.Journal of Statistical Software,27(3): 1–22.
[19] IBGE. 2013. Instituto brasileiro de geografia e estat´ıstica – IBGE.http://www.censo2010. ibge.gov.br.
[20] KIMS & HOROWITZI. 2002. Scheduling hospital services: the efficacy of elective-surgery quotas. Omega,30(5): 335–346,http://dx.doi.org/10.1016/S0305-0483(02)00050-6. [21] KLEINROCKL. 1975. Queueing Systems. Volume 1: Theory, vol 1. Wiley-Interscience, New York.
[22] LEVINP & SPRUNGC. 2001. The process of intensive care triage.Intensive Care Med.,27: 1441– 1445.
[23] LITVAKN,VANRIJSBERGENM, BOUCHERIERJ &VANHOUDENHOVENM. 2008. Managing the overflow of intensive care patients.European Journal of Operational Research,185(3): 998–1010,
http://dx.doi.org/10.1016/j.ejor.2006.08.021.
[24] MCMANUSM, LONGM, COOPERA & LITVAKE. 2004. Queuing theory accurately models the need for critical care resources.Anesthesiology,100(5): 1271–1276.
[25] MILNEE & WHITTYP. 1995. Calculation of the need for paediatric intensive care beds.Archives of Disease in Childhood,73(6): 505–507.
[26] PEARSONG, REYNOLDSF & STICKLEYJ. 2012. Calculating the need for intensive care beds. Archives of Disease in Childhood,97(11): 943–946,10.1136/archdischild-2011-301310. [27] R DEVELOPMENTCORETEAM. 2012. R: A language and environment for statistical computing.
R Foundation for Statistical Computing, Vienna,www.R-project.org/.2012.
[28] RIDGE J, JONES S, NIELSEN M & SHAHANI A. 1998. Capacity planning for intensive care units.European Journal of Operational Research,105(2): 346–355,http://dx.doi.org/10. 1016/S0377-2217(97)00240-3.
[29] RIVERSE, NGUYENB, HAVSTADS, RESSLER J, MUZZIN A, KNOBLICH B, PETERSONE & TOMLANOVICHM. 2001. Early goal-directed therapy collaborative group: Early goal-directed ther-apy in the treatment of severe sepsis and septic shock.N. Engl. J. Med.,345: 1368–1377.
[30] ROSSSM. 2009. Introduction to Probability and Statistics for Engineers and Scientists, 4th edn. Academic Press, Burlington MA.
[31] SADKIA, XIE X & CHAUVIN F. 2013. Planning oncologists of ambulatory care units. Decis. Support Syst.,55(2): 640–649,10.1016/j.dss.2012.10.020.
[32] SHMUELIA, SPRUNGC & KAPLANE. 2003. Optimizing admissions to an intensive care unit. Health Care Management Science,6(3): 131–136,10.1023/A:1024457800682.
[33] VAN HOUDENHOVENM, VANOOSTRUMJ, WULLINKG, HANS E, HURINK J, BAKKERJ & KAZEMIERG. 2008. Fewer intensive care unit refusals and a higher capacity utilization by using a cyclic surgical case schedule.Journal of Critical Care,23(2): 222–226,http://dx.doi.org/ 10.1016/j.jcrc.2007.07.002.
[34] WASSERMANL. 2004. All of Statistics. Springer, New York.
[35] YOUNGM, GOODER V, MCBRIDE K, JAMES B & FISHERE. 2003. Inpatient transfers to the intensive care unit: Delays are associated with increased mortality and morbidity.J. Gen. Intern. Med.,18: 77–83.
[36] ZHU Z, HEN B & TEOWK. 2012. Estimating ICU bed capacity using discrete event simulation.