www.eerp.usp.br/rlae
Corresponding Author:
Luciana Gonzaga dos Santos Cardoso
Faculdade de Ciências Médicas da Santa Casa de São Paulo Rua Doutor Cesário Mota Júnior, 61, 9º andar
Bairro: Vila Buarque
CEP: 01221-020, São Paulo, SP
The APACHE II measured on patients’ discharge from the Intensive
Care Unit in the prediction of mortality
1Luciana Gonzaga dos Santos Cardoso
2Paulo Antonio Chiavone
3Objective: to analyze the performance of the Acute Physiology and Chronic Health Evaluation (APACHE II), measured based on the data from the last 24 hours of hospitalization in ICU, for patients transferred to the wards. Method: an observational, prospective and quantitative study using the data from 355 patients admitted to the ICU between January and July 2010, who were transferred to the wards. Results: the discriminatory power of the AII-OUT prognostic index showed a statistically significant area beneath the ROC curve. The mortality observed in the sample was slightly greater than that predicted by the AII-OUT, with a Standardized Mortality Ratio of 1.12. In the calibration curve the linear regression analysis showed the R2 value to be statistically significant. Conclusion: the AII-OUT could predict mortality after discharge from ICU, with the observed mortality being slightly greater than that predicted, which shows good discrimination and good calibration. This system was shown to be useful for stratifying the patients at greater risk of death after discharge from ICU. This fact deserves special attention from health professionals, particularly nurses, in managing human and technological resources for this group of patients.
Descriptors: Intensive Care Units; Severity of Illness Index; APACHE; Hospital Mortality.
1 Paper extracted from Master’s Thesis “Desempenho do APACHE II medido na saída da UTI na previsão da letalidade” presented to Faculdade de Ciências Médicas da Santa Casa de São Paulo, São Paulo, SP, Brazil.
Rev. Latino-Am. Enfermagem 2013 May-June;21(3):811-9.
Introduction
The Acute Physiology and Chronic Health Evaluation II (APACHE II) Prognostic Index (PI) was developed to
estimate the severity of the illness and predict hospital
mortality, both for deaths occurring in the Intensive Care
Unit (ICU) and for those occurring on the wards after
discharge from ICU. For its calculation, one must take into account the worst values in the irst 24 hours of hospitalization in ICU, age, and the presence of chronic
illness previous to the hospitalization in ICU(1).
As the APACHE II interprets the severity of the
patient on admittance to ICU, the changes resulting
from the development of the illness over the period
of hospitalization are not taken into account, which
may reduce its capacity to predict hospital mortality,
principally for deaths occurring after the patient leaves
ICU.
Studies undertaken in Brazil over the last ive years
regarding hospital mortality in patients who received intensive care(2-3) have shown that greater mortality
occurs while the patient is hospitalized in ICU. However, a considerable number of patients die on the wards after discharge from the ICU(4-5).
The discharge of the patient from ICU takes place when the hemodynamic condition has been stabilized, and there is no further need for invasive mechanical ventilation or continuous monitoring and intensive care. Although the occurrence of death after discharge from ICU may be related to the natural progression of the illness, when all the therapeutic possibilities have been exhausted, it may also be the result of factors such as the limitation of human resources and availability of equipment, principally in services where semi-intensive care units are not available, or indeed may indicate premature discharge from ICU(6).
For this reason, it becomes highly important to
identify high risk patients who could beneit from either
a longer period of treatment in ICU or transference to a semi-intensive care unit.
This context provides the following research
problem: can the APACHE II prognostic index, measured
based on the worst values of the last 24 hours of
hospitalization in ICU, have good predictive capacity for
mortality after discharge from ICU?
The results from a study carried out in a tertiary
teaching hospital in Taiwan evidenced that the APACHE
II, measured on discharge from ICU was related to
mortality after discharge from ICU, and recommended
that the study be replicated with a larger sample size(7).
The present study aimed to analyze the performance of the APACHE II, measured based on the data from the last 24 hours of hospitalization in ICU, for patients transferred to the wards.
Method
An observational, prospective and quantitative study, approved by the Research Ethics Committee (REC) under protocol nº 312/08.
The study took place in an Intensive Care Service (ICS) which manages two hospitals located in the central region of the city of São Paulo, attending all the medical specialities: clinical and surgical. For selecting the sample, data was collected concerning the patients admitted to the ICS between 11th January and 10th July
2010. All were monitored prospectively until the hospital outcome. The inclusion criteria were to be aged 18 or over, and to be hospitalized in ICU for more than 24 hours. During the period of the study, 605 patients meeting the inclusion criteria were admitted to the ICS. Of this total, one hundred patients were excluded, these being: 63 re-admissions, eight hospital transferences or discharge from hospital direct from ICU and 29 cases of patient health records not containing all the information necessary for the data collection. Thus, 505 patients were prospectively analyzed, of whom 150 (29.7%) died during their stay in ICU and 355 (70.3%) were
transferred from ICU to the wards, constituting the
sample studied.
The variables collected for the general characterization of the sample were: sex, age, origin, type of hospitalization, length of hospitalization and outcome. The variables which make up the APACHE II prognostic index were collected as originally proposed(8). As rectal
temperature is not frequently measured in ICS, it was
decided to use the values of the axillary temperature
and add 0.6ºC(9). For the patients transferred to the
wards, data for APACHE II was collected again, this
time based on the worst values of the last 24 hours of
hospitalization in ICU. This was termed AII-OUT.
The data was inputted into a database developed using the Epi InfoTM program, version 3.5.2 for Windows.
The mean, median and standard deviation were presented in a descriptive form for each quantitative variable. The qualitative variables were presented in
The APACHE II calculation for risk of death was made using the formula (R/1-R) = 3.517 + (APACHE II x 0.146) + (0.603, if post-emergency surgery)
- (Diagnostic category coeficient)(8). The mortality
predicted by the APACHE II was obtained from the mean of all the risks of death from the sample studied.
The Standardized Mortality Rate was calculated by dividing the mortality observed in the sample by the mortality predicted by the APACHE II. Values equal to one indicate that the mortality predicted by the APACHE II was equal to that observed in the sample. Values below one indicate that the predicted mortality was greater than that observed, meaning that the index was over-estimating the deaths in the sample. Values greater than one indicate that the mortality predicted was less than that observed, and that the APACHE II had therefore under-estimated the mortality in the sample.
For each ive points of the AII-OUT, the calculation of sensitivity and speciicity was made, and a cut-off
point of “10 points” was established. The sample was divided into two groups (AII-OUT below 10 points and AII-OUT above 10 points) for analysis of deaths and discharges.
The Chi-squared test was used for comparing the two qualitative variables. The Student’s t-test was used for comparing the means in the independent samples.
The AII-OUT’s discriminatory power was demonstrated by the construction of a ROC curve (Receiver Operating Characteristic Curve) based on the
sensitivity and speciicity values for each point of the
curve.
The calibration curve was constructed for the calculation of the adjusted linear regression (R2) for
estimating the relationship between the predicted mortality (ranges of risk of death at every 10%) and the mortality observed (percentage of deaths for each
stratiied range of risk). The ranges of risk of death with a number of patients below or equal to ive were
excluded from the calibration curve, as, due to the small number of patients in these ranges, the calculation of the adjustment (R2 value) would be compromised.
The calculations were made using the SPSS
(Statistical Package for Social Sciences) program, version 13.0 for Windows. The level of signiicance adopted for the statistical tests was 5% (p<0.05).
Results
The mean age was 56.9±19.2 years, varying between 19 and 97 years, with a median of 57 years.
n %
Sex
Male 195 54.9
Female 160 45.1
Total 355 100.0
Age range (years)
18 to 29 39 11.0
30 to 44 55 15.5
45 to 59 97 27.3
60 to 74 83 23.4
75 and over 81 22.8
Total 355 100.0
Origin
Operating Room 197 55.5
Emergency Room 91 25.7
Ward 53 14.9
Others* 14 3,9
Total 355 100.0
Type of hospitalization
Clinical 145 40.8
Elective surgery 121 34.1
Emergency surgery 89 25.1
Total 355 100.0
Length of hospitalization (days)
< 4 73 20.6
4 to 7 97 27.3
8 to 15 84 23.7
16 to 30 49 13.8
> 30 52 14.6
Total 355 100.0
Hospital outcome
Discharge 316 89.0
Death 39 11.0
Total 355 100.0
Table 1 – Distribution of the sample, according to demographic and clinical data. São Paulo, SP, Brazil, 2010 (n=355)
*hemodynamic, semi-intensive
The AII-OUT’s mean was 10.1±4.4 points. It varied from 1 to 29, with a median of 10.
Of the 355 patients, 39 died, totalling 11.0% of the sample. Among these, the AII-OUT’s mean was 14.8±5.2 points, and among the 316 patients who were discharged from hospital, it was 9.6±4.0 points,
with a statistically signiicant difference between them
(p<0.001).
The sensitivity and speciicity were calculated for the AII-OUT, and their values identiied in cut-off points at every ive points (Table 2).
Rev. Latino-Am. Enfermagem 2013 May-June;21(3):811-9.
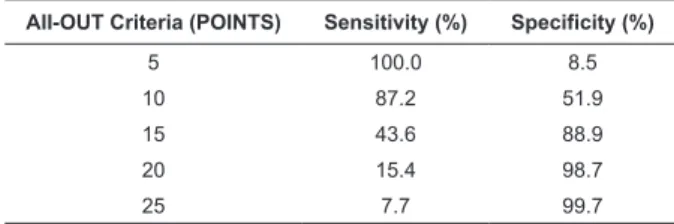
Table 2 – Sensitivity and speciicity of the AII-OUT’s cut-off points at every ive points. São Paulo, SP, Brazil, 2010 (n=355)
AII-OUT Criteria (POINTS) Sensitivity (%) Specificity (%)
5 100.0 8.5
10 87.2 51.9
15 43.6 88.9
20 15.4 98.7
25 7.7 99.7
It may be observed that the sensitivity of the index reduces progressively in line with the increase in the
AII-OUT score (100.0 to 7.7%), inversely to the speciicity,
which increases in line with the increase in the score (8.5 to 99.7%).
Due to the fact that the sensitivity measures the index’s capacity to correctly identify death and that
speciicity is related to identifying survival rates, it
was decided to prioritize sensitivity. “10 points” was established as the cut-off point for analysis of the AII-OUT – that is, the last point at which sensitivity was
greater than speciicity.
Figure 1 presents the sample, divided into two groups (deaths and discharges), in line with the cut-off point of 10 points for the AII-OUT, with a statistically
signiicant difference between them. (p<0.001)
Of the 39 patients who died, 32 (82.1%) had an AII-OUT score greater than 10, and 7 (17.9%) less than 10 (Figure 1)
Figure 1 – Distribution of deaths and discharges in line with the cut-off point of 10 points on the AII-OUT. São Paulo, SP, Brazil, 2010 (n=355)
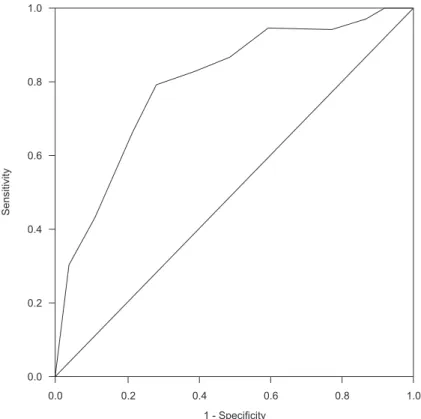
The AII-OUT prognostic index’s discriminatory
power demonstrated an area under the ROC curve
(Receiver operating characteristic curve) of 0.801,
statistically signiicant with p<0.001 (Figure 2).
The mortality observed in the sample was 11.0%. The mortality predicted by the AII-OUT (risk of death) was 9.8%, with a Standardized Mortality Ratio (SMR) of 1.12.
The calibration curve was constructed for calculating the adjusted linear regression estimating the relationship
between the predicted mortality (ranges of risk of death
stratiied at every 10%) and the mortality observed (percentage of deaths for each stratiied risk range).
For the AII-OUT, the ranges of risk of death varied from 10% to 70%. The range of 50% had two patients, and the ranges of 60% and 70% had one patient each. Due to this, they were excluded, so as not to compromise the value of the adjustment (R2). In the linear regression
Figure 2 – The AII-OUT’s discriminatory power, according to the
Receiver operating characteristic curve (ROC). São Paulo, SP, Brazil,
2010 (n=355)
Rev. Latino-Am. Enfermagem 2013 May-June;21(3):811-9.
Discussion
Various Brazilian and international studies have aimed to assess the prognostic indices(10-11). The
relevance of these systems’ use in ICU is already established in the literature, and they are considered important indicators for assessing the care given to the critically-ill patient(12).
The APACHE system was the irst prognostic index
developed to assess risk of death in ICU. Of the four versions published, the APACHE II has been the most used, because it is easy to apply and its variables are easily collected routinely. Due to this it has also been widely assessed in various research(5,7,13).
The APACHE II was developed to be used based on
data from the irst 24 hours following admission to ICU
and, based on this data, to estimate the risk of death during in-patient treatment, even after the patient has left ICU. The objective was to cause data collection for the calculation of the APACHE II to be undertaken as early as possible, as that way, the values would be independent of the treatment instituted in the ICU.
The studies show different results in relation to the capacity to predict death using the APACHE II(14-15).
Generally speaking, the literature points to the APACHE II’s good performance when used in general ICU(10). When compared to indices developed for speciic groups
of patients, its capacity to predict mortality reduces(16), except when modiications in the structure occur,
with the inclusion of new variables which improve its performance(17).
One study carried out in 2007(7) assessed the
possibility of using APACHE II on discharge from the ICU, as it was believed that the organic dysfunction of the patient on discharge from ICU was an important prognostic factor for death on the wards. That being so, the present study was developed based on the same benchmark, in the attempt to assess whether the APACHE II undertaken on discharge from the ICU presented a better capacity for predicting mortality after discharge from the ICU.
In the assessment of the AII-OUT, in the present study, a mean of 10.1 points was ascertained, below the mean of 17.05 found in the 2007 study(7), in which the
index was also calculated based on the data from the last 24 hours spent in the ICU. Note that in the above-mentioned study, the sample was made up entirely of clinical patients, whereas the present study included both clinical and surgical patients.
Based on the values for sensitivity and speciicity,
it was decided to establish the AII-OUT’s cut-off point at 10 points, to analyze the deaths and survival rates in the sample.
Of the 39 patients who died, 32 (82.1%) had an
AII-OUT score above 10 points, a statistically signiicant
difference in relation to the patients who had an AII-OUT score below or equal to ten. Thus, it is deduced that the AII-OUT score higher than ten was related to higher mortality in the sample.
In the other study in which the APACHE II prognostic index was also assessed on discharge from the ICU(7), based on the sensitivity and speciicity, the cut-off point
established was 17 points. In the same study, of the patients who had scores higher than 17, 37.3% died on the wards. Among the patients with scores below 17, 9.4% died on the wards.
It was also observed that a smaller portion, that is, seven patients (17.9%) who died (Figure 2) left ICU with an AII-OUT score of up to ten points. In spite of this number of patients being small, this impeding the analysis of this data, some characteristics were found in this group which called attention. Regarding the type of hospitalization, four patients were clinical and three were post-emergency surgery, all neurosurgery. None of these patients was post-elective surgery. The length of hospitalization on the ward varied from two to 129 days, with a mean of 35±46 days. In four patients, the length of hospitalization was greater than 15 days.
The prognostic indices’ discriminatory power, that is, the power to discriminate deaths from survival rates, is assessed by the area under the ROC curve. A prognostic index totally incapable of discriminating the patients who die from those who survive has an area under the curve of 0.5. The greater the index’s capacity to discriminate death from survival, the greater the area under the curve and, consequently, the more this approaches the top left corner of the graph. In this case, the value would be close to one.
In the analysis of the ROC curve for the prognostic indices, the area under the curve must be greater than 0.70. Values higher than 0.80 are considered good, and over 0.90, excellent(18).
Brazilian studies undertaken in the same service obtained an area under the ROC curve of 0.801(10) and
0.729(19). These studies assessed the performance of
on admission of the patient to ICU, and an area of 0.746 when the patient was discharged(7). The sample’s proile,
in addition to the characteristics themselves of the care and the service in different countries, may explain the difference in the area under the ROC curve, and consequently the difference in the index’s discriminatory capacity.
In this study, the area found for the AII-OUT was 0.801, which showed the index’s good discriminatory power.
The Standardized Mortality Ratio (SMR) is obtained through the relationship between the mortality observed and the predicted mortality. The present study found a SMR for the AII-OUT with a value of 1.12. In the two studies previously carried out in the same ICU, SMR were found with values of 1.39(10) and 1.21(19), in 2005.
A study undertaken in Holland, published in 2011(20),
carried out with surgical patients, found a SMR of 1.19. It is worth highlighting that the present study analyzed patients transferred to the wards, not taking into account the mortality observed in ICU. In the analysis of the 505 patients admitted to the ICU in the period studied, the SMR was 1.61.
It is noteworthy that the present study has limitations which must be considered: it was carried out in a single Intensive Care Service, there being, therefore, the need for assessment in other hospitals
to conirm the AII-OUT’s discrimination and calibration;
in spite of this study’s sample being higher than that of the study whose APACHE II was also analyzed on discharge from the ICU(7), when stratiied, there was a
small number of patients with ranges of risk of death above 40%, compromising the possibility of assessing the AII-OUT for ranges of risk of death of over 50%.
The APACHE II was developed taking into account
variables which were tested and identiied as predictors of death, to be measured in the irst 24 hours of
hospitalization in ICU. For this reason, further studies are necessary to ascertain whether these same variables are also appropriate to be measured when the patient leaves ICU.
In spite of the prognostic indices being used predominantly for assessing severity some studies have shown that the greater the severity of the patient, the higher the demands for nursing care(21-22).
This being so, it is understood that the use of the AII-OUT by the nurse: can be useful to stratify the patients at higher risk of death after discharge from the ICU - this fact deserves special attention because
patient during their hospitalization in ICU, and many leave ICU still with a high demand for support, which is not supplied by the resources offered on the wards, in this way substantiating the need for implantation of semi-intensive care units(21); can be useful as a Patient Classiication System, in addition to the systems which
assess the nursing workload(23), providing the nurse
with objective evidence for justifying the need to adjust the nursing workforce, or, further, for directing the resources available to the patients at higher risk; can be useful, from the care point of view, in assisting with the establishment of priorities; and can be
useful in the identiication of patients at higher risk
of re-hospitalization in ICU(22,24), with the objective of
establishing interventions which reduce the occurrence
of re-admissions, and in the identiication of patients who may beneit from a longer stay in ICU.
These factors must be widely considered and assessed by health professionals, in particular by the nurses, in managing human and technological resources and in understanding the importance of adapting the nursing workforce for the promotion of safe care for this group of patients(25). Thus, the prognostic indices,
like the systems for quantifying nursing care, must be used as administrative tools which are essential for the quality of the service provided.
The studies published in the last two years(20-25)
on Severity of Illness Index and nursing workload support these assertions and indicate the need for further research to extend knowledge in this area, and contribute to providing a foundation for the nurse’s practical care and management.
Conclusion
The present study’s results allow the conclusion that the AII-OUT was able to predict mortality after discharge from the ICU, with the mortality observed being slightly greater than that predicted, demonstrating good discrimination and good calibration.
Acknowledgments
Rev. Latino-Am. Enfermagem 2013 May-June;21(3):811-9.
References
1. Knaus WA, Zimmermann JE, Wagner DP, Draper EA, Lawrence DE. APACHE - acute physiology and chronic health evaluation: a physiologically based classification system. Crit Care Med. 1981;9(8):591-7.
2. Alves GC, Silva GB Jr, Lima RSA, Sobral JB, Mota RMS, Abreu KLS, et al. Fatores de risco para óbito em pacientes idosos gravemente enfermos. Rev Bras Ter Intensiva. 2010;22(2):138-43.
3. Silva JM Jr, Malbouisson LMS, Nuevo HL, Barbosa LGT, Marubayashi LY, Teixeira IC, et al. Aplicabilidade do escore fisiológico agudo simplificado (SAPS 3) em hospitais brasileiros. Rev Bras Anestesiol. 2010;60(1):20-31. 4. Oliveira CD, Peixoto LC, Nangino GO, Correia PC, Isoni CA. Aspectos epidemiológicos de pacientes traqueostomizados em unidade de terapia intensiva adulto de um hospital de referência ao Sistema Único de Saúde em Belo Horizonte. Rev Bras Ter Intensiva. 2010;22(1):47-52.
5. Freitas ERFS. Profile and severity of the patients of intensive care units: prospective application of the APACHE II index. Rev. Latino-Am. Enfermagem. 2010;18(3):317-23.
6. Daly K, Beale R, Chang RWS. Reduction in mortality after inappropriate early discharge from intensive care unit: logistic regression triage model. Br Med J. 2001; 322(7297):1274-6.
7. Chen YC, Lin MC, Lin YC, Chang HW, Huang CC, Tsai YH. ICU discharge APACHE II scores help to predict post-ICU death. Chang Gung Med J. 2007;30(2):142-50. 8. Knaus WA, Draper EA, Wagner DP, Zimmerman JE. APACHE II: a severity of disease classification system. Crit Care Med. 1985;13(10):818-29.
9. Sund-Levander M, Forsberg C, Wahren LK. Normal oral, rectal, tympanic and axillary body temperature in adult men and women: a systematic literature review. Scand J Caring Sci. 2002;16(2):122–8.
10. Chiavone PA, Sens YAS. Evaluation of APACHE II system among intensive care patients at a teaching hospital. São Paulo Med J. 2003;121(2):53-7.
11. Sakr Y, Krauss C, Amaral AC, Réa-Neto A, Specht M, Reinhart K, et al. Comparison of the performance of SAPS II, SAPS 3, APACHE II, and their customized prognostic models in a surgical intensive care unit. Br J Anaesth. 2008;101(6):798–803.
12. Batista CC, Gattass CA, Calheiros TP, Moura RB. Avaliação prognóstica individual na UTI: é possível diferenciar insistência terapêutica de obstinação
terapêutica? Rev Bras Ter Intensiva. 2009;21(3):247-54. 13. Joe BH, Jo U, Kim HS, Park CB, Hwang HJ, Sohn IS, et al. APACHE II score, rather than cardiac function, may predict poor prognosis in patients with stress-induced cardiomyopathy. J Korean Med Sci. 2012;27(1):52-7. 14. Zanon F, Caovilla JJ, Michel RS, Cabeda EV, Ceretta DF, Luckemeyer GD, et al. Sepse na unidade de terapia intensiva: etiologias, fatores prognósticos e mortalidade. Rev Bras Ter Intensiva. 2008;20(2):128-34.
15. Doerr F, Badreldin AMA, Heldwein MB, Bossert T, Richter M, Lehmann T, et al. A comparative study of four intensive care outcome prediction models in cardiac surgery patients. J Cardiothorac Surg. 2011;6:21. doi:10.1186/1749-8090-6-21.
16. Fernandes NMS, PintoII PS, Lacet TBP, Rodrigues DF, Bastos MG, Stella SR, et al. Uso do escore prognóstico APACHE II e ATN-ISS em insuficiência renal aguda tratada dentro e fora da unidade de terapia intensiva. Rev Assoc Med Bras. 2009;55(4):434-41.
17. Mercado-Martínez J, Rivera-Fernández R, Aguilar-Alonso E, García-Alcántara A, Estivill-Torrull A, Aranda-León A, et al. APACHE-II score and Killip class for patients with acute myocardial infarction. Intensive Care Med. 2010;36(9):1579–86.
18. Strand K, Flaatten H. Severity scoring in the ICU: a review. Acta Anaesthesiol Scand. 2008;52(4):467-78. 19. Chiavone PA, Rasslan S. Influence of time elapsed from end of emergency surgery until admission to intensive care unit, on Acute Physiology and Chronic Health Evaluation II (APACHE II) prediction and patient mortality rate. Sao Paulo Med J. 2005;123(4):167-74. 20. Timmers TK, Verhofstad MH, Moons KG, Leenen LP. Long-term survival after surgical intensive care unit admission - fifty percent die within 10 years. Ann Surg. 2011;253(1):151-7.
21. Silva MCM, Sousa RMC, Padilha KG. Patient Destination after Discharge from Intensive Care Units: Wards or Intermediate Care Units? Rev. Latino-Am. Enfermagem. 2010;18(2):224-32.
22. Silva MCM, Sousa RMC, Padilha KG. Factors associated with death and readmission into the Intensive Care Unit. Rev. Latino-Am. Enfermagem. 2011;19(4):911-9. 23. Brito AP, Guirardello EB. Nursing workload in an inpatient unit. Rev Latino-Am Enfermagem. 2011;19(5):1139-45.
Received: July 5th 2012