ISSN 0104-6632 Printed in Brazil
www.abeq.org.br/bjche
Vol. 32, No. 03, pp. 637 - 646, July - September, 2015 dx.doi.org/10.1590/0104-6632.20150323s00003389
*To whom correspondence should be addressed
Brazilian Journal
of Chemical
Engineering
THERMODYNAMIC PROPERTIES OF
NONAQUEOUS SINGLE SALT SOLUTIONS USING
THE Q-ELECTROLATTICE EQUATION OF STATE
A. Zuber
1, R. F. Checoni
2and M. Castier
2*1Departamento de Engenharia Química, Universidade Estadual de Maringá,
Av. Colombo 5790, 87020-900, Maringá - PR, Brazil.
2Chemical Engineering Program, Texas A&M University at Qatar,
326C Texas A&M Engineering Building, Education City. PO Box 23874, Doha, Qatar. Phone: + 974 4423.0534
E-mail: [email protected]
(Submitted: March 26, 2014 ; Revised: September 25, 2014 ; Accepted: October 1, 2014)
Abstract - The correlation of thermodynamic properties of nonaqueous electrolyte solutions is relevant to design and operation of many chemical processes, as in fertilizer production and the pharmaceutical industry. In this work, the Q-electrolattice equation of state (EOS) is used to model vapor pressure, mean ionic activity coefficient, osmotic coefficient, and liquid density of sixteen methanol and ten ethanol solutions containing single strong 1:1 and 2:1 salts. The Q-electrolattice comprises the lattice-based Mattedi-Tavares-Castier (MTC) EOS, the Born term and the explicit MSA term. The model requires two adjustable parameters per ion, namely the ionic diameter and the solvent-ion interaction energy. Predictions of osmotic coefficient at 298.15 K and liquid density at different temperatures are also presented.
Keywords: Methanol; Ethanol; Electrolytes; Equation of state.
INTRODUCTION
Electrolyte solutions are broadly found in many natural and industrial processes. Most of them deal with solutions containing salts dissolved in water, such as seawater desalination and wastewater treat-ment. However, in fertilizer production, pharma-ceutical industries, and in equipment such as absorp-tion, distillaabsorp-tion, and extracabsorp-tion, nonaqueous electro-lyte solutions play an important role. The correlation and prediction of their thermodynamic properties are essential to the design and operation of these equip-ments and processes.
There are few publications about models applied to correlate thermodynamic properties of
coefficient, and solvent activity.
On the other hand, equations of state (EOSs) have also been used to determine thermodynamic proper-ties of electrolyte solutions in nonaqueous solvents. Zuo and Fürst (1997) applied an EOS constituted of four terms (one repulsive term, two attractive short-range terms, and one long-short-range term) to correlate vapor pressures and mean ionic activity coefficients of single salts in methanol, ethanol, 2-propanol, and acetonitrile solutions. Held et al. (2012) employed the ePC-SAFT EOS in order to correlate liquid den-sities, osmotic coefficients, and mean ionic activity coefficients at 298.15 K of single salts in methanol and ethanol solutions, presenting also new experi-mental data for many electrolyte systems.
In this work, the Q-electrolattice EOS, which has been successfully applied to aqueous single and mixed salt solutions (Zuber et al., 2014), is used to correlate thermodynamic properties of single salts in methanol and ethanol solutions. This model consists of the lattice-based Mattedi-Tavares-Castier (MTC) EOS, along with the Born and explicit MSA terms. In this EOS, the cation and anion diameters are fit-ted, as well as the energetic effects presented by interactions between solvent – cations, or – anions. A model performance analysis is presented based on the correlations of the thermodynamics properties of sixteen methanol and ten ethanol solutions contain-ing scontain-ingle strong 1:1 and 2:1 salts.
Q-ELECTROLATTICE EQUATION OF STATE
The Q-electrolattice EOS was developed con-sidering a methodology proposed by Myers et al. (2002). For that, the interactions between species in an electrolyte mixture are taken into account by add-ing the contribution of different terms to the Helm-holtz energy. This sum is the result of a thermody-namic path suitable to describe the behavior of elec-trolyte solutions accurately. The residual Helmholtz energy (AR) to form an electrolyte solution along
the mentioned path is:
( , , )n
R MTC Born MSA
A T V A A A (1)
in which the AMTC termis the contribution to the Helmholtz energy related to the repulsive and attrac-tive effects proposed originally by Mattedi et al. (1998); the ABorn term represents the contribution to the short-range interactions associated with the solvation effects; and the AMSA term represents the long-range interactions due to the presence of elec-trolytes in the solution (Blum, 1988; Clarke and Bishnoi, 2004; Baseri and Lotfallahi, 2011). The complete development of each term of the Q-electro-lattice EOS can be found in detail elsewhere (Zuber et al., 2014).
The dielectric constant is present in both Born and MSA terms in the Q-electrolattice EOS. Its evaluation is performed by coupling the Pottel model for dielectric constant presented by Zuo and Fürst (1997) to the EOS. This model takes into account the change in the dielectric constant of the solvent due to the presence of electrolytes. The dielectric constant of the solvent is expressed in the form of a polyno-mial equation, for temperatures in Kelvin, as follows:
2 3 2
1 3 4 5
s
d
D d d T d T d T
T (2)
in which DS is the pure solvent dielectric constant, and d1–d5 are parameters.
The parameters of Eq. (2) are presented in Table 1. For ethanol, the parameters are equal to those presented by Zuo and Fürst (1997). For methanol, new parameters have been obtained based on the experimental dielectric constant presented by Davidson (1957) and Shirke et al. (2000), in a temperature range from 176.60 to 318.15 K. The average absolute relative deviation (AARD(%)) for dielectric constant of methanol obtained with the new set of parameters is 1.81%.
Table 1: Parameters of dielectric constant in Eq. (2).
Solvent d1 d2 d3 d4 d5 T (K)
Brazilian Journal of Chemical Engineering Vol. 32, No. 03, pp. 637 - 646, July - September, 2015
RESULTS AND DISCUSSION Pure Solvents
The methanol and ethanol representations applied in this work are similar to the water representation used by Zuber et al. (2014), in which the solvent molecule is divided into three regions: an electron-donor (α), an electron-acceptor (β), and a dispersion group (D). The solvent parameters were obtained by simultaneous regression of vapor pressure and liquid density data using the MTC EOS. It is important to
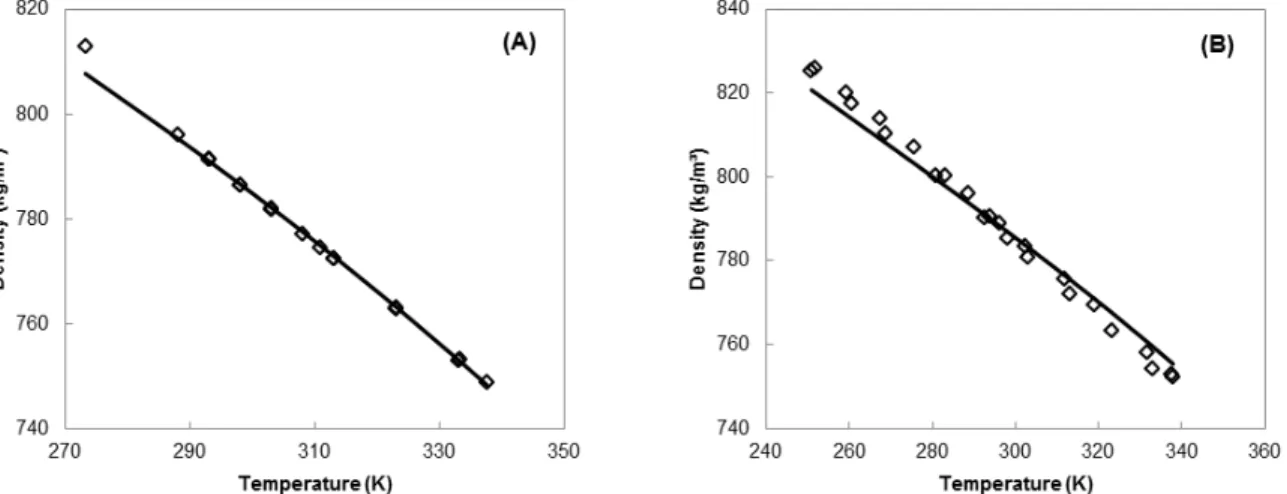
stress that these parameters were obtained in this way because the Q-electrolattice EOS reduces to the MTC EOS in the absence of electrolytes. The average absolute relative deviations of vapor pressure for methanol and ethanol are 0.60% (258.54 – 513.15 K) and 2.25% (269.85 – 507.49 K), respectively; the deviations for liquid density are 0.07% (273.15 – 337.65 K) and 0.35% (250.85 – 337.95 K), respectively. Table 2 presents the solvent parameters. Figures 1 and 2 also present the behavior correlated by the MTC EOS for such properties for both pure solvents.
Table 2: MTC EOS parameters for methanol and ethanol.
Solvent D
Q Q Q r u0D D
R
(K) BD D (K) u0 R
(K)
Methanol 1.9398 1.5782 0.3488 5.6695 –199.0559 230.2825 –1877.0543 Ethanol 3.1387 1.7275 0.2098 8.6277 –153.8439 146.2570 –2149.8386
Figure 1: Correlation of vapor pressure of pure methanol (A) and pure ethanol (B): MTC EOS (−) and experimental data (○).
Figure 1 shows that the vapor pressures of pure methanol (Ramsay and Young, 1887; Young, 1909) and pure ethanol (Richardson, 1886; Kalafati et al., 1967; Mousa, 1987; Diogo et al. 1995; Khoiroh and Lee, 2011) are in good agreement with the experi-mental data in the studied temperature range. Figure 2 shows that the methanol liquid density (Gmehling, 2012) tends to be underestimated at temperatures below 290 K, while for the ethanol (Gmehling, 2012) this occurs below 280 K. In addition, the ethanol liquid density is slightly overestimated above 300 K.
Single Salt Nonaqueous Solutions
The Q-electrolattice EOS uses two adjustable pa-rameters per ion to calculate many thermodynamic properties of electrolyte solutions. These parameters are the ion-solvent interaction energy and the ionic diameter. Many assumptions lead to reducing the number of parameters of the Q-electrolattice to only two. One of them is that the interactions between solvent regions (α, β, D) and a given ion are equiva-lent. A complete description of the assumptions is available elsewhere (Zuber et al., 2014). They are also used in this work to fit the parameters of nonaqueous electrolyte solutions.
Three thermodynamic properties are used to fit the adjustable parameters of the Q-electrolattice EOS: experimental mean ionic activity coefficients and liquid densities, both at 298.15 K, and vapor pressure data at various temperatures, of single strong electrolytes in methanol or ethanol solutions.
The fitting procedure is based on the simultane-ous correlation of these three thermodynamic proper-ties of several single salt solutions. For methanol, sixteen systems (salt + solvent) formed by six cations (Li+, Na+, K+, Rb+, Cs+, Ca2+) and five anions (Cl–, Br-, I–, NO3–, ClO4–) are used; for ethanol, 10
sys-tems formed by four cations (Li+, Na+, K+, Ca2+) and four anions (Cl–, Br–, I–, NO3–) are considered. The
adjustable parameters of the Q-electrolattice EOS are determined by minimizing the objective function (OF):
2 2
1 1
2
1
Np calc exp Np calc exp
i i i i
exp exp
i i
i i
Np calc exp
i i exp i i P P OF P
(3)in which Picalc, calci , icalc denote the calculated values of vapor pressure, mean ionic activity coeffi-cient, and density, respectively, Piexp, expi , iexpare
the values of their experimental counterparts, and Np is the number of points.
Table 3 presents the Q-electrolattice adjustable parameters for the ions in the investigated solutions. For both solvents, the diameters of alkali ions in-crease according to the sequence in the periodic ta-ble. It is also noteworthy that the alkali ions in etha-nol are larger than in methaetha-nol. For monoatomic anions, only the diameters in ethanol follow the trend of the periodic table. For the polyatomic anion NO3–,
it can be observed that its fitted diameter is larger in ethanol than in methanol. Also, the energy interac-tion parameters increase with increasing diameters for alkali ions in both solvents.
Table 3: Adjustable parameters for the Q-electro-lattice EOS.
Methanol Ethanol
Ion i(Å) 0 solvent ion u
R
(K) i(Å) u0solvent ion R
(K)
Li+ 0.1369 –1927.6277 3.9567 –889.4550
Na+ 0.5793 –629.0227 4.6200 –260.4268 K+ 1.3607 –21.1366 5.4007 –51.8070 Rb+ 1.5019 86.0697 – –
Cs+ 2.2760 488.7214 – – Ca2+ 2.2808 –451.3620 4.8583 179.4095 Cl– 2.4641 –1274.9423 0.6453 145.5244 Br– 2.6780 –1229.2235 1.6987 –16.7562 I– 1.1449 –1980.8884 6.6128 –246.1883
NO3– 2.6744 –313.8667 3.3814 –37.9322
ClO4– 2.3030 –1385.6736 – –
Table 4 shows the Pauling’s bare ion diameters, and the fitted ionic diameters for use with the Q-electrolattice EOS in aqueous solutions (Zuber et al., 2014) and in methanol or ethanol solutions (present work). The diameters of alkali metals increase in the order (Li+<Na+<K+) in all cases. Similar trend is observed for halides (Cl–<Br–<I–), with exception of I– in methanol, whose diameter is smaller than Br–.
Table 4: Comparison of fitted diameters of some solvated ions in water (Zuber et al., 2014), metha-nol, and ethanol (present work) using the Q-electrolattice EOS. Pauling diameters of bare ions are presented as reference.
Diameter (Å)
Ion In Methanola Pauling Bare Ionb In Waterc In Ethanola Li+ 0.14 1.20 1.85 3.96 Na+ 0.58 1.90 2.32 4.62
K+ 1.36 2.66 3.45 5.40 Ca2+ 2.28 2.36 2.82 4.86
Cl– 2.46 3.62 2.35 0.64 Br– 2.68 3.90 2.95 1.70 I– 1.14 4.32 3.63 6.61
a
This work; b
(Horvath, 1985); c
Brazilian Journal of Chemical Engineering Vol. 32, No. 03, pp. 637 - 646, July - September, 2015 For all the cations in Table 4, it is observed that
cation cation cation cation
methanol Pauling water ethanol
, but there is no
similar trend for the anions. According to the litera-ture (Monica and Senatore, 1970; Zipp, 1974; Marcus, 1991), the diameters of ions in solution should fol-low the trend: waterion methanolion ethanolion . However, all the fitted ion diameters in methanol, except Cl–, are smaller than in water.
On average, the fitted diameters of the cations in water and ethanol solutions are 31% and 146% larger than Pauling’s diameters; in methanol solutions, they are 53% smaller. The fitted anion diameters in water, methanol, and ethanol, are 25%, 46%, and 29% smaller than Pauling’s diameters. These results sug-gest that the effect of the solvent on cation diameter is bigger than on anion diameter. Regardless of this observation, our experience with the Q-electrolattice EOS is that fitting the ion diameters is important to
the overall model accuracy.
Table 5 presents the correlated vapor pressure, mean ionic activity coefficients at 298.15 K, and densities of nonaqueous solutions containing strong electrolytes. It also contains the calculations of os-motic coefficients at 298.15 K. To calculate the aver-age absolute relative deviation (AARD(%)) of such thermodynamic properties, the following equation is used:
1 100 (%)
Np calc exp
exp i
val val
AARD
Np val (4)
In Eq. (4), valcalc is the calculated value for vapor pressure, mean ionic activity coefficient, or density obtained by the Q-electrolattice EOS; valexp is the experimental value of the same thermodynamic property obtained from the literature.
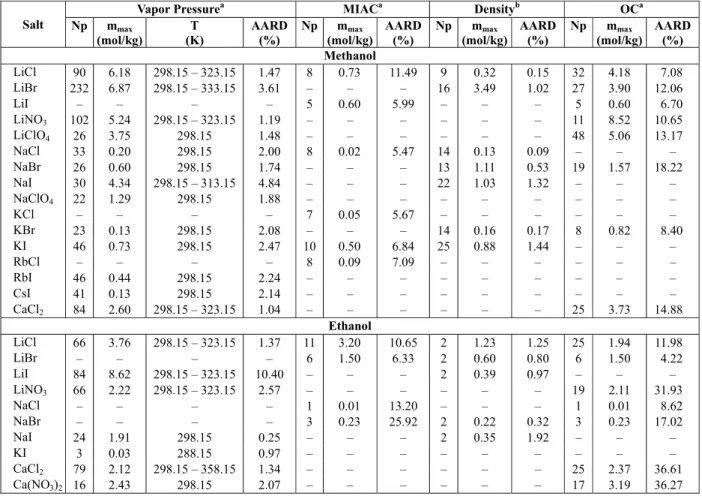
Table 5: Average absolute relative deviation (AARD (%)) for the vapor pressure, mean ionic activity coefficient (MIAC), density, and osmotic coefficient (OC) of solutions containing strong electrolytes in methanol and ethanol determined by Q-electrolattice EOS.
Salt
Vapor Pressurea MIACa Densityb OCa
Np mmax
(mol/kg)
T (K)
AARD (%)
Np mmax
(mol/kg)
AARD (%)
Np mmax
(mol/kg)
AARD (%)
Np mmax
(mol/kg)
AARD (%) Methanol
LiCl 90 6.18 298.15 – 323.15 1.47 8 0.73 11.49 9 0.32 0.15 32 4.18 7.08 LiBr 232 6.87 298.15 – 333.15 3.61 – – – 16 3.49 1.02 27 3.90 12.06 LiI – – – – 5 0.60 5.99 – – – 5 0.60 6.70 LiNO3 102 5.24 298.15 – 323.15 1.19 – – – – – – 11 8.52 10.65
LiClO4 26 3.75 298.15 1.48 – – – – – – 48 5.06 13.17
NaCl 33 0.20 298.15 2.00 8 0.02 5.47 14 0.13 0.09 – – – NaBr 26 0.60 298.15 1.74 – – – 13 1.11 0.53 19 1.57 18.22 NaI 30 4.34 298.15 – 313.15 4.84 – – – 22 1.03 1.32 – – – NaClO4 22 1.29 298.15 1.88 – – – – – – – – –
KCl – – – – 7 0.05 5.67 – – – – – –
KBr 23 0.13 298.15 2.08 – – – 14 0.16 0.17 8 0.82 8.40 KI 46 0.73 298.15 2.47 10 0.50 6.84 25 0.88 1.44 – – –
RbCl – – – – 8 0.09 7.09 – – – – – –
RbI 46 0.44 298.15 2.24 – – – – – – – – – CsI 41 0.13 298.15 2.14 – – – – – – – – – CaCl2 84 2.60 298.15 – 323.15 1.04 – – – – – – 25 3.73 14.88
Ethanol
LiCl 66 3.76 298.15 – 323.15 1.37 11 3.20 10.65 2 1.23 1.25 25 1.94 11.98 LiBr – – – – 6 1.50 6.33 2 0.60 0.80 6 1.50 4.22 LiI 84 8.62 298.15 – 323.15 10.40 – – – 2 0.39 0.97 – – – LiNO3 66 2.22 298.15 – 323.15 2.57 – – – – – – 19 2.11 31.93
NaCl – – – – 1 0.01 13.20 – – – 1 0.01 8.62 NaBr – – – – 3 0.23 25.92 2 0.22 0.32 3 0.23 17.02 NaI 24 1.91 298.15 0.25 – – – 2 0.35 1.92 – – – KI 3 0.03 288.15 0.97 – – – – – – – – – CaCl2 79 2.12 298.15 – 358.15 1.34 – – – – – – 25 2.37 36.61
Ca(NO3)2 16 2.43 298.15 2.07 – – – – – – 17 3.19 36.27
a
(Gmehling, 2012); b
(Pasztor and Criss, 1978; Held et al., 2012); Np is the number of experimental points; mmax is the maximum molality.
Table 5 shows that the Q-electrolattice EOS is able to correlate vapor pressures satisfactorily in both methanol and ethanol solutions, with most deviations below 3.0%. An exception is the LiI + ethanol solu-tion, whose vapor pressure AARD value is 10.4%. Furthermore, the model shows accurate results when correlating liquid density at 298.15 K of nonaqueous single salt solutions, with deviations below 2.0% for both solvents.
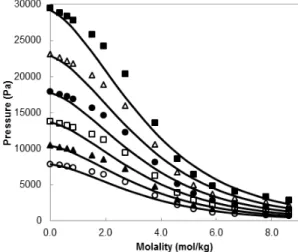
Figure 3 shows the effect of temperature and salt concentration on the correlated vapor pressures of LiI + ethanol solutions. At low salt concentrations, the calculations with the Q-electrolattice EOS are in good agreement with experimental data, and con-verge correctly to the vapor pressure of pure ethanol at any temperature. However, the Q-electrolattice EOS underestimates this property at concentrations between 1.0 and 4.0 molal, and overestimates it be-tween 4.0 and 7.0 molal. The deviations found in these intermediate concentrations reach 18.0%, on average. At the maximum available salt concentra-tion (8.62 molal), the deviaconcentra-tion between the model’s outcomes and experimental data are 20.0%, on aver-age. Regarding temperature, the deviations at a given salt concentration tend to be lower at high tempera-tures. For example, at 2.7 molal, the deviations at 298.15 and 323.15 K are 18.9% and 16.0%, respec-tively; at 8.6 molal, they are 21.3% and 18.7%, re-spectively.
Figure 3: Correlation of vapor pressure of LiI in ethanol using the Q-electrolattice EOS (−) and ex-perimental data (Gmehling, 2012) at 298.15 K (○), 303.15 K (▲), 308.15 K (□), 313.15 K (●), 318.15 K (∆), and 323.15 K (■).
Table 5 shows that the Q-electrolattice EOS ex-hibits significant deviations when used to correlate
the mean ionic activity coefficient. For methanol solutions, the deviations vary from 5.47% for NaCl to 11.49% for LiCl, whereas for ethanol solutions the deviations are higher, reaching 25.92% for NaBr. The predictions of the osmotic coefficient at 298.15 K for electrolyte solutions of both solvents also exhibit high deviations.
Lack of experimental data for nonaqueoeus elec-trolyte solutions may have been a reason why the results of mean ionic activity coefficient and osmotic coefficient are not as good as those of vapor pressure and density. The objective function, Eq. (3), adds the squared deviations in vapor pressure, density, and mean ionic activity coefficient. For few salt solu-tions, all three properties are available; for most of them, experimental data for only one of these proper-ties exist. Additionally, the number of experimental points is considerably larger for vapor pressure than for other properties. This may have led to an error compensation that favored the vapor pressure results.
The deviations between the experimental and cal-culated values of all thermodynamic properties pre-sented in this work tend to grow as the salt concen-tration increases. Therefore, we recommend using the Q-electrolattice EOS within the molality range presented in Table 5 for each salt.
The performance of Q-electrolattice EOS is com-pared to the work of Held et al. (2012), in which the ePC-SAFT EOS was used to correlate thermody-namic properties of some similar salts in methanol and ethanol solutions. In general, both EOSs present thermodynamic property deviations of similar mag-nitude in comparison to experimental data. However, the Q-electrolattice EOS shows slightly better results for liquid density and mean ionic activity coefficient for the solutions of both solvents. On the other hand, it is less accurate than the ePC-SAFT EOS when calculating osmotic coefficient. A major advantage of the present work, compared to the work of Held et al. (2012), is the correlation of vapor pressures, whose results are very accurate.
The vapor pressure results of Zuo and Fürst (1997) are generally better than those of this work. However, vapor pressure was the only property they considered for parameter fitting and comparison to experimental data. In addition to vapor pressure, this work focuses on density, mean ionic activity coeffi-cient, and osmotic coefficient. The performance of the Zuo and Fürst (1997) model for predicting those properties is unknown.
experi-Brazilian Journal of Chemical Engineering Vol. 32, No. 03, pp. 637 - 646, July - September, 2015 mental data in a temperature range from 298.15 to
323.15 K. In Figure 4(B), the mean ionic activity coefficient tends to 1.0 at low concentrations; how-ever, it is underestimated at concentrations above 0.4 molal. In Figure 4(C), the calculated osmotic coeffi-cient, which was not included in the objective func-tion, is underestimated below 2.0 molal; above this concentration, the thermodynamic property is over-estimated. In Figure 4(D), although the density of pure methanol is reached at very low salt concentra-tions, the density of LiCl + methanol solution is slightly overestimated for molalities above 0.1.
Predictions of liquid density of single salts in methanol or ethanol are presented in Tables 6 and 7, respectively. The predictions have been performed considering the fitted parameters presented in Table
3. Most of the experimental data used in these calculations were obtained in papers whose focus was on the evaluation of apparent molar volume of salt. This thermodynamic property can be easily converted to liquid density by using an appropriate equation. The density predictions are performed at temperatures from 283.15 K to 323.15 K, and molalities up to 4.50 molal for both solvents. In general, they are in good agreement with the experimental data since the highest deviations are 2.04% for LiClO4 in methanol and 1.72% for NaI in
ethanol. Additionally, the deviations of liquid density for a given salt in methanol or ethanol tend to in-crease at higher temperatures. As an example, the de-viation obtained for NaClO4 in methanol at 283.15 K
is 0.72%, whereas at 308.15 K it is 0.84%.
Table 6: Average absolute relative deviation (AARD (%)) for the liquid density of solutions containing a single salt in methanol using the Q-electrolattice EOS.
Salt Np mmax(kg/mol) T (K) AARD (%)
Methanol
LiCla 8 0.10 288.15 0.15
8 0.18 298.15 0.21
12 0.12 308.15 0.41
8 0.11 318.15 0.29
LiBrb 11 4.50 288.15 0.22
10 4.28 298.15 0.21
11 4.50 308.15 0.16
11 2.78 323.15 0.26
LiIb 12 2.51 298.15 1.16
7 1.97 308.15 1.58
14 2.51 323.15 1.01
LiClO4c 5 1.34 298.15 2.04
NaCla 8 0.19 288.15 0.08
7 0.14 298.15 0.09
9 0.17 308.15 0.13
8 0.20 318.15 0.16
NaBrd 8 0.10 288.15 0.06
8 0.22 298.15 0.16
8 0.38 308.15 0.86
8 0.10 318.15 0.12
NaId 8 0.10 288.15 0.27
8 0.21 298.15 0.44
11 0.16 308.15 0.64
8 0.30 318.15 0.61
NaClO4e 13 0.41 283.15 0.72
13 0.41 288.15 0.76
13 0.41 293.15 0.79
13 0.41 298.15 0.81
13 0.41 303.15 0.83
13 0.41 308.15 0.84
13 0.41 313.15 0.84
KCla 8 0.04 288.15 0.05
8 0.06 298.15 0.05
8 0.05 308.15 0.09
8 0.06 318.15 0.10
KBrd 8 0.06 288.15 0.05
8 0.06 298.15 0.06
8 0.11 308.15 0.13
8 0.09 318.15 0.13
KIf 8 0.10 288.15 0.24
8 0.18 298.15 0.48
8 0.12 308.15 0.39
8 0.11 318.15 0.32
a
(Takenaka et al., 1994a); b
(Glugla et al., 1982); c
(Barthel et al., 1998); d
(Takenaka et al., 1994b); e
(Wawer et al., 2008); f
(Takenaka et al., 1994c)
Table 7: Average absolute relative deviation (AARD (%)) for the liquid density of solutions containing a single salt in ethanol using the Q-electrolattice EOS.
Salt Np mmax(kg/mol) T (K) AARD
(%) Ethanol
LiCla 8 2.30 298.15 0.38
LiBra 11 2.83 298.15 0.39
LiBra 12 1.95 323.15 0.68
LiIa 11 2.77 298.15 1.35
LiIa 13 1.89 323.15 1.11
LiNO3a 8 2.41 298.15 0.24
NaIa 6 1.39 298.15 1.72
a
Brazilian Journal of Chemical Engineering Vol. 32, No. 03, pp. 637 - 646, July - September, 2015
CONCLUSION
In this study, the Q-electrolattice equation of state was applied to model electrolyte solutions whose solvent is methanol or ethanol. Thermodynamic properties of sixteen methanol and ten ethanol single salt solutions were obtained using two adjustable pa-rameters per ion, namely the ionic diameter and the solvent-ion interaction energy. Particularly for the cations, the parameters exhibit some reasonable trends related to the solvation phenomenon. Vapor pressure and density are correlated satisfactorily by using the Q-electrolattice equation of state. Corre-lated mean ionic activity coefficients and predicted osmotic coefficients have larger deviations compared to the other thermodynamic properties. Predictions of liquid density at temperatures different than 298.15 K are in good agreement with experimental data.
ACKNOWLEDGMENT
A. Z. acknowledges the financial support of the following Brazilian agency: Coordenação de Aper-feiçoamento de Pessoal de Nível Superior (CAPES).
REFERENCES
Barthel, J., Neueder, R., Poepke, H. and Wittmann, H., Osmotic and activity coefficients of nonaque-ous electrolyte solutions. 1. Lithium perchlorate in the protic solvents methanol, ethanol, and 2-pro-panol. J. Solution Chem., 27, 1055-1066 (1998). Baseri, H. and Lotfollahi, M. N., Modification of
Peng Robinson EOS for modelling (vapor + liquid) equilibria with electrolyte solutions. J. Chem. Thermodyn., 43, 1535-1540 (2011). Blum, L., Simple method for the computation of
thermodynamic properties of electrolytes in the mean spherical approximation. J. Phys. Chem., 92, 2969-2970 (1988).
Chou, T.-J. and Tanioka, A., A vapor pressure model for aqueous an non-aqueous solutions of single and mixed electrolyte systems. Fluid Phase Equilib., 137, 17-32 (1997).
Clarke, M. A. and Bishnoi, P. R., Development of a new equation of state for mixed salt and mixed solvent systems, and application to vapour–liquid and solid (hydrate)–vapour–liquid equilibrium calculations. Fluid Phase Equilib., 220, 21-35 (2004).
Davidson, D. W., The dielectric properties of metha-nol and methametha-nol-D. Can. J. Chem., 35, 458-473 (1957).
Diogo, H. P., Santos, R. C., Nunes, P. M. and Piedade, M. E. P., Ebulliometric apparatus for the measurement of enthalpies of vaporization. Ther-mochim. Acta, 315, 113-120 (1995).
Ge, X., Zhang, M., Guo, M. and Wang, X., Correla-tion and predicCorrela-tion of thermodynamics properties of electrolytes by the modified TCPC model. J. Chem. Eng. Data, 53, 149-159 (2008).
Glugla, P. G., Byon, J. H. and Eckert, C. A., Partial molar volume of some monovalent salts and polar molecules in organic solvents. J. Chem. Eng. Data, 27, 393-398 (1982).
Gmehling, J. Dortmund Data Bank. Software. Ver-sion 2012.
Held, C., Prinz, A., Wallmeyer, V. and Sadowski, G., Measuring and modeling alcohol/salt systems. Chem. Eng. Sci., 68, 328-339 (2012).
Kalafati, D. D., Rasskazov, D. S. and Petrov, E. K., Experimental study of p,v,t – dependence of etha-nol. Teploenergetika, 638, 77-81 (1967).
Khoiroh, I. and Lee, M.-J., Isothermal (vapour + liquid) equilibrium for binary mixtures of poly-ethylene glycol mono-4-nonylphenyl ether (PEGNPE) with methanol, ethanol, or 2-propanol. J. Chem. Thermodyn., 155, 1417-1423 (2011). Marcus, Y., Thermodynamics of solvation of ions.
Part 5. Gibbs free energy of hydration at 298.15 K. J. Chem. Soc. Faraday Trans., 87, 2995-2999 (1991).
Mattedi, S., Tavares, F. W. and Castier, M., Group contribution equation of state based on the lattice fluid theory: Alkane-alkanol systems. Fluid Phase Equilib., 142, 33-54 (1998).
Monica, M. D. and Senatore, L., Solvated radius of ions in nonaqueous solvents. J. Phys. Chem., 74, 205-207 (1970).
Mousa, A. H. N., Critical properties, heat of vapori-zation and vapour pressure of ethanol from 20 kPa to the critical point. J. Chem. Eng. Japan, 52, 635-637 (1987).
Myers, J. A., Sandler, S. I. and Wood, R. H., An equation of state for electrolyte solutions cover-ing wide ranges of temperature, pressure, and composition. Ind. Eng. Chem. Res., 41, 3282-3297 (2002).
Pasztor, A. J. and Criss, C. M., Apparent molal volume and heat-capacities of some 1-1 electro-lytes in anhydrous methanol at 25-degree-C. J. Sol. Chem., 7, 27-44 (1978).
und dissociation. Z. Phys. Chem., (Leipzig) 1, 237-258 (1887). (In German).
Richardson, A., Determinations of vapour-pressures of alcohols and organic acids, and the relations existing between the vapour-pressures of the alco-hols and organic acids. J. Chem. Soc. London, 19, 761-776 (1886).
Shirke, R. M., Chaudhari, A., More, N. M. and Patil, P. B., Dielectric measurements on methyl acetate + alcohol mixtures at (288, 298, 308, and 318) K using the time domain technique. J. Chem. Eng. Data, 45, 917-919 (2000).
Takenaka, N., Takemura, T. and Sakurai, M., Partial molar volumes of uni-univalent electrolytes in methanol + water. 1. Lithium chloride, sodium chloride, and potassium chloride. J. Chem. Eng. Data, 39, 207-213 (1994a).
Takenaka, N., Takemura, T. and Sakurai, M., Partial molal volumes of uni-univalent electrolytes in methanol + water. 2. Sodium bromide and potas-sium Bromide. J. Chem. Eng. Data, 39, 796-801 (1994b).
Takenaka, N., Takemura, T. and Sakurai, M., Partial
molal volumes of uni-univalent electrolytes in methanol + water. 3. Sodium iodide and potas-sium iodide. J. Chem. Eng. Data, 39, 802-807 (1994c).
Wawer, J., Krakowiak, J. and Grzybkowski, W., Ap-parent molar volumes, expansibilities, and isen-tropic compressibilities of selected electrolytes in methanol. J. Chem. Thermodynamics, 40, 1193-1199 (2008).
Young, S., The vapour-pressures, specific volumes, heats of vaporization, and critical constants of thirty pure substances. Sci. Proc. Roy. Dublin Soc., 522, 374-443 (1909).
Zipp, A. P., Solvation numbers in nonaqueous sol-vents. J. Phys. Chem., 78, 556-557 (1974). Zuber, A., Checoni, R. F. and Castier, M.,
Thermody-namic properties of aqueous solutions of multiple salts using the Q-electrolattice equation of state. Fluid Phase Equilib., 362, 268-280 (2014). Zuo, Y.-X. and Fürst, W., Prediction of vapor