ISSN 0104-6632 Printed in Brazil
www.abeq.org.br/bjche
Vol. 32, No. 03, pp. 683 - 698, July - September, 2015 dx.doi.org/10.1590/0104-6632.20150323s00003445
Brazilian Journal
of Chemical
Engineering
NON-EQUILIBRIUM MOLECULAR DYNAMICS
USED TO OBTAIN SORET COEFFICIENTS OF
BINARY HYDROCARBON MIXTURES
F. A. Furtado
1, A. J. Silveira
2,3, C. R. A. Abreu
2and F. W. Tavares
1,2*1Programa de Engenharia Química/COPPE, Universidade Federal do Rio de Janeiro,
Cidade Universitária, 21941-972, Rio de Janeiro - RJ, Brazil. Phone: + (55) (21) 2562-7650
*E-mail:[email protected]
E-mail: [email protected]
2Escola de Química, Universidade Federal do Rio de Janeiro, Cidade
Universitária, 21949-900, Rio de Janeiro - RJ, Brazil. E-mail: [email protected]
3Planta Piloto de Ingeniería Química, PLAPIQUI, Universidad Nacional del Sur,
Camino La Carrindanga Km 7–CC: 717, Bahía Blanca, Argentina. E-mail: [email protected]
(Submitted: April 14, 2014 ; Revised: March 3, 2015 ; Accepted: March 3, 2015)
Abstract - The Boundary Driven Non-Equilibrium Molecular Dynamics (BD-NEMD) method is employed to evaluate Soret coefficients of binary mixtures. Using a n-decane/n-pentane mixture at 298 K, we study several parameters and conditions of the simulation procedure such as system size, time step size, frequency of perturbation, and the undesired warming up of the system during the simulation. The Soret coefficients obtained here deviated around 20% when comparing with experimental data and with simulated results from the literature. We showed that fluctuations in composition gradients and the consequent deviations of the Soret coefficient may be due to characteristic fluctuations of the composition gradient. Best results were obtained with the smallest time steps and without using a thermostat, which shows that there is room for improvement and/or development of new BD-NEMD algorithms.
Keywords: Irreversible thermodynamics; Transport properties.
INTRODUCTION
Transport properties are of great importance for theoretical and industrial purposes. In industry, accu-rate values of transport properties are essential for the correct design of equipment and processes to perform tasks such as the transport of complex fluids (e.g., polymer melts or solutions) and efficient heat exchange (Dysthe et al., 1998). For theoretical and academic purposes, the development of new models and methodologies capable of predicting these proper-ties can decrease the need of experiments, mainly in
extreme (and thus expensive) experimental condi-tions. Along with the well-known energy, mass, and momentum transport, coupled transport phenomena such as Soret and Dufour effects may take place in a relevant way. The Soret effect, also known as ther-mal diffusion, is one of the most studied coupled transport phenomena (Demirel, 2007) and is the one addressed here.
Brazilian Journal of Chemical Engineering
distribution is consistent with the chemical potential gradient for each species, which is the driving force for diffusive flux. In a closed system, a steady state is reached, resulting in a well-developed stationary concentration gradient (Leahy-Dios, 2008; De Groot and Mazur, 1984).
Even around 160 years after the first observations of thermal diffusion made by Ludwig in 1856, a complete knowledge of the behavior of mixtures under temperature gradients is still lacking (Kincaid and Hafskjold, 1994; Leahy-Dios, 2008; Würger, 2013). Nevertheless, thermal diffusion plays a key role in several natural and industrial processes. Cur-rently, the most discussed application is in the petro-leum industry. Because of geothermal gradients, diffusive fluxes can occur in the rock matrix of an oil reservoir, interfering in the distribution of compo-nents along its height. Therefore, thermal diffusion might be the reason for the unexpected composi-tional gradient observed in some oil reservoirs. A typical and famous example is the Yufutsu field in Japan, where heavy compounds are concentrated in the top of the reservoir, and vice-versa (Gorayeb et al., 2000).
Over the years, several researchers have focused on measurement and prediction of the behavior of mixtures under a thermal gradient. Chapman (1916) and Enskog (1911) were among the first authors to theoretically describe segregation due to thermal diffusion in dilute gas mixtures. More recently, Mo-lecular Dynamics (MD) has emerged as a useful tool to better understand the phenomenon on the micro-scopic scale. Several methodologies based on equi-librium and non-equiequi-librium MD were developed to predict thermodynamic and transport properties, including thermal diffusion coefficients (Artola and Rousseau, 2013). Transport properties such as ther-mal conductivity, viscosity and diffusion coefficient can be computed by equilibrium MD using the well-known Green-Kubo relations (Dysthe et al., 1998; Fernández et al., 2004; Liang and Tsai, 2010). For coupled transport properties, the most successful methods are the Synthetic Non-Equilibrium Molecu-lar Dynamics (S-NEMD) and the Boundary-driven Non-Equilibrium Molecular Dynamics (BD-NEMD) methods. In the S-NEMD method, an external field, which must satisfy the adiabatic incompressibility of phase space, is applied to drive the system out of equilibrium (Morris and Evans, 1990). The S-NEMD method, together with Green-Kubo relations, can be used to determine the phenomenological coefficients. The main drawback of this method consists of an indirect measurement of the heat flux by molecular simulation for the case of non-ideal mixtures, since
only the internal energy flux can be expressed in terms of microscopic quantities (Perronace et al., 2002; Artola and Rousseau, 2013). In the BD-NEMD method, a simulation box with periodic boundary conditions is divided along one direction (e.g., the z-axis) into slabs of equal thickness. Then, two slabs far apart from each other are acted upon by adding energy to one slab (tagged as "hot") while removing energy from the other slab (tagged as "cold"). In this way, energy will naturally flow across the system in the opposite direction, that is, from the hot slab to the cold slab, leading to a steady state condition with a well-developed temperature gradient. There are dif-ferent methods described in the literature to carry out the described energy transfer. The most cited algo-rithms are the one developed by Hafskjold et al.
thermostat to the system causes the intermediate slabs not to follow Newtonian mechanics, which can artificially change the transport properties. Zhang et al. (2005) compared the influence of a Berendsen thermostat (Berendsen et al., 1984) on the computed thermal conductivity of pure benzene, cyclohexane, n-hexane, and of mixtures of benzene and cyclohex-ane, using the PeX algorithm of Müller-Plathe (1997). Zhang et al. (2005) observed a difference of around 10% for thermal conductivities obtained in thermostated simulations compared to thermal con-ductivities obtained in the absence of a thermostat. These deviations were considered to be small be-cause common coupling times used in BD-NEMD simulations are one order of magnitude larger than the one used in the work of Zhang et al. (2005). How-ever, the authors carried out simulations with total times of 8000 ps. As we are going to show here, this time scale could be too small to compute thermal diffusion coefficients properly. Therefore, the con-clusions drawn for thermal conductivity calculations may be not directly extendable to thermal diffusion coefficients. According to Zhang et al. (2005), the energy drift can be explained by a round-off or cutoff noise, which is more prominent for charged mole-cules. According to Zhang et al. (2005), the use of a Berendsen thermostat with a small coupling time showed no significant effect on the thermal conduc-tivity value. According to these authors, it is because in the Berendsen thermostat the atom velocities are uniformly rescaled and not changed with respect to local friction, maintaining the velocity directions, but changing only their magnitude, which causes other thermostats to be inappropriate for the task.
Other authors employed the BD-NEMD method to determine thermal diffusion factors and/or Soret coefficients by using a weakly coupled thermostat to avoid the energy drift (Reith and Müller-Plathe, 2000; Zhang and Müller-Plathe, 2005; Polyakov et al., 2008”). In addition, other methods that use two independent thermostats coupled to different regions of the simulation box may be used to generate the temperature gradient, also avoiding the energy drift problem (Maier et al., 2011; Maier et al., 2012). Simon et al. (1998; 1999) obtained thermal diffusion factors for mixtures of methane and n-decane; Perro-nace et al. (2002) computed Soret coefficients for mixtures of n-pentane and n-decane at three concen-trations and obtained good results; Nieto-Draghi and Ávalos (2005) determined Soret coefficients for vari-ous aquevari-ous systems; Zhang and Müller-Plathe (2005) determined Soret coefficients of benzene-cyclohexane mixtures. Recently, the method was used to obtain Soret coefficients for fluids confined
in slit pores (Galliéro et al., 2006, Hanaoui et al., 2011, and Hannaoui et al., 2013). The BD-NEMD method was also applied for mixtures containing more than two components (Galliéro et al., 2010; Galliéro et al., 2013).
Here, we used the BD-NEMD with the PeX algo-rithm proposed by Nieto-Draghi and Ávalos (2003) to obtain the Soret coefficient of an n-pentane/n-decane mixture at 298 K and 1 atm. The main goal of this work was the evaluation of how the parameters and conditions used in the simulations affect the ob-served energy drift and, consequently, the computed Soret coefficients and their fluctuations. Parameters and conditions analyzed are the size (number of molecules), time step size, frequency of momentum exchange, and the use of a Berendsen thermostat. The n-pentane/n-decane mixture was chosen so that the results obtained here could be compared to ex-perimental data and to other molecular simulation results (Perronace et al., 2002). The TraPPE-UA force field (Martin and Siepmann, 1998) was used to model n-alkanes because it provides reliable results for density and diffusion coefficients, as pointed out by Makrodimitri et al. (2011).
THEORETICAL BASIS
In a binary mixture under a thermal gradient, the mass flux of component 1 may be described by Equation (1).
1 2 T 1
w w D T D w
ρ ρ
= − ∇ − ∇
1
J (1)
where J1 is the mass flux of component 1, T is the temperature, λ is the heat conduction coefficient, D is the diffusion coefficient, DT is the thermal diffusion coefficient and w is the mass fraction of a given com-ponent. Once a steady state is reached, the mass flux due to thermal diffusion cancels out with the diffusive flux generated by the concentration gradient, leading to a zero net mass flux (J1 = 0), which results in
(
)
1 1 1 1
T
T T
D
S x S x x T
D
= ∴∇ = − ∇ (2)
non-Brazilian Journal of Chemical Engineering
equilibrium thermodynamics is fully described in the literature (De Groot and Mazur, 1984; Demirel, 2007).
METHODOLOGY
Simulation Details
In this work, a united atom force field was em-ployed to model n-alkanes by considering CH2 or CH3 groups as single pseudo atoms. The potential energy is taken as a sum of dihedral torsion angle, bond angle bending, bond stretching, and inter- and intramolecular non-bonded contributions, as follows:
1... 1... 1...
1... 1...
( ) ( ) ( )
( ) ( )
pot N torsion N bend N
stretch N non bonded N
E E E
E E −
= +
+ +
r r r
r r
(3)
Makrodimnitri et al. (2011) showed that the TraPPE-UA force field (Martin and Siepmann, 1998), augmented with a harmonic bond stretching poten-tial, can be used to compute densities and diffusion coefficients that agree well with experimental data for small molecules in heavy hydrocarbon. The indi-vidual contributions to the augmented TraPPE-UA force field used here are expressed by:
[
]
[
]
[
]
0 1 2
3
1 cos 1 cos(2 ) , 1 cos(3 )
torsion
dihedrals
c c c
E c + + + − ⎧ ⎫ ⎪ ⎪ = ⎨ ⎬ + + ⎪ ⎪ ⎩ ⎭
∑
ϕϕ ϕ (4)(
)
2, 2
bend eq
angles
k
E =
∑
θ θ θ− (5)(
)
2, 2 r strech eq bonds k
E =
∑
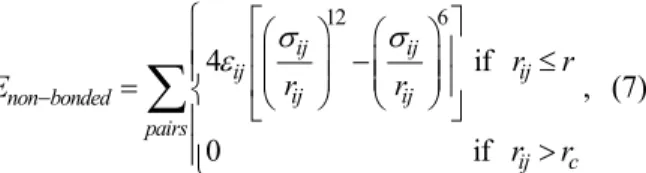
r−r and (6)12 6 4 if , 0 if ij ij ij ij ij ij non bonded pairs ij c r r r r E r r σ σ ε − ⎧ ⎡⎛ ⎞ ⎛ ⎞ ⎤ ⎪ ⎢⎜ ⎟ −⎜ ⎟ ⎥ ≤ ⎪ ⎢⎜ ⎟ ⎜ ⎟ ⎥ = ⎨ ⎝ ⎠ ⎝ ⎠ ⎣ ⎦ ⎪ > ⎪⎩
∑
(7)where kθ and kl are the force constants; c1, c2 and c3 are constants of the dihedral model, φ is the angle formed by dihedral projection; εij and σij are the en-ergy and size parameter of the Lennard-Jones model, respectively, rc is the cutoff distance which was used according to the TraPPE-UA force field. An united atoms force field was chosen to simulate systems containing a larger number of molecules with a smaller computational time. In this way, fluctuations in composition gradients are reduced. The force field parameters used are given in Table 1. Values of εij and σij, for unlike interactions were determined by the Lorentz-Berthelot combining rule, defined as follows:
ij ii jj
ε = ε ε (8)
2
ii jj ij
σ σ
σ = + (9)
All simulations were carried out on a GPU-based cluster using the software LAMMPS (Plimpton, 1995; Brown et al., 2011; Brown et al., 2012). The velocity-Verlet algorithm (Verlet, 1967) was used to integrate the equations of motion. The simulation box was considered with periodic boundary condi-tions in all direccondi-tions. The time step size, number of molecules, and the statistical ensemble (NVE, NVT, or NPT) used depended on the simulation run (each case is discussed in the next sections). Standard long-range corrections were taken into account in all simulations (Allen and Tildesley, 1989).
Table 1: The TraPPE-UA force field with additional bond stretching parameters.
Interaction Type Group Parameters
/ r b
k k (K / Å ) 2 (Å)
eq
r
Bond stretching
C C− 96500 1.54
/ b
kθ k (K / rad ) 2 θeq( )° Bond angle bending
C C C− − 62500 114.0
0/ b
c k (K) c1/kb(K) c2/kb (K) c3/kb (K) Dihedral torsional
angle C C C C− − − 0 355.03 -68.19 791.32
/kb
ε (K) σ(Å) rc(Å)
CH2 46.0 3.950 14.0
Lennard-Jones
Determination of Density
Equilibrium MD simulations using NPT and NVT ensembles with a time step of 1fs were carried out in order to determine the density of pure components and mixtures. For each pure component (n-pentane and n-decane), a system consisting of 800 molecules was used. For binary mixtures, equimolar mixtures of 1200 molecules were used. To pack the molecules into a cubic simulation box, the Packmol (Martínez, et al., 2009) software was used to reach a density between 0.500 and 0.600 g/cm³. To avoid trapping in a local minimum of energy, the systems were first warmed up from 298 to 700 K with a 1 fs time step during 25 ps employing a ramped Nosé-Hoover chain thermostat using the formulation of Shinoda et al. (2004) with a coupling time of 100 fs. After reaching 700 K, the system was equilibrated in the NVT ensemble for 2 ns. Next, it was gradually cooled down to a temperature of 298 K during 300 ps, being thermally equilibrated at 298 K for 2 ns in the NVT ensemble. Once equili-brated, the NPT ensemble with the Nosé-Hoover barostat (following the formulation of Shinoda et al., 2004) with a coupling time of 1000 fs was employed to equilibrate the volume using a target pressure of 1 atm. The system volumes were allowed to equilibrate for 2 ns and a sampling time of at least 10 ns was used to determine the average volume.
Determination of Self-Diffusion Coefficients
Equilibrium MD simulations were carried out with pure component systems to determine their self-diffusion coefficients (D). The results were used to test the accuracy of the force field in the determina-tion of this transport property by comparison with experimental data (Douglas and McCall, 1958). A time step of 1 fs was used in all simulation runs. After the determination of density, a new system containing 800 molecules of the desired component was packed into a cubic simulation box with periodic boundary conditions and a volume equal to the previ-ously determined equilibrium volume. The procedure described in the preceding section, excluding the volume equilibration step, was used again to avoid local minima. Next, an equilibration run in the NVE ensemble was carried out for 5 ns. The final configu-ration obtained was used as initial configuconfigu-ration in the simulations for determining D, which is also performed in the NVE ensemble. Einstein’s equation was used directly, that is,
2
( ) 1
lim ,
2 t
t D
d →∞ t
∂ Δ =
∂ r
(10)
where Δr2 is the mean square displacement of the center of mass of molecules averaged over all centers of mass of each kind of molecule and multiple time origins and d is the dimensionality of the system. The simulation time (t) was at least 10 ns for all self-diffusion coefficient determinations, which was large enough to achieve a constant slope behavior, corre-sponding to D in Equation (10).
The BD-NEMD Algorithm
Boundary-driven non-equilibrium molecular dy-namics was employed to determine the Soret Coeffi-cient of an equimolar mixture of decane and n-pentane at 298 K. The PeX algorithm of Nieto-Draghi and Avalos (2003) was used in all simulations. This algorithm is similar to the original PeX algorithm of Müller-Plathe (1997), but including the possibility of energy exchanges between atoms with different masses, changing their momenta through a virtual collision.
In this work, we used a tetragonal simulation box with periodic boundary conditions and dimensions L × L × 3L. The box was divided in the z-axis direction (length equal to 3L) into 20 slabs of equal thickness. With a predefined time interval, the atom with the smallest velocity in the hot slab (slab 10) and the atom with the highest velocity in the cold slab (slab 0) undergo a virtual elastic collision. In this way, kinetic energy is transferred from the fastest atom to the slowest atom, which most frequently yields a transfer from the cold slab to the hot slab as the sys-tem evolves towards a steady state. Depending on the frequency of virtual collisions, the system reaches steady state with a linear temperature profiles in both intermediate regions between the hot and cold slabs. The temperature gradient induces a thermo-diffusive mass flux throughout the system, thus inducing a compositional gradient. Once both temperature and composition gradients are established and show a linear behavior, Equation (2) can be applied to com-pute the Soret coefficient.
Müller-Brazilian Journal of Chemical Engineering
Plathe, 2008; Polyakov et al. 2008) in order to mini-mize the influence of the thermostat on the system. We evaluated whether the addition of a thermostat, even with a weak coupling factor, can change the dynamics of the system in order to affect the deter-mined Soret coefficient. The exchange periods of thermostated systems were 300 and 400 fs. The time step of 2 fs was chosen following studies published in the literature that used 2 fs or higher time steps (Simon et al., 1998; Perronace et al., 2002; Zhang and Müller-Plathe, 2005; Polyakov et al., 2008). To avoid energy local minima, the systems were heated and cooled in the same way described for self-diffu-sion coefficient determinations. The final configura-tions obtained after the heating and cooling cycles were used as initial configurations for all systems. To evaluate the drift in total energy, the same initial configurations were used without applying the PeX algorithm. To obtain Soret coefficients, total simula-tion times of 48 ns were used in all cases. The local concentration in each slab was computed by count-ing the centers of mass of each species. Both concen-tration and temperature in each slab were sampled using intervals of 20 fs. It is important to point out that in BD-NEMD methods the assumption of linear-ity between fluxes and forces must hold, which also means that linear composition and temperature gradi-ents must be obtained at the steady state condition.
RESULTS AND DISCUSSION
Densities of pure components and mixtures were determined via equilibrium NPT simulations as de-scribed previously and are compared to experimental results in Table 2, where the self-diffusion coeffi-cients are also reported and compared with experi-mental and simulation data available in the literature. The standard deviations for experimental densities and self-diffusion coefficients were estimated by Equation (11) using uncorrelated data obtained by
standard autocorrelation function analysis (Allen and Tildesley, 1987).
Y Y
M
υ
υ = (11)
where υY is the standard deviation of the sample average with respect to the trajectory average, υY is the standard deviation and M is the number of uncor-related measurements of Y.
The results for density shown in Table 2 are in good agreement with data from the literature with devia-tions smaller than 1%. The self-diffusion coefficients obtained using the augmented TraPPE-UA force field were about 35% higher than the experimental values for n-pentane and 65% higher for n-decane. The dis-crepancies observed could be related to the fact that the TraPPE-UA force field was not parameterized taking into account transport properties. Makrodimitri
et al. (2011) observed differences between simulated and experimental data ranging from 0.50 to 32%, depending on the condition, and considered this to be a good result. Comparing with results obtained with other force fields (anisotropic united atoms – AUA – Toxvaerd, 1990), the self-diffusion coefficients ob-tained here are 25% higher for n-pentane and 42% higher for n-decane. Polyakov et al. (2008) also ob-served values 20% higher or more than experimental data for self-diffusion coefficients using the TraPPE-UA force field. The same authors found a systematic deviation of 40% for the mutual diffusion coeffi-cients for heptane–benzene mixtures. These results, when compared to simulations using different force fields, suggest that the TraPPE force field overesti-mates the mobility of the substances addressed above. Even though the results obtained for self-dif-fusion coefficients present considerably high devia-tions when compared to experimental data, it is im-portant to evaluate the performance of the TraPPE-UA force field in the case of long alkanes.
Table 2: Simulated densities and self-diffusion coefficients compared with experimental data and simula-tion results obtained with other force fields.
ρ (kg/m³) D (10-9 m²/s)
Components
this work exp. this work sim. (AUA1)
sim. (AUA2)
exp.
n-C5 621.5±0.1 621a 7.59±0.17 6.12b 6.18b 5.62c
n-C10 734.1±0.1 730a 2.21±0.03 1.49b 1.66b 1.31c,1.38d
n-C5 + n-C10 694.2±0.1
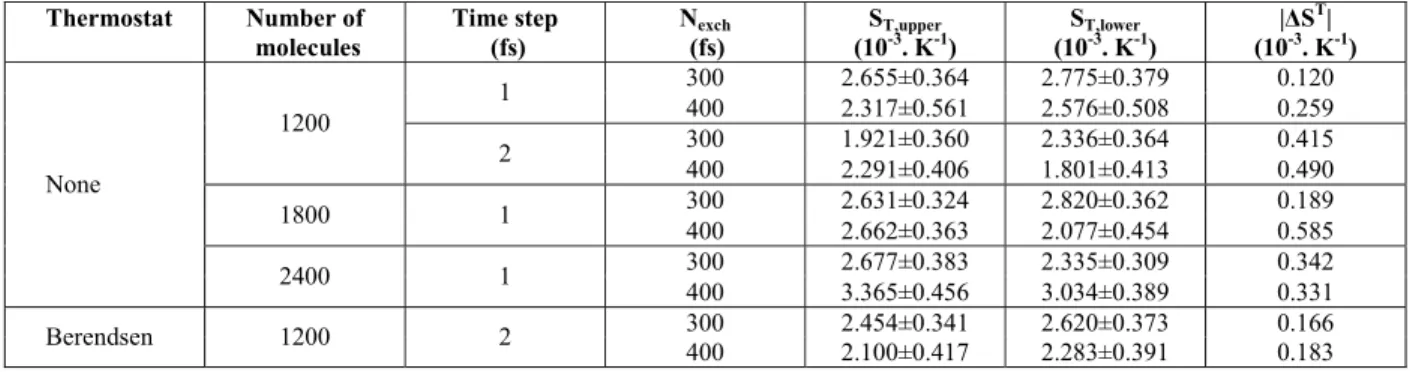
The Soret coefficients were determined for each condition using Equation (2). The first 3 ns were excluded from the calculations to avoid non-steady state perturbations. For each simulation, two values of composition and temperature gradients were ob-tained from the nine slabs above the hot slab and from the nine slabs below the hot slab. These values were used to evaluate and compare the methodology through the Soret coefficient determined for each region of the simulation box. Conditions used in each simulation and the Soret coefficients obtained are summarized in Table 3. The standard deviations were calculated using Equation (11).
The differences between data using the upper and lower regions of the simulation box were higher for systems with 1200 molecules using a time step of 2 fs and for the system with 1800 molecules using an exchange period of 400 fs. Because the energy ex-changed was nearly the same, simulations containing 1800 and 2400 molecules presented smaller gradi-ents, which may explain why results with the larger number of molecules maintained similar fluctuations. However, the Soret coefficients determined with 2400 molecules are statistically similar (i.e., within the uncertainty) to those obtained with 1200 and 1800 molecules. This result confirmed that 1200 molecules are sufficient to describe the system. The system with 1800 molecules and Nexch equal to 300 presented almost the same gradient as the system containing 1200 molecules with Nexch equal to 400, showing Soret coefficient values next to each other, which reinforces the conclusion that a system with 1200 molecules is enough under the conditions stud-ied. Furthermore, the maximum observed difference between all data is 1.564·10-³ K-1.
According to Zhang and Müller-Plathe (2005), a high imposed perturbation (i.e. frequent momentum exchanges) reduces the effect of noise in the calcula-tions. However, exceedingly high perturbations must
be avoided because they lead to very high tempera-ture gradients in the simulation box. This can cause the fluid to behave like a supercooled liquid (i.e., be trapped in a free energy barrier) in the coldest slabs and, therefore, slow down the molecular motion in such slabs. Another implication of high perturbations is the risk of observing non-linear gradients caused by a too large departure from equilibrium. Another point that should be carefully analyzed is the energy drift observed during the simulations. A continuous increase in total energy causes an increase in the aver-age temperature along the simulation run, which thus prevents the system from reaching a steady state. Finally, we note that the time needed for both tem-perature and composition profiles to reach a plateau will differ depending on the simulation conditions.
The effects of two different perturbation levels were studied, with momentum being exchanged after every 300 or 400 fs. According to the data reported in Table 3, higher deviations between statistically equivalent regions generally occur with Nexch equal to 400 fs for all studied systems. It suggests, in ac-cordance with the literature (Zhang and Müller-Plathe, 2005), that weaker perturbations imply a lower signal to noise ratio and thus differences between the Soret coefficients determined from both regions. This behavior can be partially explained by the small com-position difference between the adjacent intermediate slabs, which can make the average composition in each slab to be of the same order of magnitude as the fluctuations. Zhang and Müller-Plathe (2005) ob-served similar trends. Nevertheless, the temperature and composition profiles obtained here showed linear behaviors for all systems, with determination coeffi-cients (R²) around 0.98 for composition gradients of the systems with time step equal to 1 fs and 0.93 to 0.97 for the systems with time step equal to 2 fs. The R² for temperature gradients were higher than 0.99 for all studied systems.
Table 3: Conditions for each simulation of the n-decane(1)/n-pentane(2) equimolar mixture, Soret coeffi-cients determined for the upper and lower parts of the simulation box, and their absolute differences.
Thermostat Number of molecules
Time step (fs)
Nexch
(fs)
ST,upper
(10-3. K-1)
ST,lower
(10-3. K-1)
|ΔST|
(10-3. K-1)
300 2.655±0.364 2.775±0.379 0.120
1
400 2.317±0.561 2.576±0.508 0.259
300 1.921±0.360 2.336±0.364 0.415
1200
2
400 2.291±0.406 1.801±0.413 0.490
300 2.631±0.324 2.820±0.362 0.189
1800 1
400 2.662±0.363 2.077±0.454 0.585
300 2.677±0.383 2.335±0.309 0.342
None
2400 1
400 3.365±0.456 3.034±0.389 0.331
300 2.454±0.341 2.620±0.373 0.166
Berendsen 1200 2
Brazilian Journal of Chemical Engineering
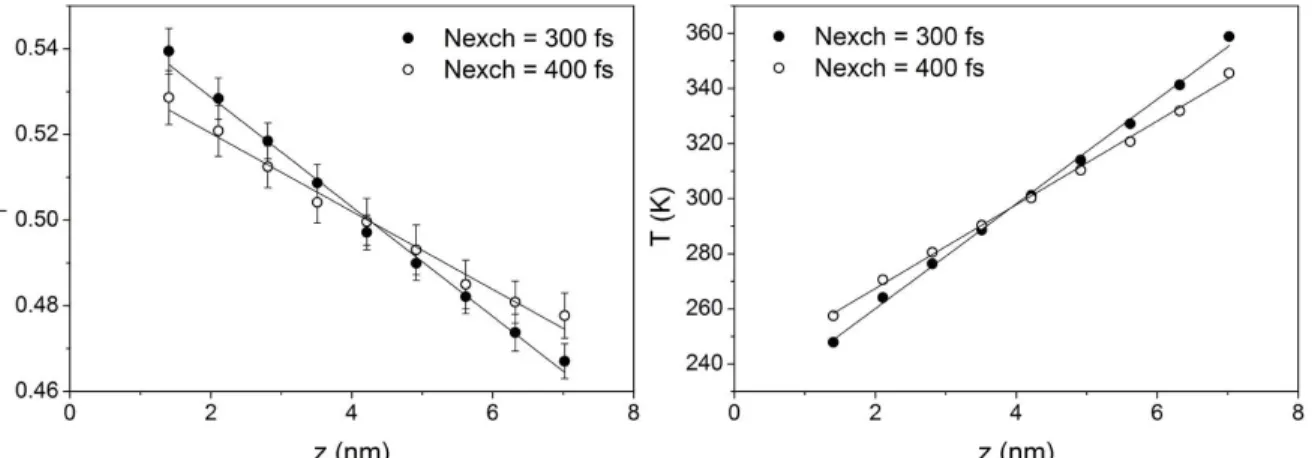
Figure 1 shows the composition and temperature profiles for the system containing 1200 molecules, simulated with a time step of 1 fs and with an ex-change period of 300 fs.
In Figure 1, composition and temperature of each slab were taken as an average between equivalent slabs from the upper and bottom regions. The error bars were computed through the evaluation of auto correlation functions of composition and temperature for each slab. The correlation time was around 2 ns for composition and 0.2 ns for temperature. The data used to calculate errors were averages of subsamples containing 2 ns of data for both composition and temperature, which are uncorrelated. The standard errors were estimated according to Equation (11).
As can be seen in Figure 1, there is a high tem-perature difference between hot and cold slabs, caused by the high driving forces imposed through unphysical momentum exchanges. The temperature differences were around 110 and 140 K for perturba-tions at every 400 and 300 fs, respectively. Accord-ing to experimental data, the boilAccord-ing points of n-pen-tane and n-decane are 309.2 and 447.2 K,
respec-tively. The steady state temperatures reached values around 235 K in the cold slab and 370 K in the hot slab for the systems with Nexch equal to 300 fs. In the simulation with Nexch equal to 400 fs, the cold slab reached a temperature of 243 K and the hot slab of 360 K. Therefore, the hot region reached higher tem-peratures that in the vapor-liquid equilibrium region for an equimolar n-pentane/n-decane mixture. Zhang and Müller-Plathe (2005) observed similar behavior for a benzene/cyclohexane mixture at 324 K and mole fraction of 0.25. These authors observed a temperature of the hot slab around 360 K, which is higher than the boiling point of both substances (353.1 K for benzene and 353.7 K for cyclohexane), indicating a possible vapor-phase transition. To confirm the liquid behavior in the whole system Zhang and Müller-Plathe (2005) plotted the density profile in the simulation box and computed the mutual diffusion coefficient. For the cases studied here, the exchange period of 300 fs for 1200 molecules corresponds to the worse case, gen-erating the highest temperature gradient. To be sure of the liquid-like behavior in the entire system, we plotted the steady state density profile in Figure 2.
Figure 1: Composition and temperature profiles along the simulation box for an equimolar system of
n-decane(1) + n-pentane (2) with a time step of 1 fs and containing a total of 1200 molecules.
Following Zhang and Müller-Plathe (2005), we can affirm that the system behaved like a liquid over the entire domain of the system. To test the mobility of molecules, the intra-diffusion coefficients (also known as self-diffusion or tracer diffusion coeffi-cients) for n-pentane and n-decane in the mixture were computed. To take this property into account, Equation (10) was used, but the average was taken only over the squared displacement of the center of mass of a given kind of molecule. The intra-diffusion coefficients for n-decane and n-pentane in the mixture were around respectively 3.2·10-9 and 5.2·10-9 m²·s-¹, which agrees with the self-diffusion coefficients in the liquid state. Furthermore, the self diffusion coef-ficients of the components in the mixture are closer to each other than those of pure components, as pointed out by Buhn et al. (2004), which reinforces that the TraPPE-UA force field correctly describes this trend of transport properties in mixtures. One possible explanation for why the system does not present vapor phase behavior in the hot slab is be-cause we started the simulation with liquid using NVT or NVE ensemble. Since the density was fixed at a constant value and small differences in the box density (like a vapor phase) can cause an increase in pressure, this may be sufficient to prevent a phase transition.
In our simulations, very low temperatures were reached, i.e., temperatures next to the melting point of n-decane were observed. The experimental melt-ing points of n-pentane and n-decane are respectively 143.4 and 243.3 K (Dreisbach, 1959). In order to test whether the coldest slabs of the system were acting like a supercooled liquid and the corresponding en-ergy barrier impeded molecular movements, prevent-ing the motion of molecules in the z-axis, the self-diffusion coefficients on the x and y axes were com-pared to that in the z direction. Because the non-equilibrium system is subjected to a temperature gradient, some level of organization or preferential motion due to thermal diffusion may be observed. Therefore, because of the preferential motion ad-dressed here, slight differences in self-diffusion coef-ficients of a given mixture component can occur in the z direction with respect to the x and y directions. For the systems of 1200 molecules and time step equal to 1 fs the differences varied from 15 to 25% for Nexch equal to 300 fs and 15% for Nexch equal to 400 fs. For systems with 1200 molecules and time step of 2 fs, differences were about 15 to 20% for Nexch equal to 300 and 400. To evaluate whether these differences are due to some level of organiza-tion or natural differences between the self-diffusion
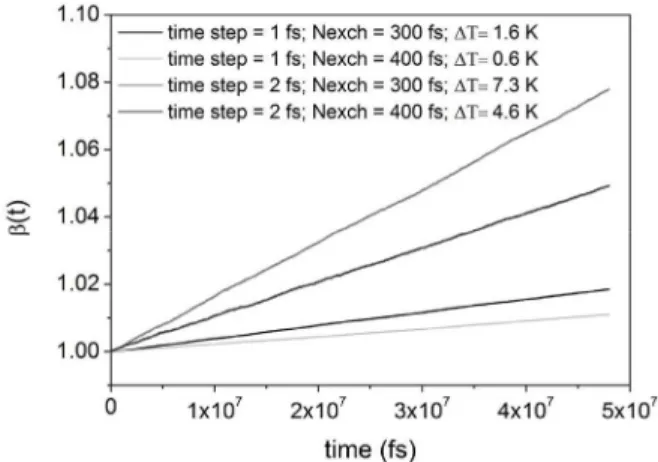
measured in the three directions, an equilibrium mo-lecular dynamics simulation of a system with the same initial configuration of the system containing 1200 molecules and using a 1 fs time step was car-ried out during the same 48 ns in the NVE ensemble. The deviations between the self-diffusion coefficients calculated along the z-axis and the average of the x and y axes for the system not subjected to the driving force was between 10 and 15%. These differences are almost the same as that observed for the non-equilib-rium system. In addition, self-diffusion coefficients determined for both kinds of systems (equilibrium and non-equilibrium) were of the same order of mag-nitude, which suggests that the molecules are not jamming together due to supercooled liquid-like behavior. Even with large perturbations and high temperature gradients, all systems simulated here behaved like a liquid in the sense of self-diffusion coefficients and densities. For the systems with a coupled thermostat, similar behaviors were observed. The increase in total energy of the system during the simulation run was evaluated for all conditions studied. The relative energy drift is shown in Figure 3 for all simulations with 1200 molecules.
Figure 3: Relative total energy drift in the systems
containing 1200 molecules without the use of a ther-mostat.
To compute this effect, we determined the time-dependent ratio of total energy, βE(t), the overall ratio of total energy, βE’, and the temperature variation during the simulation (ΔT), defined as follows,
( )
( )
0 T E
T
E t
t E
β = (12)
0
'E T f
T
E
E
Brazilian Journal of Chemical Engineering 0
f
T T T
Δ = − (14)
where ETand T are, respectively, the instantaneous total energy and temperature of the system, and the symbols <>0 and <>f denote, respectively, averages taken at the first 2 ns and at the last 2 ns of the simu-lation run. The values of βE’ and ΔT are shown in Table 4, while βE(t) is shown in Figure 3.
Results shown in Figure 3 suggest that the stronger the perturbations the higher the energy drift during the simulation. In addition, higher energy drifts were observed for time steps of 2 fs. When the total energy of the system rises, the overall tempera-ture increases.
Table 4: Increase in total energy and overall tem-perature during the simulation run using different conditions for an equimolar mixture of n-decane/n-pentane containing 1200 molecules.
Thermostat time-step (fs)
Nexch
(fs)
′
E
β (%)
ΔT (K)
300 1.79 1.6
1
400 1.06 0.6
300 7.47 7.3
None
2
400 4.68 4.6
300 -0.44 -0.1 Berendsen 2
400 -0.06 0.0
According to results shown in Table 4, higher in-creases in overall temperature were found for sys-tems with higher time steps and larger perturbations, except, as expected, for the system in which Berend-sen’s thermostat was used. According to Zhang (2006), the increase in energy which leads to a warm up of the system is caused by round-off or cut-off noise. However, when a momentum exchange oc-curs, the next step will deviate from Newtonian me-chanics, causing a perturbation in the system and thus not conserving the total energy as supposed and recommended. From Equations (3) to (7), it is possi-ble to perceive that all terms will depend in the last instance on the position vectors of each atom. Thus, when a perturbation takes place, the directions of velocity vectors of the participating atoms will change and the Hamiltonian will not be conserved in the next integration step. When this occurs, stretch-ing out of angles, bond lengths, and dihedrals and overlapping may take place, which can cause an unphysical addition of energy to the overall system. This information gains a little more strength if we compare the data obtained in this work for the sys-tems described in Table 4, except for simulations using the thermostat. When the time step is higher,
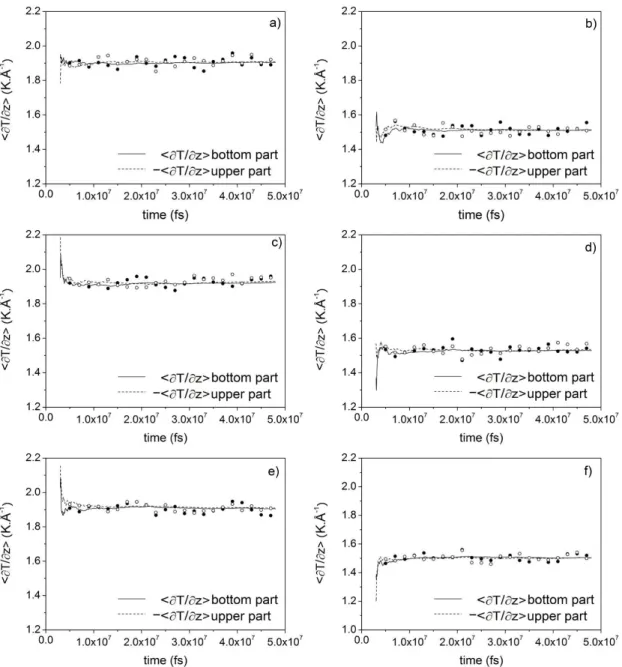
the next step of integration will displace more the atoms, favoring stretching and overlapping. Also, doing perturbations more frequently, we may favor overlaps and stretching, which can be the reason for higher energy drifts and higher overall temperatures. As already mentioned, this effect can input more fluctuations and may complicate the convergence of thermal and composition profiles. A reasonable solu-tion to this problem could be the addisolu-tion of a Ber-endsen thermostat with a gentle coupling so as not to be a source of instability. The Berendsen thermostat rescales the velocity of the atoms of the system, which maintain the directions of velocity vectors and, as a first approximation, do not cause large dis-turbances in the dynamic of the system. To evaluate the use of the thermostat, the convergence of compo-sition and temperature profiles in each region of the simulation box and the standard errors in Soret coef-ficient must be made in conjunction. Figures 4 and 5 show the time evolution of thermal and composition profiles for systems with 1200 molecules. The lines are averages accumulated since the outset of the production run, while each circle is an average taken from the preceding 2 ns.
the composition gradient. In this way, it is neces-sary to perform large simulations and continuously check the convergence. A large simulation is going to decrease the uncertainties of the Soret coeffi-cient, which is high due to the fluctuations of the
composition profile. The addition of the Berendsen thermostat showed no visible change in the behav-ior of the curves of Figures 4 and 5 and the same observations stated above are applied to the thermo-stated simulations.
Figure 4: Lines: Accumulated temperature profile measured in the bottom region (solid lines) and in the
Brazilian Journal of Chemical Engineering
Figure 5: Lines: accumulated mole-fraction profile of n-decane(1) measured in the bottom region (solid
lines) and in the top region (dotted lines) of the simulation box; Circles: average mole-fraction profile of n-decane(1) using sets of 2 ns of data measured in the bottom region (filled circles) and in the top region (open circles) of the simulation box. a) Nexch = 300 and Δt = 1fs without a thermostat; b) Nexch = 400 and
Δt = 1fs without a thermostat; c) Nexch = 300 and Δt = 2 fs without a thermostat; d) Nexch = 400 and Δt = 2 fs without a thermostat; e) Nexch = 300 and Δt = 2 fs with a Berendsen thermostat; f) Nexch = 400 and Δt = 2 fs with a Berendsen thermostat.
The standard errors in the Soret coefficient in each simulation were determined using the statistically equivalent slabs of both regions as a replicate to perform the linear regression of temperature and com-position profiles. The errors in comcom-position and tem-perature in each slab were taken into account to com-pute profiles and their uncertainties. The standard
error of the Soret coefficient was computed with the composition and temperature profile uncertainties using standard error propagation methods (Beving-ton and Robinson, 2003).
Table 5: Soret Coefficient of n-decane in an equimolar mixture with n-pentane at 298 K determined in this work at several conditions and compared to other literature data.
ST(10-3. K-1)
Thermostat t-step/Nexch (fs)
This worka BD-NEMD (HeX) S-NEMD exp. 1/300 2.70±0.24
1/400 2.42±0.38 2/300 2.18±0.26 None
2/400 2.07±0.28
2.91±0.45b 3.59±0.83b 3.27±0.23c
2/300 2.58±0.26 Berendsen
2/400 2.16±0.28 3.07
d
a – R-NEMD, ST±2·υ<Y>;
b – Perronace et al. (2002), 300 K; c – Perronace et al. (2002), 300 K; d – Mezquia et al. (2014), 298 K.
The Soret coefficient for n-decane in n-pentane determined here and compared with experimental data showed deviations around 17.5 to 37%. The standard errors determined in this work were in gen-eral smaller than those of other studies from the lit-erature, which may be due to the higher simulation time and smaller time steps employed compared to the work of Perronace et al. (2002), where the simu-lation time was 32 ns with a time step of 4 fs. It is possible to notice a difference between the absolute values of the Soret coefficient obtained by Perronace
et al. (2002) and those obtained here. Those differ-ences and deviations compared to the experimental data are possibly due to the different NEMD method-ology employed and to the force field used to model the n-alkanes. While Perronace et al. (2002) used the SKS force field (Smit et al., 1995) with the HeX (BD-NEMD) and the S-NEMD algorithms, we tested the R-NEMD algorithm (also a BD-NEMD algo-rithm) of Müller-Plathe (1997) with the TraPPE-UA force field (Martin and Siepmann, 1998). Better agreement with experimental data was found for the system with Nexch equal to 300 fs and a time step of 1 fs, showing deviations of 17.5% from experimental data, which can be related to a smaller energy drift. In addition, a 1 fs time step will lead to smaller bond, angle, and dihedral stretching caused by the energy exchange steps. Results using a time step of 2 fs without the coupling of the Berendsen thermostat presented the worst agreement compared to literature data, showing deviations ranging from 25 to 42% com-pared with other simulations and 33 to 37% comcom-pared with experimental data. These deviations may be related to the observed energy drift, causing a con-tinuous increase of perturbations and changing the dynamics of the system at intermediate slabs. Al-though a deviation of 17.5% could be considered high, the difficulty in obtaining cross coefficients, either by experiments or by molecular dynamics, means that the result can be considered to be in good
agreement with the literature, consistent with what Perronace et al. (2002) have addressed. The use of the thermostat showed higher discrepancies than the system using a time step of 1 fs for different values of Nexch. In addition, the deviations between experi-mental data and ST obtained from simulations using a 1 fs time step and Nexch equal to 300 were smaller than others, which suggest that the use of a small time step can provide better ST values. In principal, the use of a thermostat could control the energy drift and improves results. However, this effect did not clearly occur. It suggests that the use of a thermostat may cause no expected deviations, which may be due to the change of dynamics of the system on in-termediate slabs, since the velocity rescaling is ap-plied on the entire domain.
CONCLUSION
The Soret coefficients of an n-decane/n-pentane equimolar mixture were determined using the Bound-ary Driven Non-Equilibrium Molecular Dynamics method. The main contribution of this work is to show a systematic analysis of the method, testing the effect of different time steps, energy exchange, and thermostat control over the steady state conditions, the Soret coefficient and its fluctuation.
Brazilian Journal of Chemical Engineering
both substances remained on the order of magnitude expected for the liquid phase in all directions of the simulation box. A small deviation was observed for self-diffusion along the z-axis, which may be due to the energy flux in this direction. However, when compared to a system with the same initial configu-ration and simulated using equilibrium molecular dynamics, the deviations were of the order of 10%. The density profile also confirms the liquid-like be-havior in all slabs of the box.
We studied the use of a thermostat to calculate the Soret coefficients and the influence of the time step and the amount of energy exchange. Higher overall energy drifts were observed for simulations running without the thermostat with time steps equal to 2 fs. This energy drift led to an overall temperature varia-tion of around 7 K. Although the Soret coefficient deviations obtained from these simulations were not smaller, the energy drift may not be the only cause of deviations. Compared with experimental data, Soret coefficients obtained from simulations with a time step of 1 fs presented better results. The energy drift for this system was not significant since variations around 1 K were observed. For simulations using the thermostat, the Soret coefficient for energy-exchange periods of 300 fs are in agreement with literature data. However, the worst results were observed for simulations running without the thermostat with exchange periods of 400 fs and a time step equal to 2 fs. Additionally, at least 20 ns are needed to acquire an ideal convergence of the composition profile. Althought smaller time steps generate reliable results without the use of a thermostat, a higher compu-tational effort must be employed, which can be a problem.
We have shown that temperature profiles con-verge on a short time scale (around 2 ns for our sys-tem), while the composition profiles require a very long time scale (around 20 ns for our system). There-fore, to obtain reliable Soret coefficients, we need not only a good force field, but also large simulations in terms of the number of particles and simulation time. Large simulations smooth out composition-profile fluctuations and decrease uncertainties.
ACKNOWLEDGEMENTS
We would like to thank Petrobras for partially supporting this work. We also thank the Brazilian Agencies CNPq (Conselho Nacional de Desenvolvi-mento Científico e Tecnológico), CAPES ( Coordena-ção de Aperfeiçoamento de Pessoal de Nível Supe-rior), FAPERJ (Fundação Carlos Chagas Filho de
Amparo à Pesquisa do Estado do Rio de Janeiro),
and ANP (Agência Nacional de Petróleo) for provi-ding scholarships and for support.
REFERENCES
Allen, M. P., Tildesley, D. J., Computer Simulation of Liquids. Oxford United Press, New York (1989). Artola, P. -A., Rousseau, B., Thermal diffusion in
simple liquid mixtures: what have we learnt from molecular dynamics simulations? Mol. Phys., 111 (22-23), 3394 (2013).
Berendsen, H. J. C., Postma, J. P. M., van Gunsteren, W. F., DiNola, A. and Haak, J. R., Molecular dy-namics with coupling to an external bath. J. Chem. Phys., 81, 3684 (1984).
Bevington, P. R., Robinson, D. K., Data Reduction and Error Analysis for Physical Sciences. McGraw-Hill, 3rd Edition, New York (2002). Brown, W. M., Wang, P., Plimpton, S. J. and
Thar-rington, A. N., Implementing molecular dynamics on hybrid high performance computers - short range forces. Comp. Phys. Comm., 182, 898 (2011). Brown, W. M., Kohlmeyer, A., Plimpton, S. J. and
Tharrington, A. N., Implementing molecular dy-namics on hybrid high performance computers - particle-particle particle-mesh. Computer Physics Comm., 183, 449 (2012).
Buhn, J. B., Bopp, P. A., Hampe, M. J., A molecular dynamics study of a liquid–liquid interface: struc-ture and dynamics. Fluid Phase Equilib., 224, 221 (2004).
Chapman S., On the law of distribution of molecular velocities, and on the theory of viscosity and ther-mal conduction, in a non-uniform simple mono atomic gas. Philos. Trans. Royal Soc. A, 216, 279 (1916).
de Groot, D. and Mazur, P., Non-Equilibrium Thermo-dynamics. Dover Publications, New York (1984). Demirel, Y., Nonequilibrium Thermodynamics:
Trans-port and Rate Processes in Physical, Chemical and Biological Systems. Elsevier, 2nd Ed., Am-sterdam (2007).
Dreisbach, R. R., Physical properties of chemical compounds II. American Chemical Society, Wash-ington D. C. (1959).
Douglas, D. C. and McCall, D. W., Diffusion in Par-affin Hydrocarbons. J. Phys. Chem., 62(9), 1102 (1958).
Evans, D. J., Morriss, G. P., Statistical Mechanics of Nonequilibrium Liquids. Academic Press, Lon-don (1990).
Enskog, D., Remarks on a fundamental equation in kinetic gas law. Physik. Zeits, 12, 533 (1911). Ertl, H., Dullien, F. A. L., Self-diffusion and
viscos-ity of some liquids as a function of temperature. AIChE Journal, 19, 1215 (1973).
Fernández, G. A., Vrabec, J., Hasse, H., A molecular simulation study of shear and bulk viscosity and thermal conductivity of simple real fluids. Fluid Phase Equilb., 221, 157 (2004).
Galliero, G., Colombanic, J., Boppd, P. A., Duguayd, B., Caltagironeb, J. P., Montele, F., Thermal dif-fusion in micropores by molecular dynamics com-puter simulations. Physica, A, 361, 494 (2006). Galliéro, G., Duguay, B., Caltagirone, J.-P. and
Mon-tel, F., On thermal diffusion in binary and ternary Lennard-Jones mixtures by non-equilibrium mo-lecular dynamics. Philos. Mag., 83(17-18), 2097 (2003).
Galliéro, G., Srinivasan, S. and Saghir, M. Z., Esti-mation of thermodiffusion in ternary alkane mix-tures using molecular dynamics simulations and an irreversible thermodynamic theory. High Temp-High Press, 38, 315 (2010).
Ghorayeb, K., Anraku, T., Firoozabadi, A., Inter-pretation of the fluid distribution and GOR be-havior in the Yufutsu fractured gas-condensate Field. SPE, SPE59437 (2000).
Hafskjold, B., Ratkje, S. K., Criteria for local equi-librium in a system with transport heat and mass. J. Stat. Phys., 78, 463 (1995).
Hafskjold, B., Tamio, I., and Ratkje, S. K., On the molecular mechanism of thermal diffusion in liq-uids. Mol. Phys., 80(6), 1389 (1993).
Hannaoui, R., Galliero, G., Ameur, D. and Boned, C., Molecular dynamics simulations of heat and mass transport properties of a simple binary mixture in micro/meso-pores. Chem. Phys., 389, 53(2011). Hannaoui, R., Galliéro, G. and Boned, C., Molecular
dynamics simulation of thermodiffusion and mass diffusion in structureless and atomistic micro-pores. C. R. Mecanique, 341, 469 (2013).
Kincaid, J. M. and Hafskjold, B., Thermal diffusion factors for the Lennard-Jones/spline system. Mol. Phys., 82, 1099, (1994).
Leahy-Dios, A., Experimental and theoretical inves-tigation of Fickian and thermal diffusion coeffi-cients in hydrocarbon mixtures. Ph.D. Thesis, Yale University (2008).
Liang, Z., Tsai, H., Molecular dynamics simulations of self-diffusion coefficient and thermal conduc-tivity of methane at low and moderate densities.
Fluid Phase Equilib., 297, 40 (2010).
Maier, H. A., Hampe, M. J., Bopp, P. A., MD simula-tions of the Soret effect in simple partially misci-ble binary biphasic mixtures. Chem. Phys. Let., 518, 55 (2011).
Maier, H. A., Bopp, P. A., Hampe, M. J., Non-equi-librium molecular dynamics simulation of the thermocapillary effect. Can. J. Chem. Eng., 90, 833 (2012).
Makrodimitri, Z. A., Unruh, D. J. M., Economou, I. G., Molecular simulation of diffusion of hydro-gen, carbon monoxide and water in heavy n-al-kanes. J. Phys. Chem. B, 115, 1429 (2011). Martin, M. G. and Siepmann, J. I., Transferable
po-tentials for phase equilibria. 1. United-atom de-scription of n-alkanes. J. Phys. Chem., B, 102, 2569 (1998).
Martínez, L., Andrade, R., Birgin, E. G., Martínez, J. M., Packmol: A package for building initial con-figurations for molecular dynamics simulations. J. Comput. Chem., 30(13), 2157 (2009).
Mezquia, D. A., Bou-Ali, M. M., Madariaga, J. A., Santamaria, C., Mass effect on the Soret coeffi-cient in n-alkane mixtures. J. Chem. Phys., 140, 084503 (2014).
Müller-Plathe, F., A simple nonequilibrium molecu-lar dynamics method for calculating the thermal conductivity. J. Chem. Phys., 106, 6082 (1997). Müller-Plathe, F., Reith, D., Cause and effect
re-versed in non-equilibrium molecular dynamics: An easy route to transport coefficients. Comput. Theor. Polym. S., 9, 203 (1999).
Mutoru, J. W., Smith, W., O’Hern, C. and Firooza-badi, A., Molecular dynamics simulations of dif-fusion and clustering along critical isotherms of medium-chain n-alkanes. J. Chem. Phys., 138, 024317 (2013).
Nieto-Draghi, C. and Avalos, J. P., Computing the Soret coefficient in aqueous mixtures using bound-ary driven non equilibrium molecular dynamics. J. Chem. Phys., 122, 114503 (2005).
Nieto-Draghi, C. and Avalos, J. P., Non-equilibrium momentum exchange algorithm for molecular dy-namics simulation of heat flow in multi compo-nent systems. Mol. Phys., 101(14), 2303 (2003). Perronace, A., Ciccotti, G., Leroy, F., Fuchs, A. H.
and Rousseau, B., Soret coefficient for liquid argon-krypton mixtures via equilibrium and non equilibrium molecular dynamics: A comparison with experiments. Physical Review, E, 66, 031201 (2002).
Brazilian Journal of Chemical Engineering
n-pentane–n-decane mixtures. J. Chem. Phys., 116, 3718 (2002).
Plimpton, S., Fast parallel algorithms for short-range molecular dynamics. J. Comput. Phys., 117(1), 1 (1995).
Polyakov, P., Muller-Plathe, F. and Wiegand, S., Reverse nonequilibrium molecular dynamics cal-culation of the soret coefficient in liquid hep-tane/benzene mixtures. J. Phys. Chem., B, 112, 14999 (2008).
Reith, D., Müller-Plathe, F., On the nature of thermal diffusion in binary Lennard-Jones liquids. J. Chem. Phys., 112, 2436 (2000).
Shinoda, W., Shiga, M., Mikami, M., Rapid estima-tion of elastic constants by molecular dynamics simulation under constant stress. Phys. Rev., B, 69, 134103 (2004).
Simon, J. M., Dysthe, D. K., Fuchs, A. H., Rousseau, B., Thermal diffusion in alkane binary mixtures. A molecular dynamics approach. Fluid Phase Equilib., 150-151, 151 (1998).
Simon, J. M., Rousseau, B., Dysthe, D. K., Hafskjold, B., Methane – n-decane mixtures by molecular dy-namics using spherical and flexible multicenter
models. Entropies, 217, 29 (1999).
Smit, B., Karaboni, S., Siepmann, J. I., Computer simulations of vapor–liquid phase equilibria of n-alkanes. J. Chem. Phys., 102, 2126 (1995). Toxvaerd, S., Molecular dynamics calculation of
equa-tion of state of alkanes. J. Chem. Phys., 93, 4290 (1990).
Verlet, L., Computer "experiments" on classical fluids. I. Thermodynamical properties of Lennard-Jones molecules. Phys. Rev., 159, 98 (1967).
Würger, J., Is Soret equilibrium a non-equilibrium effect? C. R. Mecanique, 341, 438 (2013).
Zhang, M., Lussetti, E., Souza, L. E. S. and Muller-Plathe, F., Thermal conductivities of molecular liquids by reverse nonequilibrium molecular dy-namics. J. Phys. Chem., B, 109, 15060 (2005). Zhang, M., Müller-Plathe, F., Reverse
nonequilib-rium molecular-dynamics calculation of the Soret coefficient in liquid benzene/cyclohexane mix-tures, J. Chem. Phys., 123, 124502 (2005).