Vol. 32, No. 03, pp. 725 - 734, July - September, 2015 dx.doi.org/10.1590/0104-6632.20150323s00003527
PRELIMINARY MODELING OF AN INDUSTRIAL
RECOMBINANT HUMAN ERYTHROPOIETIN
PURIFICATION PROCESS BY ARTIFICIAL
NEURAL NETWORKS
R. H. R. Garcel
1, O. G. León
2*and E. O. Magaz
11
Centro de Inmunología Molecular, Calle 216, esquina 15, Atabey, Playa, La Habana, Cuba. Código Postal 11600, Phone: (537) 271-7933. Fax: 53(7) 2720644
E-mail: [email protected]; E-mail: [email protected] 2
Grupo Análisis de Procesos, Facultad Ingeniería Química, Instituto Superior Politécnico José Antonio Echeverría, Cujae. Ave. 114, No. 11901 e/ Ciclovía y Rotonda. Marianao, La Habana, Cuba.
Código Postal 19390, Phone: (537) 266-3396. Fax: (537) 2677129 *
E-mail: [email protected]; [email protected]
(Submitted: May 26, 2014 ; Revised: October 14, 2014 ; Accepted: December 2, 2014)
Abstract - In the present study a preliminary neural network modelling to improve our understanding of Recombinant Human Erythropoietin purification process in a plant was explored. A three layer feed-forward back propagation neural network was constructed for predicting the efficiency of the purification section comprising four chromatographic steps as a function of eleven operational variables. The neural network model performed very well in the training and validation phases. Using the connection weight method the predictor variables were ranked based on their estimated explanatory importance in the neural network and five input variables were found to be predominant over the others. These results provided useful information showing that the first chromatographic step and the third chromatographic step are decisive to achieve high efficiencies in the purification section, thus enriching the control strategy of the plant.
Keywords: Neural network; Erythropoietin; Chromatographic purification; Modeling.
INTRODUCTION
Industrial biopharmaceutical production has gradu-ally become dependent on large-scale processes using sensitive mammalian cell cultures (Glassey et al., 2011). The biopharmaceutical market has witnessed the arrival of many new complex therapeutic pro-teins produced in mammalian cell lines (Teixeira et al., 2009). Mammalian hosts have an innate capacity to perform post-translational modifications; in par-ticular, glycosylation is of special interest as it influ-ences the functionality, serum half-life and immuno-genicity of such therapeutics. Several glycoproteins
and monoclonal antibodies with relatively high pro-duction needs are being identified as new drug candi-dates (Walsh, 2006). The Chinese Hamster Ovary (CHO) cell line is one of the most used for obtaining biological therapeutics (Merten, 2006).
use of EPO for the treatment of severe anemia. How-ever, EPO is also massively misused for doping pur-poses. The current pharmaceutical market value is over 12 billion US dollars a year (Hoeksema, 2011).
Once a biopharmaceutical has been approved based on a given process, any significant deviation from the production protocol may require new clini-cal trials to test the safety of the resulting product (“process defines the product”). Since clinical trials are very expensive, process improvements are made under very hard constraints. Therefore, production processes are normally run far below their potential maximum performance (Sommerfeld and Strube, 2005; Teixeira et al., 2009).
Production of rhEPO has potential for improve-ment and is still being investigated (Hoeksema, 2011; Surabattula et al., 2011). Its industrial process production has two main sections, fermentation and purification in chromatographic columns. In the case studied, fermentation takes place in stirred tank bio-reactors with perfusion-based process, which can create relatively high product concentrations and volumetric throughput (Acuna et al., 2011). The purification section is based on 4 chromatographic steps which use affinity chromatography, ion ex-change chromatography and molecular exclusion chromatography.
In the plant of the case studied there has been a great instability in the purification section efficien-cies. In spite of the fact that there is a great amount of registered information, there is a lack of knowl-edge concerning the way the controlled variables impact purification efficiencies.
Multivariate data analysis has a great potential for improving biopharmaceutical production. It can inter-act with several other methods and techniques that analyze the biopharmaceutical manufacturing proc-ess, leading to better understanding of it and exerting control of its quality. Biopharmaceutical processes typically lead to the generation of large multivariate data sets which are highly heterogeneous, correlated, non-linear in nature and with high levels of redun-dancy and noise. The usefulness of multivariate data analysis techniques has been proven in the area of biopharmaceuticals. Their ability to reduce dimen-sionality by removing the redundancy and noise leads to the identification of salient features in the data. These features can subsequently be used in bioprocess monitoring, fault detection and process optimization, as has been described extensively in the literature over the years (Teixeira et al., 2009; Glassey et al., 2011). The inner workings of the ma-jority of batch pharmaceutical processes are not well understood for a fundamental or knowledge-driven
model to be developed. Because such knowledge-driven models provide a much more detailed and insightful view of the process, their development should be pursued and is indeed pursued, for selec-tive critical parts of the process. For the majority of pharmaceutical processes or their processing steps, one needs to rely substantially on the development of data-driven models. The availability on an ever-in-creasing set of off-line and on-line process measure-ments (spectroscopic or otherwise) provides the en-gineer with substantial data as the starting point for developing a data-driven model and, through it, at-taining a certain understanding of the process (Troup and Georgakis, 2013) .
Artificial Neural Networks (ANN) are a powerful tool in multivariate data analysis, applicable to a wide range of problems, especially in the domain of proc-ess modeling. Since ANN have the ability to extract from experimental data the highly non-linear and complex relationships between the variables of the problem without any detailed knowledge of the sys-tem (Si-Moussa et al., 2008; Khaouane et al., 2013) and, given the great amount of available experimen-tal data in the study, it was decided to apply this ap-proach. In this way, it was possible to extract useful information for making decisions without the need to have a theoretical model of process behaviour.
Chromatography has developed from an analyti-cal technology to a well-established separation proc-ess in industry. Large-scale industrial applications have been reported from different industrial fields, e.g. in the petrochemical, pharmaceutical, bio-chemi-cal, and also in the food industry (Engell and Toumi, 2005). ANN have been widely used in liquid chro-matography modeling (Korany et al., 2012; Webb et al., 2009; Tran et al, 2007; Novotna et al., 2005; Loukas, 2000; Gao and Engell, 2004; Satlawa et al., 2013), but in all papers reported, the modeling of the chromatographic purification processes is limited to one column operation level, hence not covering the overall efficiency of a purification section with sev-eral chromatographic steps. On the other hand, ANN have been applied in the rhEPO production process, but only in the fermentation section (Didier, 2008; Didier et al., 2009; Hoeksema, 2011; Forno et al., 2009). No work has been reported concerning appli-cation of ANN to the modelling of the industrial process of EPO purification.
the explanatory contributions of the predictor vari-ables in the network was applied and identified the variables with the biggest contribution to the effi-ciency. This would be very interesting for further applications in monitoring and control of the process, and could be a great help to identify key parameters and to define control spaces, thus increasing the rhEPO productivity.
MATERIALS AND METHODS
Data Set
The data used in this study were provided by the Center of Molecular Immunology in Havana, whose main research objective is the development of new products for the diagnosis and treatment of cancer and other diseases related to the immune system. Data were collected from the operation of the purification section in the rhEPO plant during one campaign, resulting in 204 records.
Eleven input variables were studied: four related to the first chromatographic step (affinity chroma-tography), two related to the second chromatographic step (affinity chromatography) and five related to the third chromatographic step (ion exchange chroma-tography). The output variable of interest was rhEPO yield in bulbs (at the elution of the fourth chroma-tographic step - molecular exclusion chromatography) per liter of supernatant. The selection of these vari-ables was based on the domain knowledge and was made by taking into account criteria from the experts of the plant who considered these inputs relevant.
Two variables related to the supernatant applied in the first chromatographic step were considered:
1. Cell specific perfusion rate, which means the me-dium consumption per cell per day (cspr, nL/cell.day), calculated as the dilution rate divided by the live cell concentration in the bioreactor.
2. rhEPO mass in the supernatant applied (ma-sasnhplc, g), calculated with rhEPO concentration measured via HPLC-RP (High Performance Liquid Chromatography in Reverse Phase).
Variables related to the first chromatographic step, comprising two columns, were:
3. Optical density at 280 nm at the elution of the first column (do280b, AU), measured via spectro-photometry.
4. rhEPO concentration at the elution of the second column (concg25b, mg/mL), measured by optical density.
Variables related to the second chromatographic step were:
5. Relation of the rhEPO mass applied divided by the packed gel volume in the first column (masa_vgch, g/L).
6. Yield of the second chromatographic step with regard to the first chromatographic step (rendch_b, adim.), calculated as the mass of elution of the second step divided by the mass of elution of the first step.
Variables related to the third chromatographic step were:
7. Relation of the rhEPO mass applied divided by the packed gel volume in the column (masa_vgq, g/L).
8. Relation of the optical density at 280 nm divided by the optical density at 260 nm of eluted stream in the column (releluq , adim.).
9. Recovery of rhEPO in the elution of the column (recelucq, percent), calculated as the relation of the eluted mass divided by the total eluted mass in the third step.
10. Relation of the acid rhEPO mass divided by the total rhEPO at the chromatographic step (eluq/ eluq+lavq, adim.).
11. Yield of the third chromatographic step with regard to the second chromatographic step (rendq/ch, adim), calculated as the relation of the mass of elu-tion of the third step divided by the mass of eluelu-tion of the second step.
Variables related to the fourth chromatographic step were:
12. rhEPO yield in bulbs per liter of supernatant (rendbb/lsn, bulbs/L). This is the target variable of the study and is calculated as the relation of the amount of vials obtained divided by the volume of supernatant applied.
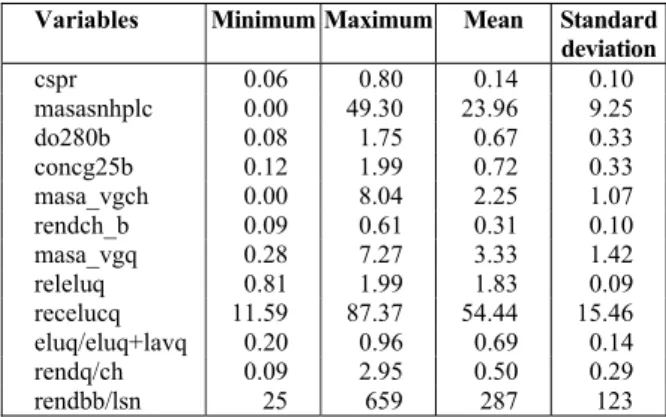
In Table 1 the minimum, maximum, mean and standard deviation values of the variables are presented.
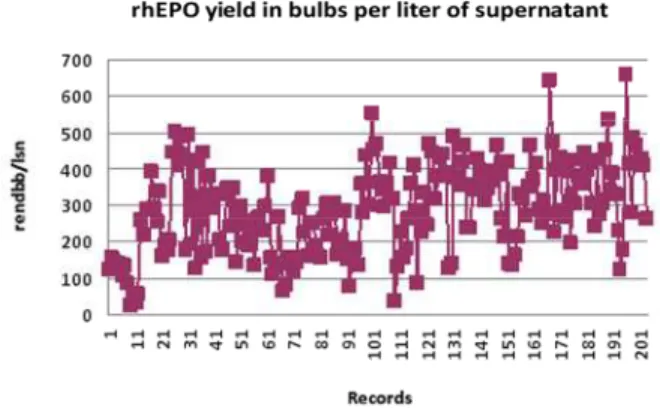
Figure 1 is a synthetic presentation of records for rhEPO yield in bulbs per liter of supernatant before the modeling.
Table 1: A summary of the data set.
Variables Minimum Maximum Mean Standard deviation
cspr 0.06 0.80 0.14 0.10
masasnhplc 0.00 49.30 23.96 9.25
do280b 0.08 1.75 0.67 0.33
concg25b 0.12 1.99 0.72 0.33
masa_vgch 0.00 8.04 2.25 1.07
rendch_b 0.09 0.61 0.31 0.10
masa_vgq 0.28 7.27 3.33 1.42
releluq 0.81 1.99 1.83 0.09
recelucq 11.59 87.37 54.44 15.46
eluq/eluq+lavq 0.20 0.96 0.69 0.14
rendq/ch 0.09 2.95 0.50 0.29
Figure 1: Synthetic presentation of records for rhEPO yield in bulbs per liter of supernatant.
Neural Network
An artificial neural network is a nonlinear statistical data modeling tool that simulates the structure and functional aspects of biological neural networks. Although many differing types of ANN exist, they do possess some common features. They are generally composed of numerous process ele-ments, termed nodes, which are arranged together to form a network. The choice of the architecture of the network depends on the task to be performed and the architecture of the model is specified by the node characteristics, network topology and learning algo-rithm. In standard architecture, neurons are grouped into different layers like input, output and hidden layers. The use of hidden layers confers on ANN the ability to describe nonlinear systems. Good descrip-tions of ANN are given in the literature (Bose and Liang, 1996; Himmelblau, 2000).
One of the most popular neural network para-digms applied to the modeling of a wide range of nonlinear systems, especially chemical and biologi-cal engineering processes, is the feed-forward back propagation neural network (Silva et al., 2000; Khaouane et al., 2013), which has been used in this paper with one hidden layer.
In the present study, 11 variables are used as input parameters in developing of an ANN for rhEPO yield in bulbs per liter of supernatant prediction. These parameters are: cell specific perfusion rate (cspr), rhEPO mass applied in the supernatant (masasnhplc), optical density at 280 nm at the elution of the first column (do280b), rhEPO concentration at the elution of the second column (concg25b), relation of the rhEPO mass applied divided by the packed gel volume in the column (masa_vgch), yield of the second chromatographic step with regard to the first chromatographic step (rendch_b), relation between the rhEPO mass applied and packed gel volume in
the column (masa_vgq), relation of the the optical density at 280 nm divided by the optical density at 260 nm of eluted stream in the column (releluq), recovery of rhEPO in the elution of the column (recelucq), relation of the acid rhEPO mass divided by the total rhEPO in the chromatographic step (eluq/eluq+lavq) and yield of the third chromato-graphic step with regard to the second chroma-tographic step (rendq/ch). All inputs were normalized.
The network was trained and validated by using 70% and 30% of 204 data sets, respectively. The network training was carried out by the Levenberg– Marquardt back propagation algorithm. A trial-and-error approach was used to minimize the trial-and-error in order to determine the optimal number of hidden neurons. The number of hidden neurons in the hidden layer is a crucial parameter. If the number is too small, the ANN may not reflect the complex relationship between input and output value. On the contrary, a large number may create such a complex network that it might lead to a very large output error caused by over fitting of the training sample set. In the present study, the number of neurons in the hidden layer was optimized using trial and error methods during the training stage. Neurons in the input layer have no transfer function. A tan-sigmoid (tansig) transfer function was used in the hidden layer, while a pure linear (purelin) transfer function was used in the output layer.
To judge the performance of the network, the Mean Square Error function (MSE) and correlation coefficient (R-value) from post-training regression analysis were used.
The development procedure of the ANN described above was carried out by elaborating a MATLAB program under MATLAB Neural Network Toolbox Release 14.
Connection Weight Method
Complex supervised learning Data Mining meth-ods, such as Neural Networks, Support Vector Ma-chines and ensembles, are capable of high quality prediction results and thus are useful to support deci-sion making. However, the obtained models are often treated as black boxes, since they are difficult to understand by humans. Improving model interpret-ability increases the acceptance of the Data Mining results by the domain users and this is an important issue in critical applications, such as control or medi-cine (Cortez and Embrechts, 2011).
variables (input) and dependent variables (output). This is a major reason why they are usually called “black boxes” (De Oña and Garrido, 2014). This arises from the fact that the internal characteristic of a trained network is a set of numbers that are very difficult to relate back to the application in a mean-ingful fashion (Paliwal and Kumar, 2011). In the last few years, several methods have been proposed to assess the relative importance of each explanatory variable (Olden and Jackson, 2002; Olden et al., 2004; Papadokonstantakis et al., 2006; Watts and Worner, 2008; Paliwal and Kumar, 2011; Cortez and Embrechts, 2013; De Oña and Garrido, 2014). Never-theless, it has not been possible to reach a consensus on which is the best-performing method. Despite the variety of methods studied, there is no general con-sensus on which model is the best for determining the contribution of variables (De Oña and Garrido, 2014).
The connection weight method is a well-known method existing in the literature which has been used with good results (Olden and Jackson, 2002; Olden et al., 2004; Papadokonstantakis et al., 2006; Watts and Worner, 2008; Paliwal and Kumar, 2011). This method calculates the sum of products of raw weights of the connection from the input node to the hidden nodes with the connection from hidden node to output nodes for all input nodes. The larger the sum for a given input node, the more the importance of the corresponding input variable. The relative im-portance of a given input variable can be defined as
∑
== h
H
O H H I
I W W
R
1
_
_ )
( (1)
where RI is the relative importance of the input
vari-able I, h is the total number of hidden nodes, WI_H is
the weight of the connection between input node I and hidden node H, and WH_O is the weight of the
connection between hidden node H and output node. The connection weight method has been used in this study in order to rank the importance of inde-pendent variables in predicting the output variable for the neural network.
RESULTS AND DISCUSSION
The properties of the training data determine the number of input and output neurons. In this study, the number of factors (cspr, masasnhplc, do280b, concg25b, masa_vgch, rendch_b, masa_vgq, releluq, recelucq, eluq/eluq+lavq, rendch_b) forced the number
of input neurons to be eleven. The number of re-sponses (rendbb/lsn) forced the number of output neu-rons to be one.
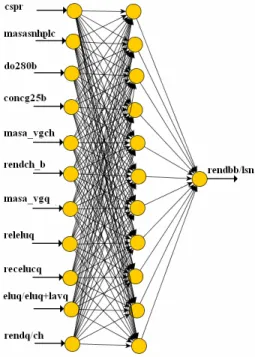
Only one hidden layer was tried and it was sufficient to predict with enough accuracy the rhEPO yield in bulbs per liter of supernatant. This is in line with the fact that the one-hidden-layer, feed-forward neural network trained by the back-propagation algo-rithm is the type of neural network most frequently used, including applications in biological systems (Olden and Jackson, 2001). The number of neurons in the hidden layer is related to the convergence of the error term during the training process. An in-crease in the number of hidden neurons up to a point usually results in a better learning performance. However, too many hidden neurons may allow too much freedom for the weights to be adjusted and result in learning the noise present in the database used in training. Too few hidden neurons limit the ability of the neural network to model the process. Therefore, in this study, the number of the hidden neurons was varied in the range of 10–11. Simplicity of the architecture and accuracy of the results were the requirements imposed to find the optimum archi-tecture. After several trials, it was found that 11 neurons in the hidden layer gave the best perform-ance with an acceptable compromise between network estimation accuracy and network complexity. Thus, the architecture of the proposed ANN model had three layers: 11 neurons in the input layer, 11 neurons in the hidden layer, and 1 neuron in the output layer, (11,11,1), as shown in Figure 2.
204 data points were selected and divided into two data sets, i.e., a training data set and a validation data set. In this study, the input data were divided into a training data set consisting of 70% of the input data and a validation data set consisting of 30% of the input data. The training and validation data sets were selected randomly, and the ANN model was trained using the training data set. The generalized performance of the network was estimated periodi-cally by computing the validation error from the independent validation data set. The error decreased with increasing number of training cycles to a certain point, but again increased with increasing number of training cycles. The training was stopped after 22 iterations as shown in Figure 3 to avoid over fitting of the network.
Figure 3: Training performance of ANN model.
The default performance function for feedforward networks is the Mean Square Error (MSE) - the aver-age squared error between the network outputs and the target outputs.The stop criteria are based on the Mean Square Error for the validation set instead of that for the training set to ensure model generaliza-tion. The average MSE was observed to have reached the error of 0.0042.
The training result of the proposed feed forward network is displayed in Figure 4.
Figure 4: Neural network training results for rhEPO yield in bulbs per liter of supernatant.
As shown, there is a very good agreement be-tween the experimental data and the trained ones. The correlation coefficient (R) is 0.958, close to 1, suggesting the accuracy of the network training. Similar values of the correlation coefficient ranging from 0.95 have been obtained in successful applica-tions of neural network modeling to cell culture me-dium optimization in the context of a bio-phar-maceutical production process (Didier, 2008; Didier et al., 2009; Forno et al., 2009).
These results are promising for further improve-ment of the ANN and are acceptable for quantifying variable importance. The optimum calculated values of network parameters to be used in the connection weight method are given in Tables 2 and 3.
Table 2: Input-Hidden Connection Weights.
Hidden 1
Hidden 2
Hidden 3
Hidden 4
Hidden 5
Hidden 6
Hidden 7
Hidden 8
Hidden 9
Hidden 10
Table 3: Hidden-Output Connection Weights.
Hidden 1
Hidden 2
Hidden 3
Hidden 4
Hidden 5
Hidden 6
Hidden 7
Hidden 8
Hidden 9
Hidden 10
Hidden 11 rendbb/lsn 0.3047 0.1304 -0.2805 0.4239 0.5040 0.3187 0.3206 -0.0438 0.4948 1.3241 -0.1774
Connection Weight Method
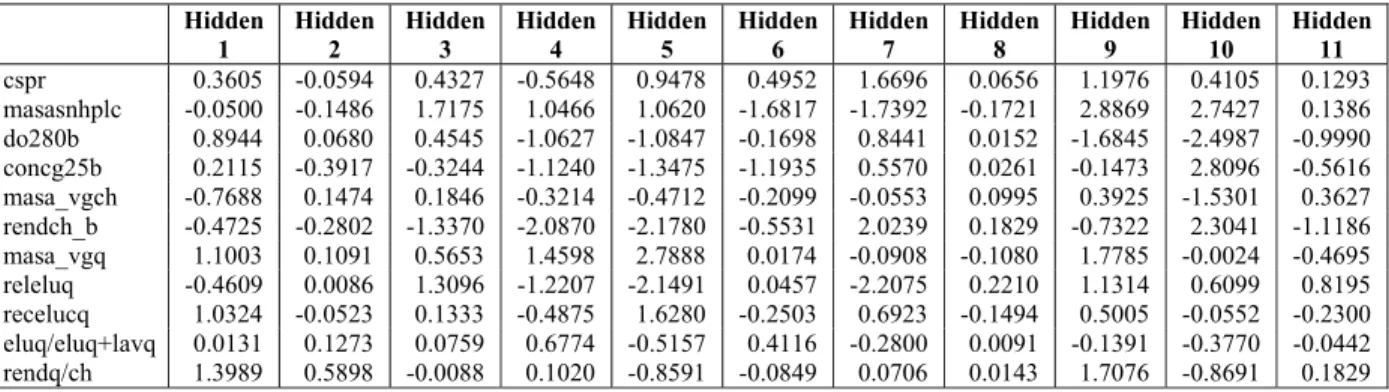
In order to assess the relative contributions of the input variables in prediction of the output,the con-nection weight method was applied. Tables 4 and 5 show the Connection Weights Products for the neural network and relative importance of the input vari-ables obtained with their rank, respectively.
The relative contributions of the independent vari-ables to the predictive output of the neural network depend primarily on the magnitude and direction of the connection weights. Input variables with larger connection weights represent greater intensities of signal transfer, and therefore are more important in the prediction process compared to variables with smaller weights. Negative connection weights repre-sent inhibitory effects on neurons (reducing the in-tensity of the incoming signal) and decrease the value of the predicted response, whereas positive con-nection weights represent excitatory effects on
neu-rons (increasing the intensity of the incoming signal) and increase the value of the predicted response (Olden and Jackson, 2002). Since the Connection Weight Ap-proach uses raw connection weights, it accounts for the direction of the input–hidden–output relationship and allows accounting for the contrasting influences thus resulting in the correct identification of the vari-able contribution. This approach can thus success-fully identify the true importance of all the variables in the neural network, including variables that ex-hibit both strong and weak correlations with the re-sponse variable (Olden et al., 2004).
Table 5 shows that the relation of the applied rhEPO mass divided by the packed gel volume in the column of the third chromatographic step (masa_vgq) is ranked the first, which matchs with results obtained in the operation of the plant; it has been verified before from lab scale experiments that this column has a high reserve in terms of adsorption capacity.
Table 4: Connection Weights Products.
Hidden 1
Hidden 2
Hidden 3
Hidden 4
Hidden 5
Hidden 6
Hidden 7
Hidden 8
Hidden 9
Hidden 10
Hidden 11 cspr 0.3605 -0.0594 0.4327 -0.5648 0.9478 0.4952 1.6696 0.0656 1.1976 0.4105 0.1293 masasnhplc -0.0500 -0.1486 1.7175 1.0466 1.0620 -1.6817 -1.7392 -0.1721 2.8869 2.7427 0.1386 do280b 0.8944 0.0680 0.4545 -1.0627 -1.0847 -0.1698 0.8441 0.0152 -1.6845 -2.4987 -0.9990 concg25b 0.2115 -0.3917 -0.3244 -1.1240 -1.3475 -1.1935 0.5570 0.0261 -0.1473 2.8096 -0.5616 masa_vgch -0.7688 0.1474 0.1846 -0.3214 -0.4712 -0.2099 -0.0553 0.0995 0.3925 -1.5301 0.3627 rendch_b -0.4725 -0.2802 -1.3370 -2.0870 -2.1780 -0.5531 2.0239 0.1829 -0.7322 2.3041 -1.1186 masa_vgq 1.1003 0.1091 0.5653 1.4598 2.7888 0.0174 -0.0908 -0.1080 1.7785 -0.0024 -0.4695 releluq -0.4609 0.0086 1.3096 -1.2207 -2.1491 0.0457 -2.2075 0.2210 1.1314 0.6099 0.8195 recelucq 1.0324 -0.0523 0.1333 -0.4875 1.6280 -0.2503 0.6923 -0.1494 0.5005 -0.0552 -0.2300 eluq/eluq+lavq 0.0131 0.1273 0.0759 0.6774 -0.5157 0.4116 -0.2800 0.0091 -0.1391 -0.3770 -0.0442 rendq/ch 1.3989 0.5898 -0.0088 0.1020 -0.8591 -0.0849 0.0706 0.0143 1.7076 -0.8691 0.1829
Table 5: Connection Weights method results.
Importance Rank
Cspr 5.0846 3
Masasnhplc 5.8027 2
do280b -5.2234 11
concg25b -1.4859 7
masa_vgch -2.1700 9
rendch_b -4.2475 10 masa_vgq 7.1486 1 Releluq -1.8924 8 Recelucq 2.7619 4
eluq/eluq+lavq -0.0418 6
The rhEPO mass applied in the supernatant (ma-sasnhplc) and the cell specific perfusion rate (cspr) ranked the second and the third, respectively, which is a very important result taking into account that these variables can be manipulated from fermentation.
Recovery of rhEPO in the elution of the column (recelucq), yield of the third chromatographic step with regard to the second chromatographic step (rendq/ch) and relation between acid rhEPO mass and total rhEPO at the chromatographic step (eluq/ eluq+lavq) ranked the fourth, the fifth and the sixth, respectively.
Given these results it is clear that the first chro-matographic step and the third chrochro-matographic step are decisive to get high rhEPO efficiencies in bulbs per liter of supernatant. Therefore, it is necessary to improve the control of these steps. It was decided to redefine three operational parameters: the in fermen-tation area cspr variable was defined as critical pa-rameter and the in purification area masa_vgch and masa_vgq variables were defined as key parameters.
The following variables show negative values in Table 5: concg25b (rhEPO concentration at the elution of the second column of the first chromatographic step), releluq (relation of the optical density at 280 nm divided by the optical density at 260 nm of eluted stream in the column of the third chromatographic step), masa_vgch (relation of the rhEPO mass ap-plied divided by the packed gel volume in the first col-umn of the second chromatographic step), rendch_b (yield of the second chromatographic step with re-gard to the first chromatographic step) and do280b (optical density at 280 nm at the outlet of the first column). This result may be influenced by the great variability of these variables during the studied campaign.
Although the connection weight method suffers from some drawbacks, particularly when a high de-gree of interaction between predictor variables can be expected, it could be used in the model-building stage to help reduce the complexity of the model by suggesting the elimination of variables which either do not significantly impact the output variable or whose impact could be assessed by an input variable already in the model. In this regard the results ob-tained in this preliminary study have given useful information for further research. In order to improve the ANN performance, input variables are being pre-processed, using the Principal Components Analysis technique, before they are fed to the backpropagated ANN. More data is being gathered as well, so as to get an independent test set which was not used in both the training and validation process. In this way, the generalization capabilities of the developed neural
network may be investigated for further simulation purposes.
CONCLUSION
In the present study, the possibilities of neural network modelling to gain knowledge about the pu-rification process in rhEPO production were ex-plored with satisfactory results. An ANN model was developed to predict the rhEPO yield in bulbs per liter of supernatant for the purification section as a function of eleven operational variables. The ANN model performed very well in the training and vali-dation phases, and was very effective to capture most of the important patterns related to four chroma-tographic purification steps. The connection weight method was used for quantifying the importance of the variables and its application showed five input variables to be predominant over the others. These results provided useful information showing that the first chromatographic step and the third chroma-tographic step are decisive to get high rhEPO yields in bulbs per liter of supernatant, thus enriching the control strategy of the plant. The fairly good results obtained indicate that ANNs are promising tools not only in modelling of the EPO purification process, but also in providing insight from the learned rela-tionship, which assist the modeller in understanding the process under investigation, as well as in evalua-tion of the model. Given the usefulness of the results obtained with this preliminary neural network mod-elling, improvement of the model will be the focus of future research.
NOMENCLATURE
ANN Artificial Neural Networks
CHO Chinese Hamster Ovary
concg25b rhEPO concentration at the elution of the second column
cspr Cell specific perfusion rate do280b Optical density at 280 nm at the
elution of the first column eluq/eluq+lavq Relation of the acid rhEPO mass
divided by the total rhEPO at the chromatographic step
EPO Erythropoietin
h Total number of hidden nodes
HPLC-RP High Performance Liquid
Chromatography in Reverse Phase masasnhplc rhEPO mass in the supernatant
masa_vgch Relation of the rhEPO mass applied divided by the packed gel volume in the column
masa_vgq Relation between the rhEPO mass applied and packed gel volume in the column
MSE Mean Square Error
R Correlation coefficient
recelucq Recovery of rhEPO in the elute of the column
releluq Relation of the optical density at 280 nm divided by the optical density at 260 nm of the eluted stream in the column
rendch_b Yield of the second chromatographic step with regard to the first
chromatographic step
rendq/ch Yield of the third chromatographic step with regard to the second chromatographic step
rhEPO Recombinant Human Erythropoietin RI Relative importance of the input
variable I
WH_O Weight of the connection between hidden node H and output node WI_H Weight of the connection between
input node I and hidden node H
REFERENCES
Acuna, J., Hewitt, M., Johnston, R., Kirkland, D., Shikibu, T. and Zhang, D., Modeling perfusion processes in biopharmaceutical production. Bio-Process Int., 9, 52-59 (2011).
Bose, N. K. and Liang, P., Neural Networks Funda-mentals with Graphs, Algorithms, and Applica-tions, in Electrical and Computer Engineering. McGraw-Hill Series, McGraw-Hill Companies, Inc., USA (1996).
Butler, M., Animal cell cultures: Recent achievements and perspectives in the production of biopharma-ceuticals. Appl. Microbiol. Biotechnol., 68, 283-291 (2005).
Cortez, P. and Embrechts, M. J., Opening black box data mining models using sensitivity analysis. Symposium on Computational Intelligence and Data Mining (CIDM), Paris, 11-15 April (2011). Available at: <http://repositorium.sdum.uminho.pt/ bitstream/1822/14836/1/blackbox.pdf>
Cortez, P. and Embrechts, M. J., Using sensitivity analysis and visualization techniques to open black box data mining models. Information Sci-ences, 225, 1-17 (2013).
De Oña, J. and Garrido, C., Extracting the contribu-tion of independent variables in neural network models: A new approach to handle instability. Neu-ral Computing and Applications, March (2014). Didier, C., Optimización de la producción de
eritro-poyetina humana recombinante (rhEPO) mediante el cultivo de células animales. Tesis de maestría en Bioquímica, Universidad Nacional del Litoral, Facultad de Bioquímica y Ciencias Biológicas (2008). Available at: < http://bibliotecavirtual.unl. edu.ar:8180/tesis/bitstream/1/173/1/tesis1.pdf> (In Spanish).
Didier, C., Forno, G., Etcheverrigaray, M., Kratje, R. and Goicoechea, H., Novel chemometric strategy based on the application of artificial neural net-works to crossed mixture design for the improve-ment of recombinant protein production in con-tinuous culture. Anal Chim. Acta, 650, 167-74 (2009).
Engell, S. and Toumi, A., Optimisation and control of chromatography. Computers and Chemical En-gineering, 29 1243-1252 (2005).
Forno, G., Didier, C., Etcheverrigaray, M., Goicoechea, H. and Kratje, R., Crossed mixture design and ar-tificial neural networks: An efficient approach to cell culture medium optimization. Proceedings of the 21st Annual Meeting of the European Society for Animal Cell Technology (ESACT), Dublin, Ireland, June 7-10 (2009).
Gao, W. and Engell, S., Neural network-based identi-fication of nonlinear adsorption isotherms. 7th In-ternational Symposium on Dynamics and Control of Process Systems DYCOPS 7, Cambridge, USA, July 5-7 (2004). Available at: <http://www.nt.ntnu. no/users/skoge/prost/proceedings/dycops04/pdffiles/ papers/132.pdf>
Glassey, J., Gernaey, K. V., Clemens, C., Schulz, T. W., Oliveira, R. Striedner, G. and Mandenius C. F., Process analytical technology (PAT) for biophar-maceuticals, Biotechnol. J., 6, 369-377 (2011). Himmelblau, D. M., Applications of artificial neural
networks in chemical engineering. Korean J. Chem. Eng., 17(4), 373-392 (2000).
Hoeksema, F., Selection markers and expression en-hancing elements: Novel strategies to create mam-malian production cell lines. Faculty of Science. University of Amsterdam. Thesis Dissertation (2011). Available at: <http://dare.uva.nl/document/ 482571>
Korany, M. A., Mahgoub, H., Fahmy, O. T. and Maher, H. M., Application of artificial neural networks for response surface modeling in HPLC method development. Journal of Advanced Research, 3, 53-63 (2012).
Loukas, Y. L., Artificial neural networks in liquid chromatography: Efficient and improved quantita-tive structure–retention relationship models. Jour-nal of Chromatography, A, 904, 119-129 (2000). Available at: <http://144.206.159.178/FT/553/30150/ 521375.pdf>
Merten, O. W., Introduction to animal cell culture technology–past, present and future. Cytotechnol-ogy, 50, 1-7 (2006).
Novotna, K., Havlis, J. and Havel, J., Optimisation of high performance liquid chromatography sepa-ration of neuroprotective Peptides: Fractional ex-perimental designs combined with artificial neu-ral networks. J. Chromatogr., A, 1096(1-2), 50-7 (2005).
Olden, J. D. and Jackson, D. A., Fish-habitat rela-tionships in lakes: Gaining predictive and ex-planatory insight by using artificial neural net-works. Transactions of the American Fisheries Society 130, 878-897 (2001).
Olden, J. D. and Jackson, D. A., Illuminating the “black box”: a randomization approach for under-standing variable contributions in artificial neural networks. Ecological Modelling, 154, 135-150 (2002).
Olden, J. D., Joy, M. K. and Death, R. G., An accu-rate comparison of methods for quantifying vari-able importance in artificial neural networks us-ing simulated data. Ecological Modellus-ing, 178, 389-397 (2004).
Paliwal, M. and Kumar, U. A., Assessing the contri-bution of variables in feed forward neural net-work. Appl Soft Comput., 11, 3690-3696 (2011). Papadokonstantakis, S., Lygeros, A. and Jacobsson,
S. V., Comparison of recent methods for inference of variable influence in neural networks. Neural Networks, 19, 500-513 (2006).
Satlawa, T., Grabska-Chrzastowska, J. and Korohoda, P., Application of multidimensional data analysis to chromatography. Image Processing & Commu-nication, 18(2-3), 101-108 (2013).
Silva, R. G., Cruz, A. J. G., Hokka, C. O., Giordano, R. L. C. and Giordano, R. C., A hybrid feedfor-ward neural network model for the cephalosporin C production process. Braz. J. Chem. Eng., 17, 587-598 (2000).
Si-Moussa, C., Hanini, S., Derriche, R., Bouhedda, M. and Bouzidi, A., Prediciton of high-pressure vapor liquid equilibrium of six binary systems, car-bon dioxide with six esters, using an artificial neural network model. Braz. J. Chem. Eng., 25, 183-199 (2008).
Sommerfeld, S. and Strube, J., Challenges in bio-technology production – generic processes and process optimization for monoclonal antibodies. Chem. Eng. Process, 44, 1123-37 (2005).
Surabattula, R., Sambasiva, K. R. S. and Polavarapu, R., An optimized process for expression, scale-up and purification of recombinant erythropoietin produced in Chinese hamster ovary cell culture. Research in Biotechnology, 2(3), 58-74 (2011). Teixeira, A. P., Oliveira, R., Alves, P. M. and
Car-rondo, M. J. T., Advances in on-line monitoring and control of mammalian cell cultures: Support-ing the PAT initiative. Biotechnology Advances, 27, 726-732 (2009).
Tran, A. T. K., Hyne, R. V., Pablo, F., Day, W. R. and Doble, P., Optimisation of the separation of herbi-cides by linear gradient high performance liquid chromatography utilising artificial neural net-works. Talanta, 71(3), 1268-75 (2007).
Troup, G. M. and Georgakis, C., Process systems engineering tools in the pharmaceutical industry. Computers & Chemical Engineering, 51, 157-171 (2013).
Walsh, G., Biopharmaceutical benchmarks 2006. Nat. Biotechnol., 24,769-76 (2006).
Watts, M. J. and Worner, S. P., Using artificial neural networks to determine the relative contribution of abiotic factors influencing the establishment of insect pestpecies. Ecological Informatics, 3, 64-74 (2008).