Integrated Computational Solution for
Predicting Skin Sensitization Potential of
Molecules
Konda Leela Sarath Kumar1,2☯, Sujit R. Tangadpalliwar1,2☯, Aarti Desai1, Vivek K. Singh1, Abhay Jere1*
1LABS, Persistent Systems Limited, Pune, Maharashtra, India,2Department of Pharmacoinformatics, National Institute of Pharmaceutical Education and Research (NIPER), Hajipur, Vaishali, Bihar, India
☯These authors contributed equally to this work. *[email protected]
Abstract
Introduction
Skin sensitization forms a major toxicological endpoint for dermatology and cosmetic prod-ucts. Recent ban on animal testing for cosmetics demands for alternative methods. We developed an integrated computational solution (SkinSense) that offers a robust solution and addresses the limitations of existing computational tools i.e. high false positive rate and/or limited coverage.
Results
The key components of our solution include: QSAR models selected from a combinatorial set, similarity information and literature-derived sub-structure patterns of known skin protein reactive groups. Its prediction performance on a challenge set of molecules showed accu-racy = 75.32%, CCR = 74.36%, sensitivity = 70.00% and specificity = 78.72%, which is bet-ter than several existing tools including VEGA (accuracy = 45.00% and CCR = 54.17% with
‘High’reliability scoring), DEREK (accuracy = 72.73% and CCR = 71.44%) and TOPKAT (accuracy = 60.00% and CCR = 61.67%). Although, TIMES-SS showed higher predictive power (accuracy = 90.00% and CCR = 92.86%), the coverage was very low (only 10 out of 77 molecules were predicted reliably).
Conclusions
Owing to improved prediction performance and coverage, our solution can serve as a useful expert system towards Integrated Approaches to Testing and Assessment for skin sensiti-zation. It would be invaluable to cosmetic/ dermatology industry for pre-screening their mol-ecules, and reducing time, cost and animal testing.
a11111
OPEN ACCESS
Citation:Sarath Kumar KL, Tangadpalliwar SR, Desai A, Singh VK, Jere A (2016) Integrated Computational Solution for Predicting Skin Sensitization Potential of Molecules. PLoS ONE 11 (6): e0155419. doi:10.1371/journal.pone.0155419
Editor:Roberto Amendola, ENEA, ITALY
Received:August 21, 2015
Accepted:April 28, 2016
Published:June 7, 2016
Copyright:© 2016 Sarath Kumar et al. This is an open access article distributed under the terms of the Creative Commons Attribution License, which permits unrestricted use, distribution, and reproduction in any medium, provided the original author and source are credited.
Data Availability Statement:All relevant data are within the paper and its Supporting Information files. SkinSense software is available athttps://github.com/ vivek-k-singh/SkinSense.
Introduction
In cosmetic industry, one of the major determinant for topical products is‘skin sensitiza-tion’[1]. Usually the term‘skin sensitization’refers to heightened immune response in suscepti-ble individuals on topical exposure to a molecule[2]. Conventionally, Buehler guinea pig test (BGPT), guinea pig maximization test (GPMT) and more recently the murine local lymph node assay (LLNA)[3] are used to assess the skin sensitization potential of a molecule. How-ever, animal testing for cosmetic ingredients is banned in European Union[4], and the REACH (Registration, Evaluation and Authorization of Chemicals) policy[5] enforces that companies assess, manage and communicate the risks associated with molecules manufactured by them. Considering these circumstances, there is an urgent need to devise alternative methods that can reduce the effort and cost, and more importantly, eliminate the usage of animals in cos-metic research. The recently published Adverse Outcome Pathway (AOP) for skin sensitization by OECD[6] summarizes the causal links between molecular initiaing event of skin sensitiza-tion (i.e. modificasensitiza-tion of skin protein by a molecule), intermediate key events and the adverse outcome at biological level[7]. This mechanistic knowledge offers opportunity to develop effi-cient methods or map existing ones (in vitro,in chemicoorin silico) for assessing skin sensitiza-tion without the need for animal testing[7]. For e.g. Thein vitroassays such as
KeratinoSensTM[8,9] and human-Cell line Activation Test (h-Clat)[10] were mapped to partic-ular key events of this AOP [11,12].
Computational (in silico) approach, due to its cost- and resource- efficiency, could be an alternative toin vivoand possiblyin vitroevaluation of skin sensitization potential with refer-ence to AOP[13,14]. This approach includes the use of statistical, mechanism based and knowl-edge based methodologies to predict the skin sensitization potential of molecules[15,16]. The
‘Statistical Approach’uses: (1) already available skin sensitization data to select appropriate molecular descriptors (e.g. number of nitrogen atoms, number of double and triple bonds, etc.); and (2) regression or classification algorithms for classifying test molecules into sensitiz-ers and non-sensitizsensitiz-ers[17]. The‘Mechanism Based’approach utilizes heats of reaction[18], Taft coefficients or experimental measures of reactivity with nucleophiles to correlate with skin sensitization potential of molecules[17] while the‘Knowledge Based’approach usually uses rules (alerts) devised by domain experts. Usually an‘alert’is prediction of a toxicophore that could be potentially associated with skin sensitization, and is derived from chemical grouping or empirical rules[17].
The three approaches stated above are incorporated in (Quantitative) Structure Activity Relationship [(Q)SAR] models and expert systems designed to predict skin sensitization poten-tial of molecules. Skin sensitization (Q)SAR model refers to a mathematical equation that relates chemical structure (or properties) of molecules to skin sensitization potential in a quan-titative manner[19,20]. On the other hand, expert systems are encoded in the form of rules, used for evaluating skin sensitization potential. These rules are derived by using either expert judgment (e.g. DEREK), statistical inference (e.g. Case Ultra, TOPKAT and VEGA) or combi-nation of both i.e. hybrids (e.g. TIMES-SS)[21].
A recent report evaluating[21] the performance of Case Ultra, TOPKAT, DEREK, VEGA v2.1.3, TIMES-SS v2.27, Toxtree and the OECD (Q)SAR toolbox v3.1 showed that these mod-els suffer from: (1) unsatisfactory performance, i.e. high rate of false positives; and/or (2) lim-ited coverage, i.e. only small sub-set of the test molecules were reliably predicted. Another study evaluating DEREK, TOPKAT and TOPS-MODE also reported similar findings i.e. high sensitivity but poor specificity[22]. We believe that limited dataset in terms of either size or diversity, and the lack of mechanistic knowledge in the prediction models could be major con-tributory factors for these limitations.
To address these limitations and offer a robust solution, we have developed a new approach for predicting skin sensitization potential of molecules. The novelty of our approach lies pri-marily in the incorporation of three important components for prediction: (1) multiple QSAR models, which were built using large publicly available data on sensitizers (of various potency classes) and non-sensitizers; (2) structural similarity to known sensitizers and non-sensitizers; and (3) presence of sub-structure(s) associated with skin sensitization reaction mechanisms. This allowed us to integrate two complementary approaches i.e. statistical and mechanistic by a unique strategy, which helped achieve improved prediction performance and coverage. We tested our predictions on a challenge set[21] and obtained prediction accuracy of 75.32%, Cor-rect Classification Rate (CCR) = 74.36%, sensitivity = 70.00% and specificity = 78.72%. Our results are far better as compared to widely used tool VEGA v1.08, which showed an accuracy of only 44.12%. To summarize, our integrated skin sensitization prediction solution‘SkinSense’
has improved accuracy, better sensitivity and more specificity compared to the currently avail-able solutions.
Methods
Building of QSAR Models for Skin Sensitization
Briefly, building of QSAR models for skin sensitization involves: (1) collation of available skin sensitization data; (2) selection, computation and reduction (if required) of suitable descriptors (e.g. chemical, topological) and fingerprints; (3) creation of datasets for training and testing classifiers; and (4) applying appropriate classifier methods to differentiate sensitizers from non-sensitizers.Fig 1and the description below elaborates the building of our QSAR models in accordance with best practices documented by Tropshaet al.[23].
Collation of skin sensitization dataset. Availability of data regarding molecules already characterized for skin sensitization potential is primary necessity for building, training and testing of QSAR model. This data was collated from literature and the Hazardous Substance DataBase (HSDB), which contains peer-reviewed compilation of toxicology data [24]. While collating data, only those molecules were considered which were tested for skin sensitization using LLNA and GPMT tests[25–29], and REACH allergens listed by Schubert (http://www. istas.ccoo.es/descargas/alergenos_REACH%5B1%5D%28230708%29.pdf). To ensure reliabil-ity, the data used for building models were curated using the following criteria: (1) whether molecule is tested by LLNA in addition to other suitable assays considering that LLNA is the preferred method; (2) whether classification of a molecule (i.e. sensitizer or non-sensitizer) supported by latest research article; and (3) whether CAS registry number for a molecule is unique. Based on this screening, we identified 571 unique molecules systematically character-ized for their skin sensitization potential and denoted this as the‘parent set’.
Molecules in the parent set were further classified (seeTable 1) as Extreme (X), Strong (St), Moderate (M), Weak (W) and Non-sensitizer (N) as reported by Johanssonet al. [29], Kern
et al. [27],Croninet al. [26], Gerbericket al. [25], Enochet al.[28] and HSDB[24], whereas only as Sensitizers (S) and Non-sensitizers (N) by Schubert (http://www.istas.ccoo.es/descargas/ alergenos_REACH%5B1%5D%28230708%29.pdf).
analysis. The remaining 543 molecules were considered for building QSAR models, and hence-forth, referred to as‘Energy-Optimized set (Eo)’.
Using Eo, we built four separate QSAR models to ensure that the characteristics of molecules
with different potency classes were captured appropriately. As shown inTable 1, model-1 was built with Extreme (X) and Strong (St) sensitizers, while model-3 with Moderate (M) and
Fig 1. Steps followed for building QSAR models.QSAR: Quantitative Structure-Activity Relationship; GPMT: Guinea Pig Maximization Test; HSDB: Hazardous Substance DataBase; LLNA: Local Lymph Node Assay; REACH: Registration, Evaluation and Authorization of Chemicals; MLP: Multi-Layer Perceptron; RF: Random Forest; SL: Simple Logistic; SMO: Sequential Minimal Optimization; Numbers in curly brackets represent the count of respective entities (i.e. molecules, descriptors and fingerprints).
model-4 with Weak (W) sensitizers respectively. Model-2 represented a generalized model for X, St and S (i.e. sensitizers with unknown potency). For model-1, all the extreme (= 17) and strong (= 32) sensitizers, and 49 non-sensitizers from Eowith least average similarity were
con-sidered. All non-sensitizers were not considered in order to avoid biasing the model towards non-sensitizers[23]. For other three models, all the available sensitizers and all the non-sensi-tizers were considered. Weka 3.6.9[34] (henceforth referred to as Weka) was used for building these models.
Descriptor selection, computation and reduction. Descriptors are the properties (for e.g. chemical, topological or geometrical) that can characterize a molecule[35]. In a QSAR model, differences in the values of descriptors are used for differentiating sensitizers from non-sensi-tizers. As discussed below, we relied on statistical analysis to select descriptors whose values dif-fer significantly between sensitizers and non-sensitizers.
PaDEL 2.15[36] is a free and open source software for calculating molecular descriptors and fingerprints. It offers a total of 863 molecular descriptors and 9365 fingerprints, and all were considered as starting set for building our QSAR models. Using T-test (two-sample unequal variance 2-tailed), molecular descriptors whose values differ significantly (i.e. 95% confidence interval) between sensitizers and non-sensitizers were selected for each QSAR model. This set of descriptors was called as [A] and had 86, 168, 87 and 151 descriptors for models-1, 2, 3 and 4 respectively.
Further, to incorporate literature-derived mechanistic details for skin sensitization in our QSAR models, we selected suitable sub-structure fingerprints[37] from PaDEL 2.15[36]. Eleven of them represented skin protein reactive groups, and differed significantly between sensitizers and non-sensitizers in 164 molecules of Eo[28]. This set of sub-structure fingerprints is
hereaf-ter referred to as [B] and T-test, as elaborated above, was used to identify them. An additional 36 sub-structure fingerprints were selected from literature based on reports indicating their association with skin sensitization reaction mechanisms[38–40]. This set of sub-structure fin-gerprints is hereafter referred to as [C]. See Tables A-E inS1 Filefor the descriptors and finger-prints contained in [A], [B] and [C] for each QSAR model.
To further refine the sets of descriptors and fingerprints such that they are mutually inde-pendent (i.e. changing the value of one descriptor does not have an impact on another
Table 1. Datasets used for building QSAR models.
Parent set Eoa Model-1 Model-2 Model-3 Model-4
Xb 18 17 17 17
Stc 32 32 32 32
Sd 206 180 180
Me 90 90 90
Wf 74 74 74
Ng 151 150 49 150 150 150
Total 571 543 98 379 240 224
aEnergy-optimized set bExtreme
cStrong
dSensitizer with unknown potency eModerate
fWeak
gNon-sensitizer.
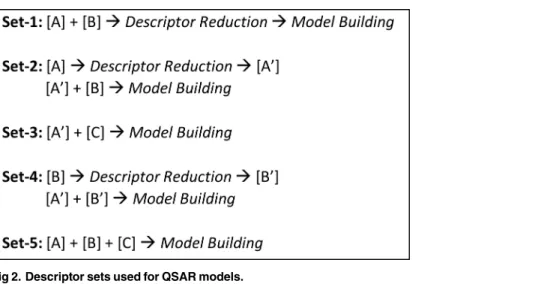
descriptor)[35], reduction protocol was performed using Weka[34].CfsSubsetEvalmodule along with BestFirst method was used for this analysis [41]. We defined 5 combinations (sets) of descriptors and fingerprints for descriptor reduction as depicted inFig 2. Set-1 contains the descriptors from combination of [A] and [B], followed by subsequent reduction. This allowed selection of important yet independent descriptors and fingerprints from [A] and [B] respectively. Sets-2 and 3 ensured that all the fingerprints in [B] and [C] respectively were considered as they were derived from literature, and combined with the independent descriptors from [A] i.e. [A’]. Set-4 conserved all the independent descriptors i.e. [A’] and independent fingerprints from [B] i.e. [B’] respectively, and set-5 allowed all the selected descriptors and fingerprints for the building of QSAR model (i.e. [A] + [B] + [C]). It is important to note that descriptor reduction was not performed for [C] to ensure that all the literature-derived fingerprints associated with skin sensiti-zation mechanisms were retained. Furthermore, for [A], descriptors pertaining to the correspond-ing models (i.e. 86, 168, 87 and 151 descriptors for models-1, 2, 3 and 4 respectively) were used.
Creation of training and test sets. Training and test sets are required for training the clas-sifier methods to differentiate sensitizers from non-sensitizers, and for testing the performance of models. The molecules considered for building each model were divided into training and inter-nal test sets by employing three methods: (1) direct method (D); (2) separation method (S); and (3) cross-validation method (C). Weka[34] was used for performing these computations.
Briefly, direct method involves randomizing the dataset, followed by splitting it into training and test set with 80% and 20% molecules in them respectively. However, direct method does not guarantee proportional distribution of sensitizers and non-sensitizers in training and test sets; hence, we devised‘separation method’to ensure proportional distribution. In separation method, sensitizers and non-sensitizers were pre-segregated manually in two separate files and were provided as input to Weka[34]. The randomization and splitting of these datasets into 80% and 20% molecules was done using Weka[34], and the resulting files were used to create training and test sets with 80% and 20% molecules in them respectively. Cross-validation method involves splitting of dataset into n (= 10 in our case) parts, out of which n-1 parts are used as training set and the nthpart is used as test set. This is iterated until all the parts are used as test set once (seeFig 1).
An additional test set, called‘representative test set (RTS)’, was created from Eoby selecting
equal number of sensitizers and non-sensitizers in following proportion: X = 10, St = 10, S = 10, M = 10, W = 10 and N = 50. The molecules in each class were chosen on the basis of mutually diverse chemical structures as deduced from Tanimoto coefficient[42].
Fig 2. Descriptor sets used for QSAR models.
To benchmark our QSAR models with routinely used tools, a new test set was created by collating molecules from literature, that were not part of dataset used earlier. We collated 76 unique molecules from literature[25–27,43–46], out of which 2 molecules failed at optimiza-tion step described earlier and hence were excluded from further study. The remaining 74 mol-ecules were used as‘challenge set-1’. This test set contained molecules in following proportion: X = 0, St = 10, S = 35, M = 2, W = 11 and N = 16.
Another dataset of 100 molecules, used by Teubneret al.[47] for comparing existing skin sensiti-zation models, was also considered. This set comprised of 45 sensitizers of varying potency and 55 non-sensitizers. Out of these, 19 molecules were present in our parent set, and thus, were removed. Furthermore, 1 sensitizer (CAS number: 52408-42-1) failed during conversion to 2D SDF from SMILES using OpenBabel 2.3.2[30], and 2 sensitizers (CAS numbers: 1307-96-6 and 7758-89-6) and a non-sensitizer (CAS number: 30989-05-0) failed to optimize using vLife-MDS[31]. The remaining 77 molecules i.e. 30 sensitizers and 47 non-sensitizers constituted‘challenge set-2’.
Classifier methods for QSAR models. Classifier methods are required for QSAR models to help classify test molecules into sensitizers and non-sensitizers. Following classifier methods from Weka[34] were chosen[48–52]: MLP (Multi-Layer Perceptron)[48], SMO (Sequential Minimal Optimization)[49], J48[50], RF (Random Forest)[51] and SL (Simple Logistic)[52]. MLP is a representative of artificial neural network, SMO for support vector machine, J48 for decision tree, RF for ensemble of decision trees and SL for logistic regression. All classifier methods were used with default parameters except for RF where 100 trees (i.e. I = 100) was used based on earlier recommendation[53].
Consensus Prediction Using QSAR Models, Similarity Information and
Sub-Structure Pattern
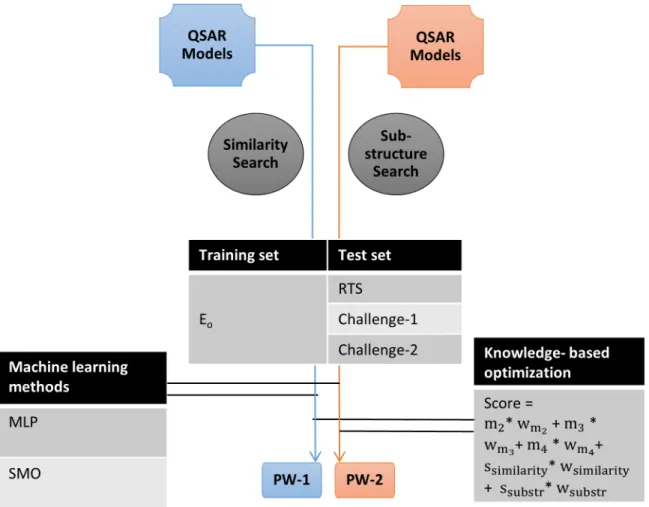
A unique aspect of our study is the integration of QSAR models (see section titled“Integrated prediction workflows”for detail on selection of models), similarity information (see section titled“Identification of structurally similar molecules in the dataset”for detail) and sub-struc-ture pattern (see section titled“Identification of sub-structures associated with skin sensitiza-tion reacsensitiza-tion mechanisms”for detail) into‘Prediction Workflows’(PW) for classifying a molecule as sensitizer or non-sensitizer. To achieve this integration, we employed two
approaches: machine learning methods available in Weka[34] and knowledge-based (KB) opti-mization[54,55] (seeFig 3).
Amongst machine learning methods, MLP and SMO (i.e. implementation of support vector machine) were used due to their suitability for the optimization of QSAR models[56]. Eowas
used for training using cross-validation method (with n = 10 in our case) (see Table F inS1 File
for details). The performance of these classifiers were evaluated using Eoand RTS, and
chal-lenge sets-1 and 2 in Weka[34].
For knowledge-based optimization[54,55], a weighted sum of predictions from components i.e. QSAR models, similarity information and sub-structure pattern was used to compute the final score of a test molecule (seeFig 3andEq 1). In this, scores from prediction components (e.g. QSAR models m2, m3and m4) were multiplied by their corresponding weights (e.g. wm2,
wm3, wm4). The weights refer to relative performance of the QSAR models and importance of
similarity information and sub-structure pattern in determining skin sensitization potential (seeTable 2). InEq 1, m2, m3and m4are predictions from QSAR models-2, 3 and 4 (see
sec-tions titled“Evaluation of QSAR model variants”and“Integrated prediction workflows”for details on selection of QSAR models), and ssimilarityand ssubstrare those from similarity
infor-mation and sub-structure pattern respectively. wm2, wm3, wm4, wsimilarityand wsubstrare their
1 (for test molecule predicted as sensitizer) or -1 (for test molecule predicted as non-sensitizer). Prediction scores of similarity information and sub-structure pattern are described in sections titled“Identification of structurally similar molecules in the dataset”and“Identification of sub-structures associated with skin sensitization reaction mechanisms”respectively. If the resultant sum was positive, molecule was predicted as a sensitizer; if negative, the molecule was predicted as non-sensitizer; and if zero, the prediction was indeterminate. Table G inS1 Filesummarizes the weights used and the corresponding prediction performance.
Identification of Structurally Similar Molecules in the Dataset
As a component of our prediction workflows, test molecules were screened for their structural similarity (i.e.‘similarity information’) to known sensitizers and non-sensitizers contained in parent set. Similarity was estimated by computing Tanimoto coefficient[42] using Pybel with path-based fingerprint (FP2)[57] approach. Based on earlier recommendations, Tanimoto coefficient cutoff was set to 0.6 (i.e. 60% similarity)[58,59]. Test molecules failing this cutoff
Fig 3. Integration of QSAR models, similarity information and sub-structure pattern into prediction workflows (PWs). Blue and red colors depict components that differ in the two Prediction Workflows, PW-1 and PW-2. Components in black and grey are those that are common in both PW-1 and PW-2. QSAR: Quantitative Structure-Activity Relationship; MLP: Multi-Layer Perceptron; SMO: Sequential Minimal Optimization; Eo: Energy-optimized dataset; RTS: Representative test set;
Challenge-1: Challenge set-1; Challenge-2: Challenge set-2; m2, m3, m4, ssimilarityand ssubstrare predictions from QSAR.
models-2, 3 and 4, similarity information and sub-structure pattern, and wm2, wm3, wm4, wsimilarityand wsubstrare their
corresponding weights.
were scored as 0, while the molecules passing this cutoff (i.e. with coefficient0.6) were scored as 1 or -1 depending on whether they show highest similarity to sensitizer(s) or non-sensitizer (s) respectively. Molecules showing equal similarity (i.e. equal Tanimoto coefficient value) to both, sensitizers and non-sensitizers, were also scored as 0.
Moreover, for molecules appearing identical to any dataset molecule (i.e. 100% similarity) based on Tanimoto coefficient, their InChIKey[60] values were compared by pattern matching to ascertain that the molecules were indeed identical.
Identification of Sub-Structures Associated with Skin Sensitization
Reaction Mechanisms
As our objective was to devise an integrated workflow to predict skin sensitization potential of molecules, we included‘sub-structure pattern’as a key component to identify chemical groups known to react with skin proteins[28] i.e. associated with skin sensitization reaction mechanisms. For this, SMILES of test molecules were compared against set of SMARTS (SMiles ARbitrary Target Specification) patterns collated from literature[28] using Pybel[57]. If a test molecule contained any such group i.e. matched with any SMARTS pattern then it was scored as 1, else -1. Absence of a sub-structure was scored as -1 and not 0 because it is an indicative that the molecule may not interact with skin proteins, and hence, would not be a sensitizer.
Computation of Performance Measures
Prediction performance of the models and prediction workflows were gauged by following measures: accuracy, sensitivity, specificity and CCR[48,61,62]. Sensitivity was computed as proportion of correctly predicted sensitizers (seeEq 2), and specificity as proportion of cor-rectly predicted non-sensitizers (seeEq 3). Accuracy was computed as ratio of correctly pre-dicted molecules (both sensitizers and non-sensitizers) as compared to all molecules included in the analysis (seeEq 4). CCR was computed as average of the rates correctly predicted within each class (seeEq 5). In Eqs2,3and4, True Positive (TP) was described as number of sensitiz-ers correctly predicted as sensitizsensitiz-ers, False Positive (FP) as number of non-sensitizsensitiz-ers wrongly predicted as sensitizers, True Negative (TN) as number of non-sensitizers correctly predicted as sensitizers and False Negative (FN) as number of sensitizers wrongly predicted as
non-Table 2. Weights used for components of prediction workflows in knowledge-based optimization.
QSAR Model-2
QSAR Model-3
QSAR Model-4
Similarity Information Sub-structure Pattern
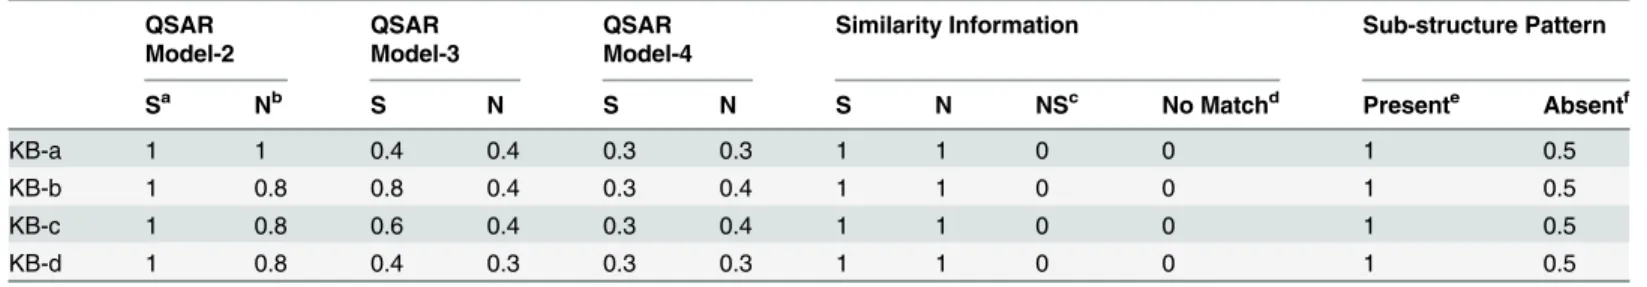
Sa Nb S N S N S N NSc No Matchd Presente Absentf
KB-a 1 1 0.4 0.4 0.3 0.3 1 1 0 0 1 0.5
KB-b 1 0.8 0.8 0.4 0.3 0.4 1 1 0 0 1 0.5
KB-c 1 0.8 0.6 0.4 0.3 0.4 1 1 0 0 1 0.5
KB-d 1 0.8 0.4 0.3 0.3 0.3 1 1 0 0 1 0.5
a
Weight used if test molecule is predicted to be a‘sensitizer’
bWeight used if test molecule is predicted to be a‘non-sensitizer’ c
Weight used if test molecule shows equal similarity to both, sensitizer and non-sensitizer
d
Weight used if test molecule is not similar to any molecule in our parent set
eWeight used if sub-structure is found in a test molecule f
Weight used if sub-structure is not found in a test molecule.
sensitizers.
If
Score>0; Prediction ¼ Sensitizer
Score < 0; Prediction ¼ Non sensitizer
Score ¼ 0; Prediction ¼ Indeterminate
where
Score ¼ m2wm2þ m3 wm3þm4wm4
þssimilaritywsimilarityþssubstrwsubstr
Equation1
Sensitivity ¼ TP
TPþFN Equation2
Specificity ¼ TN
TNþFP Equation3
Accuracy ¼ TPþTN
TPþFNþTNþFP Equation4
CCR ¼ SpecificityþSensitivity
2 Equation5
Results and Discussion
Quantitative Structure-Activity Relationship (QSAR) Models
As stated earlier, we built four QSAR models. For each model, a total of 75 variants (= 1 model x 5 descriptor sets x 3 methods of separating training and test sets x 5 classifier methods) were built using various combinations of descriptor and fingerprint sets, segregation of training and test sets, and classifier methods (seeMethodsfor details). This resulted in a total of 300 variants (= 4 models x 75 variants for each model); thus, allowing us to evaluate combinatorial list of QSAR models and choose the best performing ones.
Nomenclature for each variant (e.g. 1D4RF) was represented by an alphanumeric code as elaborated below:<model i.e. [1–4]><method used for segregating training and test sets i.e.
[D|S|C]><descriptor set used i.e. [1–5]><classifier method i.e. [J48|MLP|RF|SL|SMO]>. In
1D4RF,‘1’refers to QSAR model-1,‘D’is direct method for segregating training and test sets, descriptor set-‘4’for building and random forests‘RF’as the classifier method.
Evaluation of QSAR Model Variants
All the 300 variants were evaluated for prediction performance using their respective test sets and RTS. The respective test sets of each variant contains sensitizers of specific categories (for e.g. extreme (X) and strong (St) for variants of model-1) and non-sensitizers (see sections titled
For instance, among the variants of model-1, 1D1RF, 1D4RF and 1D3J48 showed highest pre-diction accuracy (= 100%) for their respective test sets. However, with respect to RTS, 1C1RF and 1C4RF showed highest accuracy (= 84%) while 1D1RF, 1D4RF and 1D3J48 showed accu-racies of 81%, 81% and 77% respectively (see Table H inS1 File).
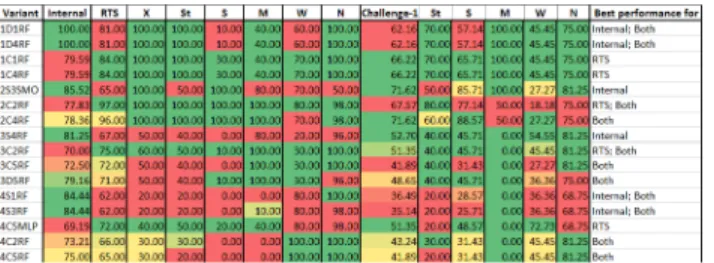
Overall, prediction accuracies of the variants ranged between 57.77%-100% with respect to their respective test sets (variants 4D4J48, and 1D1RF, 1D3J48 and 1D4RF respectively) and 44%-97% for RTS (variants 3C2SL, and 2C1RF and 2C2RF respectively) (see Table H inS1 File). For further evaluation, we short-listed the variants showing best accuracy with respect to: (1) internal test set; (2) RTS; and (3) a combination of internal test set and RTS.Fig 4shows the variants that satisfy above criteria.
To assess the robustness of variants, we evaluated their performance on‘new set of mole-cules’(i.e. molecules not used during model building). Challenge set-1 containing 74 molecules collated from literature (see 2.1.3 for details) was used for this evaluation. As shown inFig 4, 2S3SMO and 2C4RF showed the highest prediction accuracy (= 71.62%) followed by that of 2C2RF (= 67.57%). This implied that variants of model-2 performed best on an external test set, which was expected owing to the diversity of molecules used for building them.
On comparing the prediction accuracy for individual categories of sensitizers from RTS and challenge set-1, it was evident that a single model cannot predict all the types of sensitizers with equal accuracy. In particular, variants of models-1 and 2 could predict X, St and M better than W, while variants of models-3 and 4 were better at predicting M and W respectively. Thus, to enhance the spectrum of prediction and improve the overall performance, we integrated indi-vidual models into prediction workflows as elaborated below.
Integrated Prediction Workflows
As stated above, we built prediction workflows by combining best performing variants from each QSAR model such that the overall prediction performance improves. Criteria used for selecting these variants were as follows: (1) prediction performance on their respective test sets and RTS; (2) ability to predict sensitizer categories used to train the variants; and (3) ability to predict other sensitizer categories. For e.g. 3C2RF was preferred over 3C5RF owing to better prediction of other sensitizer categories (i.e. X and St), though, they predicted their respective sensitizer category (i.e. M) with equal accuracy. Moreover, no variant of model-1 was used in prediction workflow as variants of model-2 compensated for it by predicting X and St with equal or better accuracy (seeFig 4).
Based on above criteria, the variants 2C2RF and 2C4RF of model-2, 3C2RF of model-3 and 4C2RF of model-4 were selected. These were combined such that each combination had vari-ants from all the three QSAR models viz. (1) 2C2RF, 3C2RF and 4C2RF; and (2) 2C4RF,
Fig 4. Percent prediction accuracy of short-listed variants of models.Color-coded scale from green to red indicates decreasing prediction accuracy. RTS and Challenge-1 sets are expanded to show the prediction accuracy for each category of sensitizers and non-sensitizers. Internal: Internal test set; RTS: Representative test set; Challenge-1: Challenge set-1; Both: Internal & RTS; X: Extreme; St: Strong; S: Sensitizer with unknown potency; M: Moderate; W: Weak; N: Non-sensitizer.
3C2RF and 4C2RF. Y-randomization for these QSAR model variants were performed to assess robustness and eliminate chance correlation. For each variant, 10 randomization runs were performed as indicated by Garget al.[63]. In all cases, the QSAR model variants based on real data showed much higher accuracy than the random models, indicating no chance correlation in our model variants (see Table I inS1 File).
In addition to the predictions from QSAR models, we incorporated following two factors. (1)‘Similarity information’of known sensitizers and non-sensitizers from our parent set based on the principle of similar-property, considering that structurally similar molecules exhibit similar properties[64]. (2) Identification of‘sub-structure patterns’associated with skin sensiti-zation reaction mechanisms. This was done to identify the presence of chemical groups known to react with skin proteins[28,61].
Integration of predictions from components. We built two prediction workflows corre-sponding to following model variants: (1) 2C2RF, 3C2RF and 4C2RF; and (2) 2C4RF, 3C2RF and 4C2RF respectively. The predictions from each component of the workflow i.e. QSAR models, similarity information and sub-structure pattern were consolidated using machine learning methods (i.e. MLP and SMO) and knowledge-based optimization, with Eoas the
train-ing set. The details of score computation from each component and their integration is dis-cussed in section titled“Consensus prediction using QSAR models, similarity information and sub-structure pattern”. It should be noted that weight of any sub-structure pattern was kept as 1 (when it is found in a test molecule) and 0.5 (when it is absent in a test molecule) to account for the fact that presence of a sub-structure is a good indicator of sensitizer while its absence does not necessarily imply that a test molecule is a non-sensitizer (seeTable 2). As mentioned above, similarity information and sub-structure pattern were components of both of our pre-diction workflows.
Evaluation of Prediction Workflows
Since, various methods were used to integrate the predictions in our workflows, their perfor-mance on Eo, RTS dataset and challenge sets-1 and 2 were evaluated. The results are discussed
in following sections:
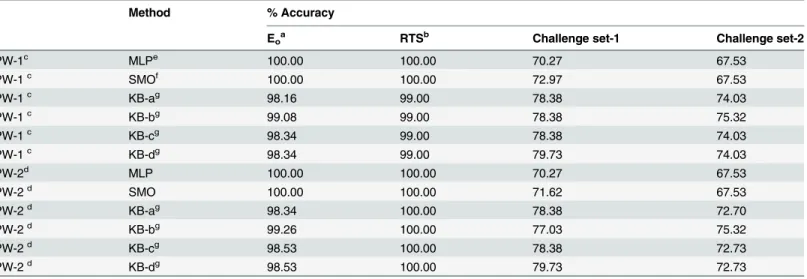
Comparative performance of prediction workflows. Table 3details the prediction per-formance of our prediction workflows (PW-1 and PW-2) with reference to the use of machine learning methods (MLP and SMO) and knowledge-based optimization. In this table, KB-a, KB-b, KB-c and KB-d refer to various combinations of weights assigned to scores from compo-nents (QSAR models, similarity information and sub-structure pattern) of our workflows (see
Eq 1andTable 2).
As is evident fromTable 3, MLP and SMO performed better than knowledge-based optimi-zation on Eoand RTS for both the prediction workflows; however, the latter outperformed
MLP and SMO on challenge sets-1 and 2. This may indicate over-fitting of the machine learn-ing methods (i.e. MLP and SMO) to the trainlearn-ing set, which is an inherent limitation of such methods. On the other hand, the better performance of knowledge-based optimization could be attributed to small set of parameters (i.e. 5) to be optimized anda prioriunderstanding of their contributions to the skin sensitization potential of molecules. Among the knowledge-based (KB) optimized weights, KB-b weights showed the best performance.
With KB-b weights, PW-2 performed best with respect to Eo(accuracy = 99.26%) and RTS
Clearly, integration of QSAR models, similarity information and sub-structure pattern in prediction workflows performed better than individual QSAR models because even the best performing model showed lower accuracy on Eoand RTS than our prediction workflows (see Fig 4and Table H inS1 File).
Assessment of prediction performance on challenge sets. Out of 74 molecules in chal-lenge set-1, 58 (78.38%) and 57 (77.03%) were accurately predicted by PW-1 and PW-2 respec-tively. Among these, PW-1 accurately predicted 47 sensitizers while PW-2 predicted 46 sensitizers. Moreover, 11 non-sensitizers were accurately predicted by both the workflows. It is important to note that integration of QSAR models, similarity information and sub-structure pattern facilitated their correct classification by overcoming the incorrect predictions of indi-vidual computations. For e.g. in case of PW-1, 18 out of 47 correctly predicted sensitizers did not show similarity to any molecule in parent set. However, PW-1 predicted them correctly as sensitizers owing to identification of reactive group(s) and/or predictions from QSAR models. Similar trend was also observed for PW-2 (see Tables J and K inS1 Filefor details). Table L in
S1 Filelists the reactive groups predicted to be present on molecules of challenge sets-1 and 2 by our workflows.
PW-1 and PW-2 incorrectly predicted 16 (21.62%) and 17 (23.97%) molecules, of which 11 and 12 are sensitizers and the remaining 5 non-sensitizers. Among the sensitizers wrongly pre-dicted as non-sensitizers by PWs, 4 contain reactive group(s), but 3 of them also showed simi-larity to non-sensitizers. Thus, consensus prediction by the workflow went wrong. Similarly, among the non-sensitizers wrongly predicted as sensitizers, reactive groups were absent in 4 molecules, but they showed similarity to sensitizers.
These results indicate that although the prediction workflows were able to overcome incor-rect predictions by individual models in majority of the cases, there is a scope for further
Table 3. Performance of prediction workflows with machine learning methods and knowledge-based optimization.
Method % Accuracy
Eoa RTSb Challenge set-1 Challenge set-2
PW-1c MLPe 100.00 100.00 70.27 67.53
PW-1c SMOf 100.00 100.00 72.97 67.53
PW-1c KB-ag 98.16 99.00 78.38 74.03
PW-1c KB-bg 99.08 99.00 78.38 75.32
PW-1c KB-cg 98.34 99.00 78.38 74.03
PW-1c KB-dg 98.34 99.00 79.73 74.03
PW-2d MLP 100.00 100.00 70.27 67.53
PW-2d SMO 100.00 100.00 71.62 67.53
PW-2d KB-ag 98.34 100.00 78.38 72.70
PW-2d KB-bg 99.26 100.00 77.03 75.32
PW-2d KB-cg 98.53 100.00 78.38 72.73
PW-2d KB-dg 98.53 100.00 79.73 72.73
aEnergy-optimized set bRepresentative test set cPrediction work
flow containing following variants of models: 2C2RF, 3C2RF and 4C2RF
dPrediction work
flow containing following variants of models: 2C4RF, 3C2RF and 4C2RF
eMulti-Layer Perceptron fSequential Minimal Optimization
gKnowledge-based optimization with different weights used for components of prediction work
flows as elaborated inTable 2
optimization of the relative contribution of individual predictions. Evaluation of challenge set-2 also led to similar conclusions (see Tables J and K inS1 Filefor details).
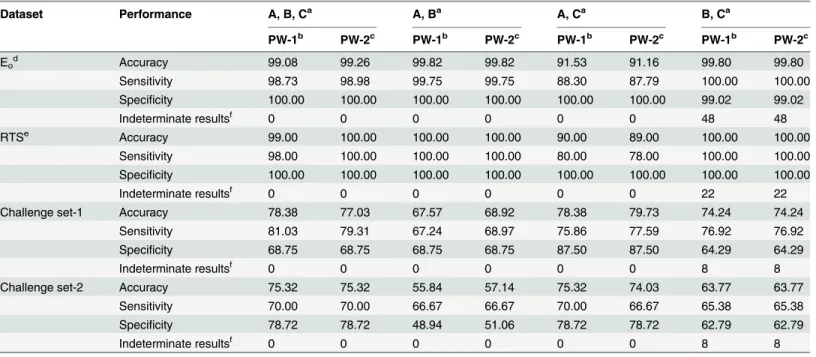
Contributions of QSAR models, similarity information and sub-structure patterns to prediction. From the results, it was evident that the predictions from QSAR models, similar-ity information and sub-structure pattern do not concur with each other in some cases. Thus, it was important to understand how these components contribute to overall prediction. For this, we performed‘leave-one-out’analysis for both the prediction workflows, wherein the QSAR models corresponding to PW-1 and PW-2 were considered in one category (A), similar-ity information in category B and sub-structure pattern in category C. Categories A, B and C were used in all possible combinations (i.e. A, B, C; A, B; A, C; and B, C) with Eo, RTS and
chal-lenge sets-1 and 2 for this analysis.
As shown inTable 4, the performance on Eoand RTS decreased the most when similarity
information was left out. On the other hand, performance on the challenge sets decreased the most when sub-structure pattern was removed. Similarity information appeared to be impor-tant for the internal sets (i.e. Eoand RTS) because the tested molecules were already present in
the dataset, and thus, similar molecules could be found. This led to better performance when similarity information was included in the prediction workflow. Sub-structure pattern appeared to be an important contributor in correctly classifying the molecules of challenge sets, indicating that the chemical groups with potential to bind to skin proteins are an impor-tant determinant of skin sensitization potential of a molecule. It was also clear that removing QSAR models (i.e. category A) led to slight increase in the prediction accuracy for Eo(= 0.54% Table 4. Leave-one out analysis to assess the contributions of QSAR models, similarity information and sub-structure pattern to the prediction performance of prediction workflows.
Dataset Performance A, B, Ca A, Ba A, Ca B, Ca
PW-1b PW-2c PW-1b PW-2c PW-1b PW-2c PW-1b PW-2c
Eod Accuracy 99.08 99.26 99.82 99.82 91.53 91.16 99.80 99.80
Sensitivity 98.73 98.98 99.75 99.75 88.30 87.79 100.00 100.00
Specificity 100.00 100.00 100.00 100.00 100.00 100.00 99.02 99.02
Indeterminate resultsf 0 0 0 0 0 0 48 48
RTSe Accuracy 99.00 100.00 100.00 100.00 90.00 89.00 100.00 100.00
Sensitivity 98.00 100.00 100.00 100.00 80.00 78.00 100.00 100.00
Specificity 100.00 100.00 100.00 100.00 100.00 100.00 100.00 100.00
Indeterminate resultsf 0 0 0 0 0 0 22 22
Challenge set-1 Accuracy 78.38 77.03 67.57 68.92 78.38 79.73 74.24 74.24
Sensitivity 81.03 79.31 67.24 68.97 75.86 77.59 76.92 76.92
Specificity 68.75 68.75 68.75 68.75 87.50 87.50 64.29 64.29
Indeterminate resultsf 0 0 0 0 0 0 8 8
Challenge set-2 Accuracy 75.32 75.32 55.84 57.14 75.32 74.03 63.77 63.77
Sensitivity 70.00 70.00 66.67 66.67 70.00 66.67 65.38 65.38
Specificity 78.72 78.72 48.94 51.06 78.72 78.72 62.79 62.79
Indeterminate resultsf 0 0 0 0 0 0 8 8
aA: QSAR models (i.e. 2C2RF, 3C2RF and 4C2RF for PW-1 and 2C4RF, 3C2RF and 4C2RF for PW-2); B: Similarity information; C: Sub-structure pattern bPrediction Work
flow-1
cPrediction Workflow-2 dEnergy-optimized set eRepresentative test set
fPrediction workflows could not classify the test molecule as sensitizer or non-sensitizer (i.e. score = 0).
for PW-2) and RTS (= 1% for PW-1), but, it also led to indeterminate results for several mole-cules in all the test sets. Thus, QSAR models are key players in the prediction workflow.
Furthermore, it was interesting to note that leaving out similarity information led to an increase (= 2.7% for PW-2) in the accuracy for challenge set-1, though there was a decrease (= 1.3% for PW-2) in accuracy for challenge set-2. Thus, leave-one out analysis highlighted the importance of each component of the prediction workflows and indicated the scope for further improvement either in the thresholds used to differentiate sensitizers from non-sensitizers, the weights, or both of them. For example, a molecule from our dataset was considered similar to a test molecule if Tanimoto coefficient0.6. Increasing this threshold would make the criterion more stringent, and may improve its contribution towards final prediction.
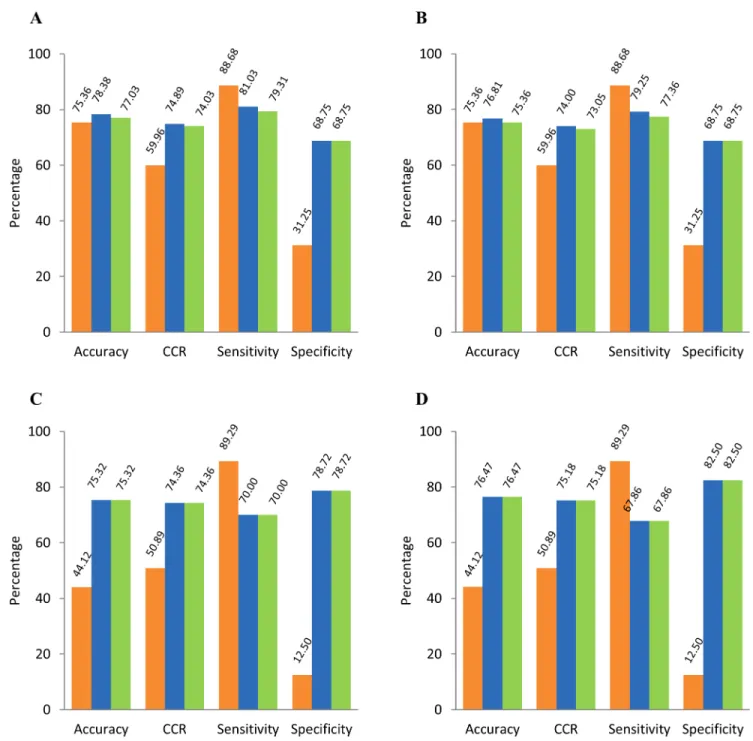
Comparative Performance of PW-1 & 2 with Existing Tools
We evaluated the molecules of challenge sets using freely available tool, VEGA v1.08 (http:// www.vega-qsar.eu/index.php). With respect to challenge set-1 containing 74 molecules, VEGA v1.08 could process 69 molecules, while PW-1 and 2 could process all the molecules. On com-paring their prediction accuracies, our workflows showed slightly better performance (i.e. 3.02% by PW-1 and 1.67% by PW-2) as compared to VEGA v1.08 (seeFig 5A). Considering only the 69 molecules processed by VEGA v1.08, the prediction accuracies by both, VEGA v1.08 and PW-2 were equal (= 75.36%) and PW-1 showed slightly higher accuracy (= 76.81%) (seeFig 5B). However, comparing sensitivity and specificity indicated that VEGA v1.08 has high sensitivity (= 88.68%), but poor specificity (= 31.25%) as compared to that of our predic-tion workflows (sensitivity = 79.25% and 77.36% for PW-1 and PW-2 respectively and specific-ity = 68.75% for both PW-1 and PW-2).
With respect to challenge set-2 containing 77 molecules, VEGA v1.08 could process 68 mol-ecules, while PW-1 and 2 processed all the molecules. Considering these 68 molmol-ecules, the pre-diction accuracies of our prepre-diction workflows were equal and 32.35% higher than that of VEGA v1.08 (seeFig 5C and 5D). The trends for sensitivity and specificity were similar to that observed with challenge set-1. Sensitivity of VEGA v1.08 was high (= 89.29%), but specificity was very low (= 12.50%) as compared to that of our prediction workflows (sensitivity = 67.86% and specificity = 82.50% for both PW-1 and 2).
We also performed predictions using VEGA v1.08 with‘High (AD Index>= 0.8)’and ‘High and Medium (AD Index>= 0.6)’for both, challenge sets-1 and 2. As shown in Tables
M and N inS1 File, VEGA v1.08 showed lower prediction performance than our prediction workflows even with the use of‘High’(accuracy = 72% and CCR = 62.87%) or‘High and Medium’(accuracy = 70.27% and CCR = 58.50%) reliability scores for challenge set-1. The observation was similar for challenge set-2 as well (see Tables O and P inS1 File).
Furthermore, we compared the prediction performance of our workflows with other exist-ing tools, namely, Case Ultra, TOPKAT, DEREK, TIMES-SS v2.27 and OECD (Q)SAR tool-box, by deriving their prediction performance from Teubneret al.[47] with respect to the molecules of challenge set-2 (see Table Q inS1 Filefor detailed derivation of prediction perfor-mance and results). For OECD (Q)SAR toolbox, we assumed presence of alert in a test mole-cule as sensitizer and its absence as non-sensitizer because there is no direct way of mapping the presence or absence of alerts to whether a molecule is sensitizer or non-sensitizer[47]. Our prediction workflows appeared to have best prediction performance (accuracy = 75.32% and CCR = 74.36% for both PW-1 and 2) among the compared tools followed by that of DEREK (accuracy = 71.05% and CCR = 69.13%) and TIMES-SS (accuracy = 69.33% and
CCR = 55.94%). Our prediction workflows also showed highest sensitivity (= 70.00%), and specificity (= 78.72%) followed closely by DEREK (= 78.26%). A recently published QSAR model for skin sensitization reported CCR of 71–88% in differentiating sensitizers from non-sensitizers on separate external sets[65]. It would be interesting to evaluate this model against the test set used by Teubneret al.[47] for evaluating the performance of existing tools.
Fig 5. Comparative performance of our prediction workflows with VEGA v1.08.Panel A: Molecules of challenge set-1 processed by our prediction workflows (= 74) and VEGA v1.08 (= 69) used for computation; Panel B: 69 molecules of challenge set-1 processed by our prediction workflows as well as VEGA v1.08 were used for computation; Panel C: Molecules of challenge set-2 processed by our prediction workflows (= 77) and VEGA v1.08 (= 68) used for computation; Panel D: 68 molecules of challenge set-2 processed by our prediction workflows as well as VEGA v1.08 were used for computation. VEGA v1.08: orange bars; PW-1: blue bars; PW-2: green bars. CCR: Correct Classification Rate.
On comparing prediction performance of existing tools within their applicability domains, DEREK (accuracy = 72.73% and CCR = 71.44%) and TOPKAT (accuracy = 60% and
CCR = 61.67%) still showed lower prediction performance than our prediction workflows (accuracy = 75.32% and CCR = 74.36%) (see Table Q inS1 Filefor details). Although, TIMES-SS showed better prediction performance (accuracy = 90% and CCR = 92.86%) than our workflows, only 10 out of the total 77 molecules (13%) of challenge set-2 could be pro-cessed by it, thus, indicating poor coverage. For Case Ultra, as shown by Teubneret al.[47], even with prediction performance in the applicability domain (i.e. known fragments), it could process only 20 sensitizers and 28 non-sensitizers out of the 100 molecule dataset[47], and cor-rectly identified 60% of sensitizers and 71% of non-sensitizers. For OECD (Q)SAR toolbox, as stated by Teubneret al.[47], applicability domain is not applicable.
In summary, our prediction workflows showed improved prediction performance as com-pared to other existing tools. As is evident, following factors contributed to the better perfor-mance of our prediction workflows by overcoming the limitations of existing tools: (1) use of larger dataset with molecules from different skin sensitization potency classes to build separate QSAR models, which helped increase coverage of our prediction workflows; (2) incorporation of literature-derived mechanistic knowledge (in the form of. similarity information and sub-structure patterns) helped increase the specificity; and (3) combining the QSAR models with mechanistic knowledge in a weighted fashion improved the overall prediction accuracy.
SkinSense: Implementation of Prediction Workflow as Software
Owing to improved accuracy of our prediction workflows, we believe that they may fit in the role of expert system as a part of Integrated Approaches to Testing and Assessment (IATA) for
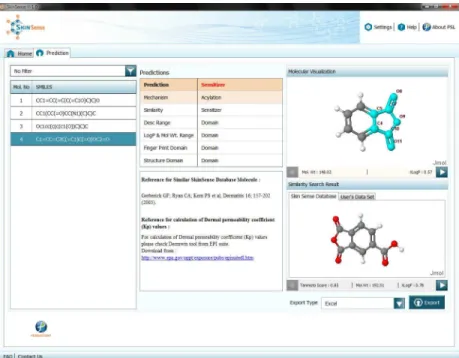
Fig 6. SkinSense–Result Screen.Table on the left shows SMILES of input molecules;‘Predictions’section shows prediction result for the selected molecule along with predicted reaction mechanism and domain information;‘Molecular Visualization’depicts the structure of selected molecule, along with skin protein reactive sub-structure(s) (if any) highlighted in cyan;‘Similarity Search Result’shows parent set molecules found similar to selected input molecule along with details such as Tanimoto coefficient;‘Export Type’offers various options to export SkinSense result.
skin sensitization[66]. Towards this, we have implemented our prediction workflow (PW-2 in particular) in a software application called SkinSense, using Java Swing technology.
SkinSense is intended to serve as a primary screening tool for dermatology and cosmetic research, which enables prediction of skin sensitization risk of molecules of interest. Our tool also provides mechanistic details such as skin protein reaction mechanisms and highlights reactive groups of molecules (seeFig 6). This would assist in decision making as well as refine-ment of the molecules early on in the discovery process, and thus, save time and cost.
SkinSense allows import of test molecules, and classifies them into sensitizers and non-sen-sitizers. It is important to note that SkinSense also predicts reaction mechanisms of test mole-cules and indicates the reactive group(s) responsible for reaction with skin proteins. This facilitates user to gain insight into the mechanistic details of test molecules, which in turn, allows the mapping to skin sensitization AOP.
The software is currently available free of charge at:http://eskin.persistent.co.in/
deskDownloader/skinsense/download-installer, and will soon be released as an open source tool for the scientific community to facilitate further enhancements. Such enhancements may include, for example, flexibility to incorporate new experimental data (such as peptide binding of molecules) in our existing prediction workflows.
Conclusions
Our integrated computational solution for predicting skin sensitization combined knowledge from known molecules and reaction mechanisms involved in sensitization, with computational methods and heuristics to develop and refine the workflows. This helped us achieve the improved prediction performance (i.e. accuracy = 75.32%, CCR = 74.36%, sensitivity = 70.00% and specificity = 78.72%) for skin sensitization potential of molecules as compared to existing tools. We believe this advancement would benefit the computational screening of molecules, and would be invaluable in the recent initiative of reducing animal usage in cosmetic and phar-maceutical research. Furthermore, the integrative framework outlined in this study may be rep-licated for predicting other important therapeutically important endpoints.
Supporting Information
S1 File. Supplementary file contains following tables:Table A.Descriptors & Fingerprints list.;Table B:Descriptors & Fingerprints values for model-1.;Table C: Descriptors & Finger-prints values for model-2.;Table D:Descriptors & Fingerprints values for model-3.;Table E: Descriptors & Fingerprints values for model-4.;Table F:Assigned values for machine learning weights.;Table G:Knowledge-based optimization.;Table H:Prediction accuracy of model var-iants.;Table I:Y-randomization for QSAR model variants incorporated in PW-1 or PW-2; Table J:Prediction of molecules of challenge sets by prediction workflow-1 (PW-1);Table K: Prediction of molecules of challenge sets by prediction workflow-2 (PW-2);Table L:Predicted reactive group(s) and skin-reaction mechanism(s) for molecules of challenge sets-1 and 2.; Table M:Prediction performance of VEGA v1.08 (with high reliability scores) with respect to challenge set-1.;Table N:Prediction performance of VEGA v1.08 (with high and medium reli-ability scores) with respect to challenge set-1.;Table O:Prediction performance of VEGA v1.08 (with high reliability scores) with respect to challenge set-2.;Table P:Prediction perfor-mance of VEGA v1.08 (with high and medium reliability scores) with respect to challenge set-2.;Table Q:Derivation and comparison of prediction performance of our prediction work-flows with existing tools.
Acknowledgments
The authors are thankful to vLife for kindly providing vLife-MDS for this study and Dr. Sach-chidanand from NIPER Hajipur for his critical inputs. The authors are also thankful to the anonymous reviewers for their suggestions, which has helped improve the quality and content of this manuscript.
Author Contributions
Conceived and designed the experiments: AJ VS AD ST KK. Performed the experiments: KK ST. Analyzed the data: AJ VS AD ST KK. Contributed reagents/materials/analysis tools: VS ST KK. Wrote the paper: AJ VS AD ST KK.
References
1. Ryan D, Yusuf O, Ostergaard M, Roman-Rodriguez M. WAO white book on allergy. Milwaukee WI World Allergy Organ. 2011; 5–6.
2. Kimber I, Basketter DA, Berthold K, Butler M, Garrigue J-L, Lea L, et al. Skin Sensitization Testing in Potency and Risk Assessment. Toxicol Sci. 2001; 59: 198–208. doi:10.1093/toxsci/59.2.198PMID: 11158712
3. Anderson SE, Siegel PD, Meade BJ. The LLNA: A Brief Review of Recent Advances and Limitations. J Allergy. 2011; 2011: 1–10. doi:10.1155/2011/424203
4. Ruet Rossignol M. The 7th Amendment to the Cosmetics Directive. Altern Lab Anim ATLA. 2005; 33 Suppl 1: 19–20. PMID:16194137
5. EU. REGULATION (EC) No 1907/2006 OF THE EUROPEAN PARLIAMENT AND OF THE COUNCIL of 18 December 2006 concerning the Registration, Evaluation, Authorisation and Restriction of Chemi-cals (REACH), establishing a European ChemiChemi-cals Agency, amending Directive 1999/45/EC and repealing Council Regulation (EEC) No 793/93 and Commission Regulation (EC) No 1488/94 as well as Council Directive 76/769/EEC and Commission Directives 91/155/EEC, 93/67/EEC, 93/105/EC and 2000/21/EC. Official Journal of European Union. 2006.
6. OECD. The Adverse Outcome Pathway for Skin Sensitisation Initiated by Covalent Binding to Proteins. Part 1: Scientific Edvidence. OECD Environment, Health and Safety Publications Series on Testing and Assessment. 2012; 168: 1–59.
7. MacKay C, Davies M, Summerfield V, Maxwell G. From pathways to people: applying the adverse out-come pathway (AOP) for skin sensitization to risk assessment. Altex. 2013; 30: 473–486. PMID: 24173169
8. Emter R, Ellis G, Natsch A. Performance of a novel keratinocyte-based reporter cell line to screen skin sensitizers in vitro. Toxicol Appl Pharmacol. 2010; 245: 281–290. doi:http://dx.doi.org/10.1016/j.taap. 2010.03.009PMID:20307559
9. Emter R, Veen JW van der, Adamson G, Ezendam J, Loveren H van, Natsch A. Gene expression changes induced by skin sensitizers in the KeratinoSensTMcell line: Discriminating Nrf2-dependent
and Nrf2-independent events. Toxicol In Vitro. 2013; 27: 2225–2232. doi:http://dx.doi.org/10.1016/j.tiv. 2013.09.009PMID:24055896
10. Sakaguchi H, Ashikaga T, Kosaka N, Sono S, Nishiyama N, Itagaki H. The in vitro skin sensitization test; human cell line activation test (h-CLAT) using THP-1 cells. Toxicol Lett. 2007; 172, Supplement: S93–.http://dx.doi.org/10.1016/j.toxlet.2007.05.257.
11. Piroird C, Ovigne J-M, Rousset F, Martinozzi-Teissier S, Gomes C, Cotovio J, et al. The Myeloid U937 Skin Sensitization Test (U-SENS) addresses the activation of dendritic cell event in the adverse out-come pathway for skin sensitization. Toxicol In Vitro. 2015; 29: 901–916. doi:10.1016/j.tiv.2015.03.009 PMID:25820135
12. van der Veen JW, Soeteman-Hernández LG, Ezendam J, Stierum R, Kuper FC, van Loveren H. Anchoring molecular mechanisms to the adverse outcome pathway for skin sensitization: Analysis of existing data. Crit Rev Toxicol. 2014; 44: 590–599. doi:10.3109/10408444.2014.925425PMID: 25000333
13. Greene N. Computer systems for the prediction of toxicity: an update. Adv Drug Deliv Rev. 2002; 54: 417–431. PMID:11922956
15. Vocanson M, Hennino A, Rozières A, Poyet G, Nicolas J-F. Effector and regulatory mechanisms in allergic contact dermatitis. Allergy. 2009; 64: 1699–1714. doi:10.1111/j.1398-9995.2009.02082.x PMID:19839974
16. Chipinda I, Hettick JM, Siegel PD. Haptenation: chemical reactivity and protein binding. J Allergy. 2011; 2011: 839682. doi:10.1155/2011/839682
17. Patlewicz G, Worth A. Review of data sources, QSARs and integrated testing strategies for skin sensiti-sation. JRC Sci Tech Rep EUR. 2008;23225.
18. Magee PS. Exploring the Potential for Allergic Contact Dermatitis via Computed Heats of Reaction of Haptens with Protein End-groups Heats of Reaction of Haptens with Protein End-groups by Computa-tion. Quant Struct-Act Relatsh. 2000; 19: 356–365.
19. Rodford R, Patlewicz G, Walker JD, Payne MP. QUANTITATIVE STRUCTURE–ACTIVITY RELA-TIONSHIPS FOR PREDICTING SKIN AND RESPIRATORY SENSITIZATION. Environ Toxicol Chem. 2003; 22: 1855. doi:10.1897/01-438PMID:12924584
20. Patlewicz G, Aptula AO, Roberts DW, Uriarte E. A Minireview of Available Skin Sensitization (Q)SARs/ Expert Systems. QSAR Comb Sci. 2008; 27: 60–76. doi:10.1002/qsar.200710067
21. Teubner W, Mehling A, Schuster PX, Guth K, Worth A, Burton J, et al. Computer models versus reality: How well doin silicomodels currently predict the sensitization potential of a substance. Regul Toxicol Pharmacol. 2013; 67: 468–485. doi:10.1016/j.yrtph.2013.09.007PMID:24090701
22. Patlewicz G, Aptula AO, Uriarte E, Roberts DW, Kern PS, Gerberick GF, et al. An evaluation of selected global (Q)SARs/expert systems for the prediction of skin sensitisation potential. SAR QSAR Environ Res. 2007; 18: 515–541. doi:10.1080/10629360701427872PMID:17654336
23. Tropsha A. Best practices for QSAR model development, validation, and exploitation. Mol Inform. 2010; 29: 476–488.
24. Hazardous Substances Data Bank [Internet]. Bethesda (MD): National Library of Medicine (US), Divi-sion of Specialized Information Services. 1986—[cited 2013 Jan 4]. Available from:http://toxnet.nlm. nih.gov/cgi-bin/sis/htmlgen?HSDB. Accessed 4 January 2013.
25. Gerberick GF, Ryan CA, Kern PS, Schlatter H, Dearman RJ, Kimber I, et al. Compilation of historical local lymph node data for evaluation of skin sensitization alternative methods. Dermat Contact Atopic Occup Drug. 2005; 16: 157–202.
26. Cronin MT, Basketter DA. Multivariate QSAR analysis of a skin sensitization database. SAR QSAR Environ Res. 1994; 2: 159–179. doi:10.1080/10629369408029901PMID:8790644
27. Kern PS, Gerberick GF, Ryan CA, Kimber I, Aptula A, Basketter DA. Local lymph node data for the eval-uation of skin sensitization alternatives: a second compilation. Dermat Contact Atopic Occup Drug. 2010; 21: 8–32.
28. Enoch SJ, Madden JC, Cronin MTD. Identification of mechanisms of toxic action for skin sensitisation using a SMARTS pattern based approach. SAR QSAR Environ Res. 2008; 19: 555–578. doi:10.1080/ 10629360802348985PMID:18853302
29. Johansson H, Lindstedt M, Albrekt A-S, Borrebaeck CAK. A genomic biomarker signature can predict skin sensitizers using a cell-based in vitro alternative to animal tests. BMC Genomics. 2011; 12: 399. doi:10.1186/1471-2164-12-399PMID:21824406
30. O’Boyle NM, Banck M, James CA, Morley C, Vandermeersch T, Hutchison GR. Open Babel: An open chemical toolbox. J Cheminformatics. 2011; 3: 33. doi:10.1186/1758-2946-3-33
31. VLifeMDS: Molecular Design Suite, VLife Sciences Technologies Pvt. Ltd., Pune, India, 2010. Avail-able:www.vlifesciences.com.
32. Halgren TA. Merck molecular force field. I. Basis, form, scope, parameterization, and performance of MMFF94. J Comput Chem. 1996; 17: 490–519. doi:10.1002/(SICI)1096-987X(199604)17:5/6<490:: AID-JCC1>3.0.CO;2-P
33. Halgren TA. Merck molecular force field. II. MMFF94 van der Waals and electrostatic parameters for intermolecular interactions. J Comput Chem. 1996; 17: 520–552. doi:10.1002/(SICI)1096-987X (199604)17:5/6<520::AID-JCC2>3.0.CO;2-W
34. Hall M, Frank E, Holmes G, Pfahringer B, Reutemann P, Witten I. The WEKA Data Mining Software: An Update. SIGKDD Explorations. 2009; 11.
35. Dudek AZ, Arodz T, Galvez J. Computational methods in developing quantitative structure-activity rela-tionships (QSAR): a review. Comb Chem High Throughput Screen. 2006; 9: 213–228. PMID:
16533155
37. Blum LC, van Deursen R, Reymond J-L. Visualisation and subsets of the chemical universe database GDB-13 for virtual screening. J Comput Aided Mol Des. 2011; 25: 637–647. doi: 10.1007/s10822-011-9436-yPMID:21618009
38. Karlberg A-T, Bergström MA, Börje A, Luthman K, Nilsson JLG. Allergic contact dermatitis—formation, structural requirements, and reactivity of skin sensitizers. Chem Res Toxicol. 2008; 21: 53–69. doi:10. 1021/tx7002239PMID:18052130
39. Divkovic M, Pease CK, Gerberick GF, Basketter DA. Hapten-protein binding: from theory to practical application in the in vitro prediction of skin sensitization. Contact Dermatitis. 2005; 53: 189–200. doi: 10.1111/j.0105-1873.2005.00683.xPMID:16191014
40. Roberts DW, Aptula AO, Patlewicz G. Electrophilic chemistry related to skin sensitization. Reaction mechanistic applicability domain classification for a published data set of 106 chemicals tested in the mouse local lymph node assay. Chem Res Toxicol. 2007; 20: 44–60. doi:10.1021/tx060121yPMID: 17226926
41. Singla D, Anurag M, Dash D, Raghava GP. A web server for predicting inhibitors against bacterial target GlmU protein. BMC Pharmacol. 2011; 11: 5. doi:10.1186/1471-2210-11-5PMID:21733180
42. Tou JT, Gonzalez, Rafael C. Pattern recognition principles. Reading, Mass.: Addison-Wesley Pub. Co.; 1977.
43. Enslein K, Gombar VK, Blake BW, Maibach HI, Hostynek JJ, Sigman CC, et al. A quantitative struc-ture-toxicity relationships model for the dermal sensitization guinea pig maximization assay. Food Chem Toxicol Int J Publ Br Ind Biol Res Assoc. 1997; 35: 1091–1098.
44. Schlede E, Aberer W, Fuchs T, Gerner I, Lessmann H, Maurer T, et al. Chemical substances and con-tact allergy—244 substances ranked according to allergenic potency. Toxicology. 2003; 193: 219–259. PMID:14599761
45. Natsch A, Emter R, Ellis G. Filling the concept with data: integrating data from different in vitro and in sil-ico assays on skin sensitizers to explore the battery approach for animal-free skin sensitization testing. Toxicol Sci Off J Soc Toxicol. 2009; 107: 106–121. doi:10.1093/toxsci/kfn204
46. Natsch A, Ryan CA, Foertsch L, Emter R, Jaworska J, Gerberick F, et al. A dataset on 145 chemicals tested in alternative assays for skin sensitization undergoing prevalidation. J Appl Toxicol JAT. 2013; doi:10.1002/jat.2868
47. Teubner W, Mehling A, Schuster PX, Guth K, Worth A, Burton J, et al. Computer models versus reality: how well do in silico models currently predict the sensitization potential of a substance. Regul Toxicol Pharmacol RTP. 2013; 67: 468–485. doi:10.1016/j.yrtph.2013.09.007PMID:24090701
48. Chaudhry Q, Piclin N, Cotterill J, Pintore M, Price NR, Chrétien JR, et al. Global QSAR models of skin sensitisers for regulatory purposes. Chem Cent J. 2010; 4 Suppl 1: S5. doi: 10.1186/1752-153X-4-S1-S5PMID:20678184
49. Ren Y, Liu H, Xue C, Yao X, Liu M, Fan B. Classification study of skin sensitizers based on support vec-tor machine and linear discriminant analysis. Anal Chim Acta. 2006; 572: 272–282. doi:10.1016/j.aca. 2006.05.027PMID:17723489
50. Nantasenamat C, Worachartcheewan A, Mandi P, Monnor T, Isarankura-Na-Ayudhya C, Prachayasitti-kul V. QSAR modeling of aromatase inhibition by flavonoids using machine learning approaches. Chem Pap. 2014; 68: 697–713. doi:10.2478/s11696-013-0498-2
51. Li S, Fedorowicz A, Singh H, Soderholm SC. Application of the random forest method in studies of local lymph node assay based skin sensitization data. J Chem Inf Model. 2005; 45: 952–964. doi:10.1021/ ci050049uPMID:16045289
52. Gómez Ravetti M, Moscato P. Identification of a 5-protein biomarker molecular signature for predicting Alzheimer’s disease. PloS One. 2008; 3: e3111. doi:10.1371/journal.pone.0003111PMID:18769539 53. Bruce CL, Melville JL, Pickett SD, Hirst JD. Contemporary QSAR classifiers compared. J Chem Inf
Model. 2007; 47: 219–227. doi:10.1021/ci600332jPMID:17238267
54. Bauch C, Kolle SN, Ramirez T, Eltze T, Fabian E, Mehling A, et al. Putting the parts together: Combin-ingin vitromethods to test for skin sensitizing potentials. Regul Toxicol Pharmacol. 2012; 63: 489–504. doi:10.1016/j.yrtph.2012.05.013PMID:22659254
55. Nukada Y, Miyazawa M, Kazutoshi S, Sakaguchi H, Nishiyama N. Data integration of non-animal tests for the development of a test battery to predict the skin sensitizing potential and potency of chemicals. Toxicol In Vitro. 2013; 27: 609–618. doi:10.1016/j.tiv.2012.11.006PMID:23149339
56. Yao XJ, Panaye A, Doucet JP, Zhang RS, Chen HF, Liu MC, et al. Comparative study of QSAR/QSPR correlations using support vector machines, radial basis function neural networks, and multiple linear regression. J Chem Inf Comput Sci. 2004; 44: 1257–1266. doi:10.1021/ci049965iPMID:15272833 57. O’Boyle NM, Morley C, Hutchison GR. Pybel: a Python wrapper for the OpenBabel cheminformatics
58. Hewitt M, Ellison CM, Enoch SJ, Madden JC, Cronin MTD. Integrating (Q)SAR models, expert systems and read-across approaches for the prediction of developmental toxicity. Reprod Toxicol Elmsford N. 2010; 30: 147–160. doi:10.1016/j.reprotox.2009.12.003
59. Enoch SJ, Cronin MT, Madden JC, Hewitt M. Formation of Structural Categories to Allow for Read-Across for Teratogenicity. QSAR Comb Sci. 2009; 28: 696–708.
60. Heller S, McNaught A, Stein S, Tchekhovskoi D, Pletnev I. InChI—the worldwide chemical structure identifier standard. J Cheminformatics. 2013; 5: 7. doi:10.1186/1758-2946-5-7
61. Aptula AO, Roberts DW. Mechanistic applicability domains for nonanimal-based prediction of toxicolog-ical end points: general principles and application to reactive toxicity. Chem Res Toxicol. 2006; 19: 1097–1105. doi:10.1021/tx0601004PMID:16918251
62. Low Y, Uehara T, Minowa Y, Yamada H, Ohno Y, Urushidani T, et al. Predicting drug-induced hepato-toxicity using QSAR and toxicogenomics approaches. Chem Res Toxicol. 2011; 24: 1251–1262. doi: 10.1021/tx200148aPMID:21699217
63. Garg P, Dhakne R, Belekar V. Role of breast cancer resistance protein (BCRP) as active efflux trans-porter on blood-brain barrier (BBB) permeability. Mol Divers. 2015; 19: 163–172. doi: 10.1007/s11030-014-9562-2PMID:25502234
64. Johnson MA, Maggiora GM. Concepts and applications of molecular similarity. New York: Wiley; 1990.
65. Alves VM, Muratov E, Fourches D, Strickland J, Kleinstreuer N, Andrade CH, et al. Predicting chemi-cally-induced skin reactions. Part I: QSAR models of skin sensitization and their application to identify potentially hazardous compounds. Toxicol Appl Pharmacol. 2015; 284: 262–272. doi:10.1016/j.taap. 2014.12.014PMID:25560674