Modelling of
Escherichia coli
Cultivations:
Acetate Inhibition in a Fed-batch Culture
Olympia Roeva*, Stoyan Tzonkov
Centre of Biomedical Engineering ”Prof. Ivan Daskalov” - Bulgarian Academy of Sciences 105 Acad. G. Bonchev Str., Sofia 1113, Bulgaria
E-mail: olympia@clbme.bas.bg
*
Corresponding author
Received: October 12, 2005 Accepted: March 15, 2006
Published: April 26, 2006
Abstract: A set of three competing, unstructured models has been proposed to model
biomass growth, glucose utilization, acetate formation, dissolved oxygen consumption and carbon dioxide accumulation of a fed-batch cultivation process of Escherichia coli. The inhibiting effect of acetate ongrowth of E. coli cultures is included in the considered models. The model identification is carried out using experimental data from the cultivation process. Genetic algorithms are used for parameter estimation. The model discrimination is based on the four criteria, namely sum of square errors, Fisher criterion, Akaike information criterion and minimum description length criterion. The most suitable model is identified that reflects the state variables curves adequately by considering acetate inhibited growth according to the Jerusalimsky approach.
Keywords: Modelling, Escherichia coli, Acetate inhibition, Parameter estimation.
Introduction
A significant problem in Escherichia coli cultivation processes that use glucose (as primary carbon energy substrate) is the formation of acetate as either an intermediate product or a major byproduct. Acetic acid formation by aerobically growing E. coli is already documented. Acetate can be both produced and utilized during the growth of E. coli on glucose. Together with its counterpart phenomenon in yeast, i.e., the aerobic ethanol production [9, 15], this process is now known as glucose overflow metabolism. High specific growth, high specific glucose uptake rate, limited respiratory capacity, or a combination of any of the above has been suggested to trigger the acetate overflow metabolism. Much more important phenomenon as far as acetate formation is inhibition of growth of E. coli cultures by acetate. In addition the productivities of recombinant proteins are reduced even at low acetate concentrations that may not, in themselves, inhibit growth [12]. Acetate produced in a culture has been shown to inhibit several physiological properties of the culture itself [15].
Clearly, when acetate byproduct formation occurs, in glucose growth E. coli cultures, an important question arises: What is the nature of inhibition of E. coli by acetate, essentially what is the form of the kinetics that is more applicable?
As a result of the forgoing discussion, the acetate production and inhibition of E. coli by acetate has been examined. This paper deals with dynamic modelling of fed-batch culture of
E. coli MC4110. Three models for microbial growth, glucose utilization, acetate formation, dissolved oxygen consumption and carbon dioxide accumulation are formulated as a “competing” set of model candidates. The inhibiting effect of acetate on E. coli growth is included in the considered models.
Modelling studies are performed to identify simple, easy-to-use, and robust models that are suitable to support the engineering tasks of process optimization and control. Мinimal value of residual sum of squares, Fisher criterion, Akaike information criterion and minimum description length criterion are used as trial functions for discrimination of the various models.
Materials and methods
Description of the cultivation process
The cultivation condition of the fed-batch cultivation of Escherichia coli MC4110 and the experimental data have been published previously [8, 14] as a result of teamwork according to
DFG Project №113/135 with the Institute of Technical Chemistry, University of Hannover. A briefly description of the experiment is presented here.
The cultivation of E. coli MC4110 is performed in a 2 l bioreactor (Bioengineering, Switzerland), using a mineral medium [1], in Institute of Technical Chemistry, University of Hannover. Before inoculation a glucose concentration of 2,5 g l-1 is established in the medium. Glucose in feeding solution is 100 g l-1. Initial liquid volume is 1350 ml, pH is controlled at 6,8 and temperature is kept constant at 35°C. The aeration rate is kept at 275 l h-1 air, stirrer speed at start 900 rpm, after 11h the stirrer speed is increased in steps of 100 rpm and at end is 1500 rpm.
Mathematical modelling
The models used are based on the following a priori assumptions:
• The main products are biomass, CO2, water, and, under some conditions, acetate. With the exception of acetate, no further by-products of growth, which might influence the biomass development, are produced in significant amounts.
• The characteristic bottleneck effect for oxidative glucose utilization must be taken into account. When the glucose utilization exceeds a critical value, part of the glucose flow is converted into acetate instead of being oxidized to CO2.
• The specific rates of glucose utilization, acetate production, dissolved oxygen consumption and carbon dioxide accumulation are assumed to be directly proportional to the specific growth rate.
• Growth inhibition by acetate is considered.
• Balanced growth condition is assumed. Variations in growth rate, substrate utilization, acetate production, dissolved oxygen consumption and carbon dioxide accumulation do not significantly change the elemental composition of biomass.
dX F
= µ X X
dt −V (1)
(
)
1
in S / X
dS F
= µ X + S S
dt −Y V − (2)
1
A / X
dA F
µ X A
dt =Y −V (3)
*
/
1
( )
DO L DO X
dDO F
µ X k a DO DO DO
dt = −Y + − −V (4)
2 2 2
* 2
2 2
/
1
( )
CO L
CO X
dCO F
µ X k a CO CO CO
dt =Y + − −V (5)
dV F
dt = (6)
where: X is biomass concentration, [g l-1]; S – glucose concentration, [g l-1]; A – acetate concentration, [g l-1]; DO – dissolved oxygen tension, [%]; CO 2 – carbon dioxide
concentration, [%]; DO * –saturation concentration of dissolved oxygen tension, [%]; CO 2* – saturation concentration of carbon dioxide, [%]; F –feed rate, [l h-1]; V – bioreactor volume, [l]; Sin–glucose concentration of feed, [g l-1]; µ – specific rate of biomass growth, [g g-1 h-1];
/
S X
Y –yield coefficient for biomass, [g g-1]; YA X/ –yield coefficient for acetate, [g g
-1
]; YDO X/
–yield coefficient for dissolved oxygen tension, [g g-1]; 2/
CO X
Y –yield coefficient for carbon
dioxide, [g g-1]; kLDOa – volumetric oxygen transfer coefficient, [h-1]; CO2
L
k a – volumetric carbon dioxide transfer coefficient, [h-1].
Due to potential acetate inhibition of growth at high acetate levels three models, based on different specific rates kinetics, are presented. In Model 1 a simple acetate inhibition term
(
1−A / ki)
, as indicated by the data of Cockshott et al. [4], is used. In Model 2, according to the Jerusalimsky approach [6], the acetate inhibition term(
k / ki i+A)
is included. Finally, inModel 3, the well-known Andrews kinetics is considered [16]. The proposed kinetics equations, used for description of specific rates of biomass growth, glucose utilization, acetate formation, dissolved oxygen consumption and carbon dioxide accumulation in the developed models, are summarized in Table 1, where µmax is maximum specific growth rate, [h-1]; k S – saturation constant, [g l-1] and ki – acetate inhibition constant for growth, [g l-1].
Results and discussion
Estimation of models parameters
As shown in the preceding section, all models consisted of a set of six differential equations (Eqs. (1) – (4)) thus represented six depended state variables – X, S, A, DO, CO2 and V, and
nine parameters – p = [µmax kS ki YS X/ YA X/ YDO X/ YCO2/X DO L
k a CO2
L
k a]. For the estimation
measurements of the glucose concentration and of the gases (dissolved oxygen and carbon dioxide) are used.
Table 1
Model µ
1 max 1
S i
S A
µ
k S k
⎛ ⎞
−
⎜ ⎟
+ ⎝ ⎠
2 max i
S i
k S µ
k +S k +A
3 max 2
A i
A µ
k + +A A /k
The global optimization problem is stated as the minimization of the distance measure J
(objective function) between experimental and model predicted values of the state variables, represented by the vector y:
( )
( )
(
)
21 1
N M
exp mod j
i j
J y i y i min
= =
⎡ ⎤
= ⎢ − ⎥ →
⎣ ⎦
∑∑
(7)where N is the number of data for each variable, M – the number of variables, yexp – known experimental data vector, ymod – the vector of states that corresponds to the predicted theoretical evolution using the model.
Parameter identification is performed with the genetic algorithms using Genetic Algorithm Toolbox [3] under Matlab 5.3 environment. The choice and adjustment of genetic algorithm operators and parameters is done with the criterion to be found the best solution with the best speed. For the considered parameter estimation the genetic algorithm operators and parameters are based on results in [13, 14].
The values of genetic algorithm parameters are respectively: GGAP – 0,97; XOVR – 0,7; MUTR – 0,05; PRECI – 20; NIND – 100 and MAXGEN – 100. Binary encoding type and linear ranking are used in the algorithm. Selection method is roulette wheel selection. A double point crossover is applied here. A bit inversion mutation is used in accepted encoding.
The results from the parameter identification are presented in Table 2. The estimated values for the yield of glucose per biomass for different models are the same – YS X/ = 0,5 g l-1. For yield of acetate per biomass analogous result (YA X/ = 0,015 g l-1) is achieved. The inhibition followed the presented kinetics with an inhibition constant ki = 50 ÷ 53 g l-1. Similar results are reported in [5, 10]. The slightly increased value of ki is explained with the fact that the host/vector used for this strain of E. coli is especially tolerant to acetate inhibition. The estimated values of the rest of parameters (µmax, kS, YDO X/ ,
2/
CO X
Y , DO L
k a and CO2
L
k a), in the
Table 2 Parameter Model 1 Model 2 Model 3
max
µ , [h-1] 0,547 0,519 0,540
S
k , [g l-1] 0,039 0,027 0,029
i
k , [g l-1] 51,340 53,602 50,805
/
S X
Y , [g g-1] 0,501 0,498 0,497
/
A X
Y , [g g-1] 0,015 0,015 0,015
/
DO X
Y , [g g-1] 0,551 0,683 0,437
DO L
k a, [h-1] 87,800 102,718 80,063
2/
CO X
Y , [g g-1] 0,524 0,512 0,476
2
CO L
k a, [h-1] 81,311 79,818 76,027
Model selection
Model structure evaluation consists of finding adequate model structures and of comparing their quality. The most important criterion for the comparison of models is that the deviations between measurements and model calculations (J) should be as small as possible. This criterion cannot be used alone, because it favours the use of complex models with many parameters which are difficult to identify uniquely. For this reason, this criterion has to be complemented by a criterion of ‘parsimony’ leading to a preference for simple model structures.
Some of most important techniques for deciding between competing model structures are: • quantitative measures of model adequacy
and
• graphical comparison for systematic deviations between calculations and measurements.
In most cases, graphical comparisons clearly show the existence or absence of systematic deviations between model predictions and measurements. It is evident that a quantitative measure of the differences between calculated and measured values is an important criterion for the adequacy of a model. However, in order to avoid the above problem of favouring more complex models, which in turn will lead to problems in uniquely identifying the model parameters, an extra criterion to promote simplicity is necessary.
In this paper the model discrimination is based on the two approaches as follows:
• quality of fit – the model structure should be able to represent the measured data in a proper manner;
• parsimony – the model structure should be as simple as possible compatible with the first requirement.
The first quantitative measure to include both these aspects is the Akaike information criterion
( )
dim ln 1 2 pAIC J
N
⎡⎛ ⎞ ⎤
= ⎢⎜ + ⎟ ⎥
⎢⎝ ⎠ ⎥
⎣ ⎦ (8)
An alternative information criterion (minimum description length – MDL) is proposed by Rissanen [7] as:
( )
ln1 dim N
MDL p J
N
⎛ ⎞
= +⎜ ⎟
⎝ ⎠ (9)
Another wide-spread criterion for model comparison is the Fisher criterion (FC):
(
)
(
)
2
1
2
1
i i
i i
N
exp exp
i N
mod mod
j
y y
FC
y y
=
=
− =
−
∑
∑
(10)The proposed criteria (Eqs. (8) – (10)) formulate the trade-off to be made between quality of fit and model complexity. The model with the smallest value of the listed trial functions (Eqs. (7) – (10)) will be chosen as the best model.
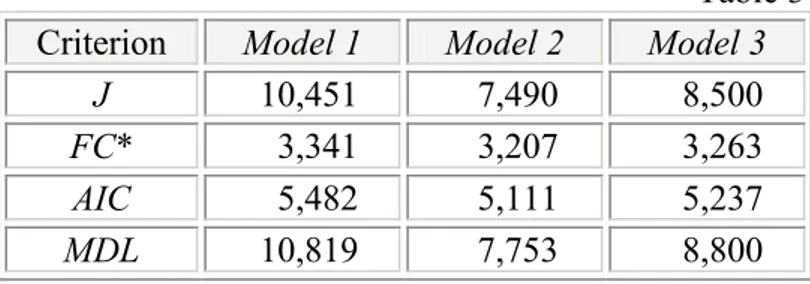
Table 3 provides an overview of the considered criteria values (J, FC, AIC and MDL) obtained after the parameter identification. In comparison with the table value of FC it is evident that the three models are adequate. As indicated, Models 2 and 3 have the similar and at the same time the lowest sum of square errors. The values of Fisher criterion and Akaike information criterion for Models 2 and 3 are comparable too. Only the criterion MDL
obviously gives an advantage of Model 2 over Model 3. Model 1, in which acetate formation is described according to the kinetic presented in [4], achieves the lowest accuracy level (J = 10.065).
Table 3 Criterion Model 1 Model 2 Model 3
J 10,451 7,490 8,500
FC* 3,341 3,207 3,263
AIC 5,482 5,111 5,237
MDL 10,819 7,753 8,800
* The table value of Fisher criterion for the considered problem here is FCtab = 6,39.
Simulation results
For each of the simulations the model is given the following information:
• initial volume – V(0) = 1,35 l.
• initial concentration of:
• glucose in feeding solution – Sin = 100 g l-1.
• glucose feeding profile, presented on Fig. 1.
The medium order method ode45 is used as a solver algorithm. Variable step (auto initial step size and maximum step size of 0,001) and relative tolerance of 0,001 are chosen in the algorithm.
6 7 8 9 10 11 12
0 0.02 0.04 0.06 0.08 0.1 0.12 0.14 0.16 0.18 0.2
Fed-batch Cultivation of E. coli MC4110
Time, [h]
F
eed r
at
e,
[
l/
h]
Fig. 1 Time profile of the feeding rate of E. coliMC4110 fed-batch cultivation process
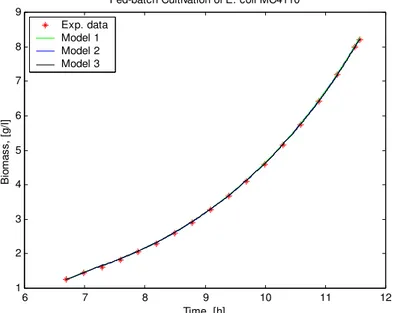
The calculated values of the state variables compared to the experimental data points of the E. coli fed-batch cultivation process, are shown on Figs. 2 – 6.
Fig. 2 presents a comparison between models predictions and experimental data for the biomass concentration. All models are able to mirror the dynamic behavior of biomass. As it can be seen from the graphical mode, the simulated curves of the three models are identical. The comparison of the objective functions JX shows that there are some differences in the models. The values of the objective functions JX are listed in Table 4. The results show that the lowest value of the objective function concerning biomass is achieved of Model 2.
Table 4 Criterion Model 1 Model 2 Model 3
JX 3,215 1,489 2,151
JS 6,613 5,479 5,608
JA 3,36.10-4 3,81.10-4 3,55.10-4
JDO 0,355 0,299 0,410
2
CO
6 7 8 9 10 11 12 1
2 3 4 5 6 7 8 9
Fed-batch Cultivation of E. coli MC4110
Time, [h]
B
io
m
a
ss, [g
/l
]
Exp. data Model 1 Model 2 Model 3
Fig. 2 Time profiles of the biomass concentration: experimental data and models data
6 7 8 9 10 11 12
0 0.1 0.2 0.3 0.4 0.5 0.6 0.7 0.8 0.9
Fed-batch Cultivation of E. coli MC4110
Time, [h]
S
u
b
s
tr
a
te
, [g
/l
]
Exp. data Model 1 Model 2 Model 3
Fig. 3 Time profiles of the glucose concentration: experimental data and models data
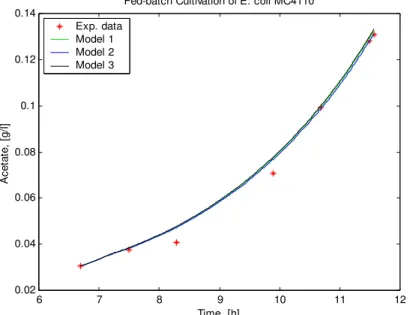
Fig. 3 presents a comparison between the three models predictions and experimental data for the glucose concentration. The correlation between the experimental and the predicted model concentrations of the glucose is the best for Model 2. This fact is confirmed by the results of the objective function values JS. The results (Table 4) show that the lowest value of the objective function JS is obtained from Model 2.
6 7 8 9 10 11 12 0.02
0.04 0.06 0.08 0.1 0.12 0.14
Fed-batch Cultivation of E. coli MC4110
Time, [h]
A
c
e
ta
te
, [g
/l
]
Exp. data Model 1 Model 2 Model 3
Fig. 4 Time profiles of the acetate concentration: experimental data and models data
6 7 8 9 10 11 12
19.8 20 20.2 20.4 20.6 20.8 21 21.2
Fed-batch Cultivation of E. coli MC4110
Time, [h]
D
is
s
ol
v
ed o
x
y
gen t
ens
ion,
[
%
]
Exp. data Model 1 Model 2 Model 3
Fig. 5 Time profiles of the dissolved oxygen tension: experimental data and models data
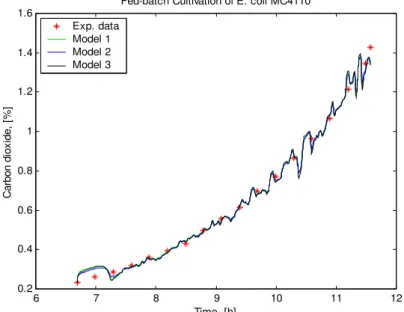
The last two figures (Fig. 5 and Fig. 6) present a comparison between the models predictions and the experimental data for the concentration of carbon dioxide and dissolved oxygen tension. The graphical modes show that the gases simulated curves of the three models are identical. Regarding the objective function, JDO and JCO2, the lowest values again are
6 7 8 9 10 11 12 0.2
0.4 0.6 0.8 1 1.2 1.4 1.6
Fed-batch Cultivation of E. coli MC4110
Time, [h]
C
arbon
di
ox
ide,
[
%
]
Exp. data Model 1 Model 2 Model 3
Fig. 6 Time profiles of the carbon dioxide concentration: experimental data and models data
Conclusion
In this paper the acetate production and the inhibition of E. coli growth by acetate have been examined. Three simple, unstructured models have been proposed for description of the dynamics in a fed-batch cultivation process of E. coli MC4110, especially the acetate inhibition effect. The regarded models are identified by genetic algorithms. The models discrimination is based on four criteria, namely sum of square errors, Fisher criterion, Akaike information criterion and minimum description length criterion
.
Using the considered specific rates, three acceptable models predictions for cell growth, glucose utilization, acetate formation, dissolved oxygen consumption and carbon dioxide accumulation are achieved. The presented results show that the Model 2 and 3 predict the experimental data better than Model 1. On the basis of the proposed criteria Model 2 should thus be favored because it achieved the lowest values of trial functions. Furthermore, as indicated by MDL criterion Model 2 is simpler than Model 3.Acknowledgements
This work is partially supported from National Science Fund Project № MI – 1505/2005.
References
1. Arndt M., B. Hitzmann (2001). Feed forward/feedback Control of Glucose Concentration during Cultivation of Escherichia coli, Proceedings of the 8th IFAC Int. Conf. on Comp. Appl. in Biotechn., Quebec City, Canada, 425-429.
2. Castan A., S.-O. Enfors (2000). Characteristics of a DO-controlled Fed-batch Culture of
Escherichia coli, Bioprocess Engineering, 22, 509-515.
3. Chipperfield A. J., P. J. Fleming, H. Pohlheim, C. M. Fonseca (1994). Genetic Algorithm Toolbox for Use with MATLAB. User’s Guide. Version 1.2. Dept. of Automatic Control and System Engineering, University of Sheffield, U. K.
4. Cockshott A. R., I. D. L. Bogle (1999). Modelling the Effects of Glucose Feeding on a Recombinant E. coli Fermentation, Bioprocess Engineering, 20, 83-90.
Escherichia coli Using On-line GFP-fusion Monitoring, Bioprocess and Biosystems Engineering, 24, 83-91.
6. Galvanauskas V., R. Simutis, N. Volk, A. Lubbert (1998). Model Based Design of a Biochemical Cultivation Process, Bioprocess Engineering, 18, 227-234.
7. Garipov E. (2004). Systems Identification, Technical University, Sofia, Bulgaria.
8. Georgieva O., M. Arndt, B. Hitzmann (2001). Modelling of Escherichia coli Fed-batch Fermentation, International Symposium “Bioprocess Systems’2001 – BioPS’01”, Sofia, Bulgaria, October 1-3, I.61-I.64.
9. Hristozov I., T. Pencheva, M. Arndt, B. Hitzmann, St. Tzonkov (2001). Modelling of Functional States of Aerobic Fed-batch Yeast Growth Process, International Symposium “Bioprocess Systems’2001 – BioPS’01”, Sofia, Bulgaria, October 1-3, I.57-I.60.
10. Levisauskas D., V. Galvanauskas, S. Henrich, K. Wilhelm, N. Volk, A. Lubbert (2003). Model-based Optimization of Viral Capsid Protein Production in Fed-batch Culture of Recombinant Escherichia coli, Bioprocess and Biosystems Engineering, 25, 255-262. 11. O’Beirne D., G. Hamer (2000). Oxygen Availability and the Growth of Escherichia coli
W3110: A Problem Exacerbated by Scale-up, Bioprocess Engineering, 23, 487-494.
12. O’Beirne D., G. Hamer (2000). The Utilization of Glucose/Acetate Mixtures by
Escherichia coli W3110 under Aerobic Growth Conditions, Bioprocess Engineering, 23, 375-380.
13. Roeva O. (2005). Genetic Algorithms for a Parameter Estimation of a Fermentation Process Model: A Comparison, Bioautomation, 3, 19-28.
14. Roeva O., T. Pencheva, B. Hitzmann, St. Tzonkov (2004). A Genetic Algorithms Based Approach for Identification of Escherichia coli Fed-batch Fermentation, Bioautomation,
1, 30-41.
15. Xu B., M. Jahic, S.-O. Enfors (1999). Modeling of Overflow Metabolism in Batch and Fed-batch Cultures of Escherichia coli, Biotechnology Progress, 15, 81-90.