ISSN 0104-6632 Printed in Brazil
www.abeq.org.br/bjche
Vol. 31, No. 02, pp. 347 - 354, April - June, 2014 dx.doi.org/10.1590/0104-6632.20140312s00002587
Brazilian Journal
of Chemical
Engineering
MODELING THE MICROBIAL GROWTH
OF TWO
Escherichia coli
STRAINS IN A
MULTI-SUBSTRATE ENVIRONMENT
M. E. Poccia
1, A. J. Beccaria
1and R. G. Dondo
2*1Laboratorio de Fermentaciones, Facultad de Bioquímica y Ciencias Biológicas,
Universidad Nacional del Litoral Ciudad Universitaria, Paraje El Pozo (S3000ZAA), Santa Fe, Argentina.
2
Instituto de Desarrollo Tecnológico para la Industria Química, INTEC, CONICET, Phone: + 54 42 559174 77, Fax: + 54 42532965, Universidad Nacional del Litoral, Güemes 3450, (3000) Santa Fe, Argentina.
*
E-mail: [email protected]
(Submitted: March 6, 2013 ; Revised: August 1, 2013 ; Accepted: September 10, 2013)
Abstract - The microbial growth in multi-substrate environments may be viewed as an optimal resources allocation problem. The optimization aims at maximizing some biological objective like the biomass growth. The models developed using this hypothesis are called “cybernetic” and they represent the complex cell structure as an optimizing function that regulates the intracellular enzymatic machinery. In this work, a cybernetic model was developed to represent the growth of two E. coli strains (JM 109 and BL 21 –DE3–) on a medium containing glucose and glycerol as carbon and energy sources. The model was able to accurately simulate the biomass growth, the substrates consumption and the growth-rate profiles.
Keywords: Cybernetic model; Optimal control; Escherichia coli; Multi-substrates; Glycerol.
INTRODUCTION
Modeling the kinetics of a fermentation process in complex media remains a challenge for biochemi-cal engineers and biotechnologists. Although empiri-cal models such as the Monod equation describe the growth kinetics on a single substrate, they are usu-ally not useful for a multi-substrate environment. Different growth phenomena such as sequential utili-zation of substrates, simultaneous substrates con-sumption and co-metabolism of substrates may be observed in these environments (Bajpai-Dikshit et al., 2003). There have been numerous attempts to model these phenomena with an unified representa-tion. A successful approach to these phenomena was the cybernetic modeling concept developed by Ramkrishna and co-workers (Kompala et al., 1984; Kompala et al., 1986; Varner and Ramkrishna, 1999; Song and Ramkrishna, 2010).
In biochemical systems, many reactions are
Brazilian Journal of Chemical Engineering
cellular objectives of the wild-type and the geneti-cally altered systems are identical (Varner and Ramkrishna, 1998), supporting the use of the same objective function for predicting changes in dynam-ics due to regulatory effects.
Escherichia coli (E. coli) is perhaps the most
studied bacterium. It can adapt itself to very different growth conditions. High density cultures of several strains of E. coli are currently used to produce re-combinant proteins due to its high volumetric pro-ductivity; see e.g. Shiloach J. and Fass R. (2005) and Huang et al. (2012). This, in practice, has transformed
E. coli into a “factory” of recombinant proteins and
many pharmaceutical products are produced in this way.
E. coli is capable of consuming either glucose or
glycerol as carbon and energy (C/E) sources. Also it may consume either organic nitrogen (N) from sources such as peptones or inorganic (N)-salts. It is, therefore, extremely versatile. Although glucose is the classical (C/E)-source, glycerol is an attractive alternative because it has become an inexpensive and abundant (C/E)-source due to its generation as an inevitable by-product of biodiesel (Yazdani and Gonzalez, 2007; Gonzalez et al., 2008) and its over-production has become an issue of concern (Albarelli
et al., 2011). The replacement of glucose by glycerol
as (C/E)-source also allows obtaining higher biomass densities, probably because of a higher solubility and a slower catabolism, which avoids acetate production (Kortz et al., 1995). This makes glycerol a cheap option as the main substrate for numerous industrial cultures. So, it is desirable to adjust the E. coli growth conditions to promote glycerol consumption rather than glucose consumption. Nevertheless, glucose may be useful as a growth initiator. Consequently, in this work a cybernetic model has been used to de-scribe the dynamics of glucose and glycerol con-sumption by two E. coli strains (JM 109 and BL 21 – DE3-) in batch and batch + substrate-injection cultures.
MATERIALS AND METHODS
Microorganisms and Medium
E. coli BL 21 (DE3) and JM 109 strains were
grown on MEP medium adjusted according to guide-lines proposed by Giordano et al. (2010): acid hydrolysate of casein -AHC- (30 g/L); yeast extract (27.5 g/L); NaCl (1 g/L); glycerol (1 g/L) and glucose (1 g/L). Sterilization was done at 121 °C for 15 min. AHC and yeast extract were acquired from Britania, Argentina. NaCl, glycerol and glucose were
acquired from Cicarelli Laboratorios, Argentina. Al-though the concentrations of AHC, yeast extract and NaCl are relatively high, the increase in the yield with respect to produced biomass overcomes this disadvantage (Giordano et al., 2010).
Inoculum Preparations and Culture Conditions
A loopful of each strain (stored in MEP slant agar at 4 °C) was inoculated into a 250 ml Erlenmeyer flask containing 30 ml of sterilized MEP medium and grown overnight on a rotary shaker at 200 RPM and 30 °C. Aliquots of these cultures were pipetted into 250 ml Erlenmeyer flasks containing 30 ml of the same medium to obtain an initial optical density at 600 nm (OD600) of 0.2. The cultures were incubated at 200 rpm at 30 °C. Several samples were withdrawn from each culture.
Samples Analysis
OD600 was measured and used as an estimate of the cell mass (1 OD = 0.20 g dry weight/L). Aliquots were centrifuged (10.000 × g, 5 minutes) and super-natants were stored at -20 °C for further analysis.
Analytical
Glucose and glycerol concentrations were deter-mined in thawed samples. The enzymatic colorimet-ric assays from Glicemia Enzimática AA kit and TG Color GPO/PAP AA kit were employed for glucose and glycerol quantification, respectively. Both were purchased from Wiener Lab, Argentina. Determination accuracy is 90.7 mg/dL ± 2.20 mg/dL (C.V. = 1.39%) for glucose concentration and 1.14 g/L ± 0.021 g/L (C.V. = 1.82%) for the glycerol concentration.
Computational Tools
ODE and differential-algebraic equations (DAE) were solved by using the MATLAB ODE 45 solver (Mathworks, Natick, MA, USA) and the optimal control problems were solved by the GPOPS 4.1 toolbox (Rao et al, 2011) running on MATLAB 7.6.
MODEL DEVELOPMENT
The microbial growth is represented here in a way similar to the cybernetic model developed by Kompala et al. (1984):
(
)
/ i i 1 / i
e
X S i X S
In the assimilation of the ith substrate by the bio-mass X, it is assumed that there is one lumped key-enzyme which plays the bottleneck role and hence must be synthesized before the substrate is utilized for growth. The synthesis of the ith key enzyme in the presence of the ith substrate can be represented as follows:
i S
i
X ⎯⎯→ +X e (2)
The symbols X, Si and ei were used to represent
the pseudo-reaction “stoichiometry”, but subse-quently X will represent the biomass concentration,
Si will represent the concentration of the ith substrate
and ei will represent the normalized intracellular
level of the enzyme necessary to consume the ith
substrate.
The actual specific growth μ will arise from the sequential/simultaneous growth on all substrates. According to the modified Monod’s expression (Kompala et al., 1984), μ will be:
max i
i i
i i
i
S e
k S
μ = μ
+
∑
(3)where i is the substrate indicator, μimax is the maxi-mum specific growth rate on the substrate i and ki is
the Monod substrate saturation constant. The ODE for the substrate consumption and the specific enzyme formation rate in a batch environment are given by:
max
/
1
i i
i i
X Si i i
dS S
e X
dt = −Y μ k +S (4)
i
i i i i
de
a u b e
dt = − (5)
Some variations in the shape of the above equa-tion were proposed (Kompala et al., 1984 and 1986; Dhurjati et al., 1985; Doshi et al., 1997), but the fundamental structure of the ODE system remains unaltered. To model the E. coli-strain growth on a medium with glucose and glycerol, we selected the matching-law allocation model (Kompala et al., 1986) and the whole model-system may be written as:
max i
i i i
i i
i
dX S
e v X
dt =
∑
μ k +S (6)max
/
1
i
i i
i i
X Si i i
dS S
e v X
dt = −Y μ k +S (7)
'
i i
i i i i
i i
de S
u e
dt = α k +S −β (8)
The cybernetic variables ui and vi are computed
from the following algebraic equations:
max
max i
i i
i i
i
j
j j
j j
j
S e
k S
u
S e
k S
μ +
= ⎛ ⎞
μ
⎜ ⎟
⎜ + ⎟
⎝ ⎠
∑
(9)max
max
max
i
i i
i i
i
j
j j j
j j
S e
k S
v
S e
k S
μ + =
⎛ ⎞
μ
⎜ ⎟
⎜ + ⎟
⎝ ⎠
(10)
The parameters αi and βi stand respectively for
the specific activation rate and degradation rate of the key enzyme ei. The right-hand-side of Eq. (8)
ne-glects a term of intracellular dilution of the enzyme-level due to the biomass growth that is presented in the model by Kompala et al. (1986). Nevertheless, this dilution effect can be lumped into the βi
parame-ter and the DAE will not lose predictive capability at all. The maximum specific growth rates μimax and the
saturation constants ki are usually estimated by
fitting data from the exponential phases correspond-ing to the respective substrates. Also it is usually assumed that ki = k’i.
RESULTS AND DISCUSSION
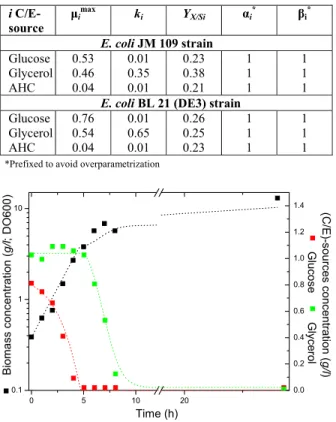
Experimental results for E. coli strains growing in a medium with glucose and glycerol are summarized in Table A.1 of the appendix. In both cultures we observed three growth stages: a fast growth stage on glucose followed by a slower growth stage on glyc-erol and a very slow growth phase utilizing the pep-tides from AHC as (C/E)-source. Hence, the whole culture seems to be triauxic. The model-parameters obtained by minimizing the least square errors be-tween the experimental data and the model predic-tions are reported in Table 1. To avoid an over-pa-rametrization of the model, the values of parameters αi and βi were prefixed. So, growth parameters in the
Brazilian Journal of Chemical Engineering
were forced to be identical in both least-squares fittings. Figures 1 and 2 compare the experimental data with the model predictions.
Table 1: Model parameters for the least squares fitting of experimental data from both batch runs.
i C/E-source
μimax ki YX/Si αi* βi*
E. coli JM 109 strain Glucose Glycerol AHC 0.53 0.46 0.04 0.01 0.35 0.01 0.23 0.38 0.21 1 1 1 1 1 1
E. coli BL 21 (DE3) strain Glucose Glycerol AHC 0.76 0.54 0.04 0.01 0.65 0.01 0.26 0.25 0.23 1 1 1 1 1 1
*Prefixed to avoid overparametrization
0 5 10 20
0.1 1 10 0.0 0.2 0.4 0.6 0.8 1.0 1.2 1.4 Bi o ma s s co n c e n tra ti o n ( g /l ; D O 6 0 0 ) Time (h) (C /E )-s o u rc e s c o n c e n tra tio n ( g /l ) G lu co s e G lyce ro l
Figure 1: Model predictions (dotted lines) vs. ex-perimental data (square symbols) for the E. coli JM 109strain.
0 5 10 20
0.1 1 10 0.0 0.2 0.4 0.6 0.8 1.0 1.2 1.4 B io m a s s c o n c e n tr a ti o n (g /l ; D O 6 0 0 ) Time (h) (C /E )-s o u rc e s co n c e n tra tio n (g /l) G lu c o s e G lyc e ro l
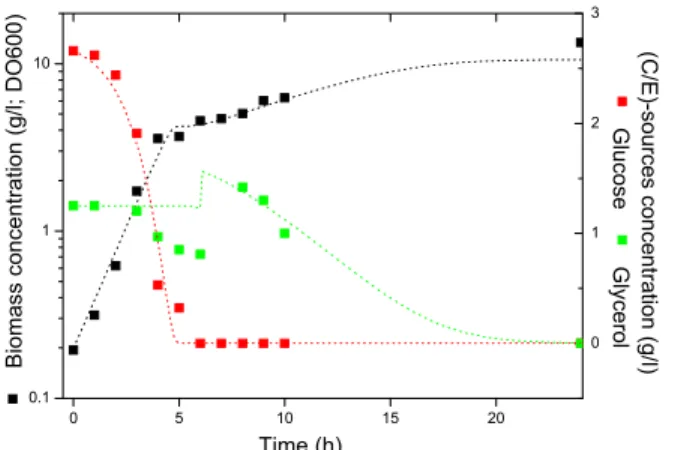
Figure 2: Model predictions (dotted lines) vs. ex-perimental data (square symbols) for the E. coli BL 21 (DE3) strain.
Since experimental data for the growth on peptides from AHC is scarce, the parameters for this stage present a significant degree of uncertainty.
Nevertheless, this should not affect the design of a medium with glucose and glycerol as the main (C/E)- sources because the growth on peptides from AHC is much slower than the growth on the former sub-strates. As our aim is to promote the utilization of glycerol while using glucose just as a growth-initia-tor, to design a batch + injection culture, we solved an optimal control problem. In that problem, the glycerol concentration may be changed by glycerol injections up to the final culture-time of tf = 10 h.
The growth stage on peptides from AHC was ne-glected in the optimization and the problem can be stated as follows:
Maximize X t
( ) ( )
f V tf (11)Subject to:
dV F
dt = (12)
max i
i i i
i i
i
dX S X
e v X F
dt =
∑
μ k +S − V (13)max
/
1 F
i i i i
i i i
X Si i i
dS S S S
e v X F F
dt = −Y μ k +S + V − V (14)
'
i i
i i i i
i i
de S
u e
dt = α k +S −β (15)
2 2
F
dQ FS
dt = (16)
Here F is the manipulated variable and the states are the culture volume (V), the biomass concentra-tion (X), the glucose concentration (S1), the glycerol concentration (S2), the normalized intracellular level of enzymes (e1 and e2) and the quantity Q2 of injected glycerol. Since the injection is glucose-free
S1F = 0 g/L and Q1 = 0 g. The concentration of glycerol in the feed is S2F = 5 g/L. The objective (Eq. 11) is the maximization, at the final run-time tf = 10 h, of
the biomass quantity subject to the constraints (Eqs. (12)-(16)) of a fed-batch bioreactor. The cybernetic variables ui and vi are computed from Eqs. (9) and
(10). In addition, the constraint (17) imposes an upper bound Q2max to the quantity of injected glycerol:
max
2 2
The optimal control problem is defined by the objective function (Eq. 11), the differential equations (Eqs. (12)-(16)), the algebraic Equations (9)-(10) and the state constraint (Eq. 17). It was coded on GPOPS 4.1 (Rao et al., 2011) and solved in a 2.0 GHz 16 GRAM PC.
We solved several instances of this optimal control problem by varying the initial states and the kinetic parameter values. In all cases, the glycerol addition consisted of an injection just before the start of the glycerol consumption. The explanation of this feed-shape is fairly simple. Since μ1max
for glucose is larger than for other substrates and the glucose-saturation constant k1 is also very low, the glucose is preferred in the sequential substrate utilization. Because μ1max > μ2max
and k1 < k2, the optimal profile will always yield a sequential substrates utilization.
So, an early injection of the “slow” substrate will not increase the actual growth rate at all and it might even brake the activation of the enzyme necessary for the degradation of the “fast” substrate (i.e., if μ1max is slightly larger than μ2max
). Hence, the injection will start just after the glucose depletion and will occur as early as possible. The goal is to minimize the effect of the Monod saturation-term for glycerol, aiming at:
max 2 max
2 2 2 2
2 2
S e v
k S
μ + ≈ μ (18)
An optimal substrate-addition profile is illustrated in Figure 3. The kinetic parameters and initial states of such a profile are reported in Table 2. The kinetic and yield parameters are those that fit the batch culture of the E. coli BL 21 (DE3)strain.
After this numerical experiment, we performed a batch + injection culture to grow the E. coli BL 21 (DE3) strain under the environmental conditions computed from the rule derived from the above optimal control problem. That rule consists of injecting glycerol just after glucose exhaustion.
Table 2: Model parameters and initial states for the optimal control problem solved to design the glycerol injection profile.
Time horizon tf = 10 h
Initial states
X(0) S1(0) S2(0) e1(0) e2(0) V(0) Q(0)
0.2 2.6 1.2 0.9 0.1 1.0 0
Yield and kinetic parameters
i C-source μimax ki YX/Si αi βi Glucose
Glycerol 0.76 0.54
0.01 0.65
0.26 0.25
1 1
1 1
2 4 6 8 10
0.0 0.2 0.4 0.6 0.8 1.0
F
e
e
d
r
a
te
(
l/
h
)
Time (h)
(a)
0 2 4 6 8 10
0.1 1 10
0.0 0.4 0.8 1.2 1.6 2.0 2.4 2.8
(b)
Bi
o
ma
s
s
c
o
n
ce
n
tra
ti
o
n
(g
/l
)
Time (h)
(C
/E)-s
o
u
rc
e
s
co
n
ce
n
tra
tio
n
(g
/l)
G
lu
co
se
G
lyce
ro
l
Figure 3: An optimal glycerol injection profile (a) and the evolution of the biomass and substrates concentrations (b).
The experimental results for such a run are summarized in Table A2 of the Appendix. The least squares fit of the model to the data yielded the pa-rameters reported in Table 3 and Figure 4 compares the model predictions with the experimental data.
The experimental results indicate a growth rate on glucose similar to the growth rate observed in the batch culture, but also indicate a simultaneous consumption of glucose and glycerol after t = 3 h and up to the time of the glycerol-injection. The simultaneous substrates-consumption was not caused
Table 3: Model parameters for the least squares fitting of the experimental results presented in Table A2.
i C-source μimax ki YX/Si αi* βi*
E. coli BL 21 (DE3) strain Glucose
Glycerol 0.75 0.14
0.12 0.60
0.66 0.25
1 1
1 1 Injection time
Injected volume
S2F
6 h 0.1 ml/mlculture 5 g/l
Brazilian Journal of Chemical Engineering
0 1 2 3
0 5 10 15 20
0.1 1 10
Time (h)
Bi
o
m
a
s
s
c
o
n
ce
n
tra
ti
o
n
(g
/l
;
D
O
6
0
0
)
(C
/E
)-so
u
rce
s
c
o
n
c
e
n
tra
tio
n
(g
/l)
G
lu
co
se
G
ly
c
e
ro
l
Figure 4: Model predictions (dotted lines) vs. experimental (square symbols) data for the batch + injection culture with the E. coli BL 21 (DE3) strain.
by the injection because it occurred before. Before this unexpected behavior and after the glycerol injection, the agreement is quite good. Therefore, the remaining experimental data seems to validate the model also in a batch + injection mode.
CONCLUSIONS
A cybernetic model based on the maximization of the instantaneous specific growth rate hypothesis is able to represent a variety of experimental growth data involving diauxic and triauxic growth. The model utilizes a lumped representation of the cell populations, and the microbial growth on various (C/E)-sources can be treated as a multivariable constrained optimization problem, as proposed by Kompala et al (1986). This model was chosen to predict the growth of two E. coli strains on a medium with glucose and glycerol. It can accurately represent the growth dynamics of both strains in batch runs.
To design a batch + injection culture, an optimal control problem was subsequently solved. As a consequence, an injection rule was derived and an additional experiment was performed. In that case, the agreement between the model predictions and the experimental data was not as good as for batch cultures, although this cannot be attributed to the glycerol injection. So, the empirical rule remains valid.
ACKNOWLEDGEMENTS
This work was supported by grants from Universidad Nacional del Litoral (CAI+D 2009-335
and CAI+D 2010 12-0035). We also want to thank the reviewer for helpful observations.
NOMENCLATURE
ai Specific activation rate for
the ithenzyme
bi Specific inactivation rate for
the ith enzyme
ei Normalized intracellular
level of the ith enzyme
ki; ki’ Monod substrate saturation
constant
g/L
F Feed rate L/h
Qi Mass of the ith substrate
injected to the culture
Si Concentration of the ith
substrate
g/L
SiF Concentration of the ith
substrate in the feed
g/L
ui Cybernetic variable for
controlling the synthesis of the ithenzyme
vi Cybernetic variable for
regulating the activity of the
ith enzyme
V Culture volume L
X Biomass concentration g/L
YX/Si Yield of biomass on the i th
substrate
g/g
Greek Symbols
αi Specific activation rate of
the ith enzyme
βi Specific inactivation rate of
the ith enzyme ei
μ Actual specific growth rate h-1
max i
μ Maximum growth rate on the ith substrate
h-1
REFERENCES
Albarelli, J., Santos, D. and Holanda, M., Energetic and economic evaluation of waste glycerol co-generation in Brazil. Brazilian Journal of Chemical Engineering, 28(4), 691-698 (2011).
Bajpai-Dikshit, J., Suresh, A. and Venkatesh, K., An optimal model for representing the kinetics of growth and product formation by Lactobacillus
rhamnosus on multiple substrates. Journal of
Dhurjati, P., Ramkrishna, D., Flickinger, M. C. and Tsao, G. T., A cybernetic view of microbial growth: Modeling of microbes as optimal strategists. Biotechnology and Bioengineering, 27, 1-9 (1985). Doshi, P., Rengaswamy, R. and Venkatesh, K.,
Modelling of microbial growth for sequential utili-zation in a multisubstrate environment. Process Biochemistry, 32(8), 643-650 (1997).
Giordano, P., Martínez, H., Iglesias, A., Beccaria, A. and Goicoechea, H., Application of response surface methodology and artificial neural net-works for optimization of recombinant Oryza
sativa non-symbiotic haemoglobin-1 production
by Escherichia coli in medium containing
by-product glycerol. Bioresource Technology, 101, 7537-7544 (2010).
Gonzalez, R., Murarka, A., Dharmadi, Y. and Yazdani, S., A new model for the anaerobic fermentation of glycerol in enteric bacteria: Trunk and auxil-iary pathways in Escherichia coli. Metabolic Engineering, 10, 234-245 (2008).
Huang, C-Jr, Lin, H., Yang, X., Industrial production of recombinant therapeutics in Escherichia coli
and its recent advancements. Journal of Industrial Microbiology and Biotechnology, 39, 383-399 (2012).
Kompala, D., Ramkrishna, D., Jansen, N. and Tsao, G., Investigation of bacterial growth on mixed substrates: Experimental evaluation of cybernetic models. Biotechnology and Bioengineering, 28, 1044-1055 (1986).
Kompala, D., Ramkrishna, D. and Tsao, G., Cyber-netic modeling of microbial growth on multiple substrates. Biotechnology and Bioengineering, 27, 1272-1281 (1984).
Kortz, D., Rinas, U., Hellmuth, K., Sanders, E. and Deckwer, W., Simple fed-batch technique for high cell density cultivation of Escherichia coli. Journal of Biotechnology, 39(1) 59-65 (1995). Rao, A. V., Benson, D., Darby, C., Francolin, C.,
Patterson, M., Sanders, I. and Huntington, G. T., User’s Manual for GPOPS Version 4.0 (2011). Shiloach, J., Fass, R., Growing E. coli to high cell
density. A historical perspective on method de-velopment. Biotechnology Advances, 23(5), 345-357 (2005).
Song, H. S. and Ramkrishna, D., Prediction of meta-bolic function from limited data: Lumped Hybrid Cybernetic Modeling (L-HCM). Biotechnology and Bioengineering, 106(2), 271-284 (2010). Varner, J. and Ramkrishna, D., Metabolic engineering
from a cybernetic perspective. 1. Theoretical pre-liminaries. Biotechnology Progress, 15(3), 407-425 (1999).
Varner, J. and Ramkrishna, D., Application of cyber-netic models to metabolic engineering: Investiga-tion of storage pathways. Biotechnology and Bio-engineering, 58(2-3), 282-291 (1998).
Brazilian Journal of Chemical Engineering
APPENDIX
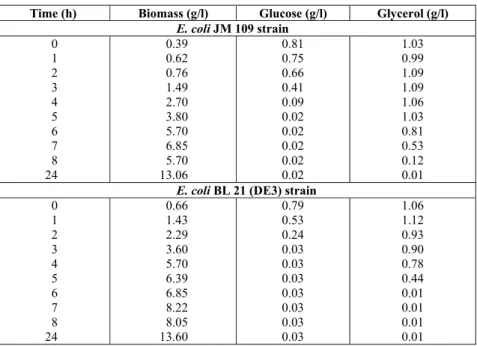
Table A.1: Experimental growth data for batch culture of E. coli strains JM 109 and BL 21 (DE3)on a mixed medium of glucose and glycerol.
Time (h) Biomass (g/l) Glucose (g/l) Glycerol (g/l) E. coli JM 109 strain
0 1 2 3 4 5 6 7 8 24
0.39 0.62 0.76 1.49 2.70 3.80 5.70 6.85 5.70 13.06
0.81 0.75 0.66 0.41 0.09 0.02 0.02 0.02 0.02 0.02
1.03 0.99 1.09 1.09 1.06 1.03 0.81 0.53 0.12 0.01
E. coli BL 21 (DE3) strain 0
1 2 3 4 5 6 7 8 24
0.66 1.43 2.29 3.60 5.70 6.39 6.85 8.22 8.05 13.60
0.79 0.53 0.24 0.03 0.03 0.03 0.03 0.03 0.03 0.03
1.06 1.12 0.93 0.90 0.78 0.44 0.01 0.01 0.01 0.01
Table A.2: Experimental growth data for batch + injection culture of E.
coli BL 21 (DE3) strain on a mixed medium of glucose and glycerol.
Time (h) Biomass (g/l) Glucose (g/l) Glycerol (g/l) E. coli BL 21 (DE3)
0 1 2 3 4 5 6 7 8 9 10 24
0.19 0.31 0.62 1.73 3.57 3.67 4.56 4.69 5.04 6.02 6.74 13.4
2.66 2.62 2.44 1.91 0.53 0.32 0.00 0.00 0.00 0.00 0.00 0.00